. 2025 Jan;27(1):130-140.
doi: 10.1038/s41556-024-01555-z. Epub 2025 Jan 3.

Chaperone-mediated insertion of mitochondrial import receptor TOM70 protects against diet-induced obesity

Affiliations

Chaperone-mediated insertion of mitochondrial import receptor TOM70 protects against diet-induced obesity

Pedro Latorre-Muro et al. Nat Cell Biol. 2025 Jan.

Abstract

Outer mitochondrial membrane (OMM) proteins communicate with the cytosol and other organelles, including the endoplasmic reticulum. This communication is important in thermogenic adipocytes to increase the energy expenditure that controls body temperature and weight. However, the regulatory mechanisms of OMM protein insertion are poorly understood. Here the stress-induced cytosolic chaperone PPID (peptidyl-prolyl isomerase D/cyclophilin 40/Cyp40) drives OMM insertion of the mitochondrial import receptor TOM70 that regulates body temperature and weight in obese mice, and respiratory/thermogenic function in brown adipocytes. PPID PPIase activity and C-terminal tetratricopeptide repeats, which show specificity towards TOM70 core and C-tail domains, facilitate OMM insertion. Our results provide an unprecedented role for endoplasmic-reticulum-stress-activated chaperones in controlling energy metabolism through a selective OMM protein insertion mechanism with implications in adaptation to cold temperatures and high-calorie diets.


Conflict of interest statement

Competing interests: The authors declare no competing interests.

Figures

Extended Data Fig. 1.
Extended Data Fig. 1.. Determination of physiological parameters in HFD-fed PERK−/− mice.
a, Body weight over 16 weeks under HFD in either AdipoQ-Cre (left panel) or UCP-Cre (right panel) expressing PERKflox/flox mice. WT = PERK+/+, KO = PERK−/−. AdipoQ-Cre nWT=5, nKO=6; UCP1-Cre nWT=6, nKO=10. Mean±SD and two-way ANOVA statistics are presented. b, Body weight gain (%) over 16 weeks under HFD in UCP-Cre expressing PERKflox/flox mice. WT = PERK+/+ (n=6) and KO = PERK−/− (n=10). Mean±SD and two-way ANOVA statistics are presented. d, Food intake in adipocyte-specific HFD-fed PERK+/+ (WT, n=5) and PERK−/− (KO, n=5) mice at 30°C. Mean±SD is presented. Two-way ANOVA showed no differences. e, Rectal temperature at different time points upon cold exposure in adipocyte-specific 20-week HFD-fed PERK KO mice (PERK−/−, n=5) and controls (PERK+/+, n=6). Mean±SD and two-way ANOVA statistics are presented. f, Glucose tolerance test. Blood glucose levels at different time points in brown adipocyte-specific 20-week HFD-fed PERK KO mice (PERK−/−, n=7) and controls (PERK+/+, n=5). Mice were fasted for 16 hours, and glucose tolerance was measured after intraperitoneal injection of glucose (2g/Kg). Mean± SD and two-way ANOVA statistics are presented. g, Blood glucose levels after 16-hour fasting, from panel f, in brown adipocyte (UCP1-Cre)-specific PERK−/− (KO, n=7) and PERK+/+ (WT, n=5) controls. Mean± SD and two-sample two-sided t-test are presented. h, Insulin tolerance test. Blood glucose levels at different time points in adipocyte-specific 20-week HFD-fed PERK KO mice (PERK−/−, n=10) and controls (PERK+/+, n=6). Mice were fasted for 6 hours, and insulin tolerance was measured after intraperitoneal injection of insulin (0.75U/Kg). Mean± SD and two-way ANOVA statistics are presented. Source numerical data are available in source data.
Extended Data Fig. 2.
Extended Data Fig. 2.. Alterations in mitochondrial ultrastructure in HFD-fed PERK−/− mice determined by TEM.
Representative TEM images from HFD-fed PERK+/+ and PERK−/− mice. A total of 20 images per mouse were analyzed. Samples were processed in batches of one PERK+/+ and PERK−/− at a time. A total of four mice per group were analyzed. Representative images from four mice per genotype are presented. Information is provided in Fig. 2a and Methods.
Extended Data Fig. 3.
Extended Data Fig. 3.. Impact of PERK suppression on mitochondrial proteins and function upon HFD.
a, Mitochondrial protein levels determined by SDS-PAGE in isolated mitochondria from PERK+/+ and PERK−/− HFD-fed mice, one animal per lane. b, Oxygen consumption rates in isolated iBAT mitochondria from HFD-fed PERK−/− and PERK+/+ mice. n=4, Mean±SD is presented. c, Relative NAD+/NADH ratios in PERK+/+ (n=4) and PERK−/− (n=4) HFD-fed mice. Mean±SD and two-sample two-sided t-test are presented. d, Densitometry protein quantitation from the experiments shown in Fig. 2e, n=4, mean±SD and two-way ANOVA with Dunnett’s multiple test correction are presented. Mitochondria from three mice were pooled used per replicate. n=number of biological replicates. e, Assembly of ANT2 into the ANT protein complex by blue-Native PAGE immunoblotting. f, Volcano plot representing metabolomics data from whole iBAT tissues from PERK+/+ (WT) and PERK−/− (KO) mice. Multiple two-sided t-tests are presented. g, Relative leucine-isoleucine levels in PERK+/+ and PERK−/− HFD-fed mice. Mean±SD and two-sample two-sided t-test are presented. h, In vitro incorporation of 14C-leucine after 10 minutes into isolated mitochondria from PERK−/− (KO, n=3) and PERK+/+ (WT, n=3) HFD-fed mouse iBAT. Mean± SD and two-sample two-sided t-test are presented. Source numerical data and unprocessed blots are available in source data.
Extended Data Fig. 4.
Extended Data Fig. 4.. Regulation of PPID levels during high fat dietary stress.
a, Proteomics data analysis volcano plots and workflow. Right, potential chaperones downregulated in HFD-fed PERK−/− mice as determined from whole-tissue proteomics. Multiple two-sided t-tests are presented. b, PPID protein levels in mitochondria from differentiated brown adipocytes exposed to norepinephrine (NE) or NE supplemented with a PERK inhibitor (NE+PERKi). MIC19 was used as a positive control c, PPID levels in mitochondria from differentiated brown adipocytes determined by western blot analysis under conditions described in b. d, PPID levels in adipocyte-specific cold-acclimated PERK+/+ and PERK−/− mice. e, Relative Ppid mRNA levels in PERK+/+ (n=3) and PERK−/− (n=4) HFD-fed mice. Mean±SD. No statistical differences were found. One-way ANOVA with multiple t-tests were performed. f, Protein levels in differentiated brown adipocytes upon PERK silencing (siPERK) and/or palmitate stimulation. g, PPID levels in differentiated brown adipocytes determined by western blot analysis after palmitic acid (PA) stimulation or PA supplemented with PERK inhibitor (PA+PERKi). h, Relative Ppid mRNA levels in differentiated brown adipocytes under conditions explained in g. Mean±SD, n=4. One-way ANOVA statistics are presented. i, Levels of PPID in cells upon inhibition of the PERK-eIF2α pathway with ISRIB in the presence or absence of palmitic acid (PA). ATF4 was used as a positive control. j, Determination of PPID half-life by cycloheximide chase experiments. Differentiated brown adipocytes were treated with palmitic acid (PA) and PERK was knock-down (siPERK) as indicated. k, Graphical representation of PPID levels from the experiments described in i,. n=4, mean±SD and two-way ANOVA with Dunnett’s multiple test correction are presented. n=number of biological replicates. l, Determination of PPID ubiquitination by pull-down assays from differentiated brown adipocytes under conditions described in j. MG132 was added at 20 μM 4 hours before harvesting the cells. m, Densitometry protein quantitation from the experiments shown in Fig. 3h, n=4, mean±SD and two-way ANOVA with Dunnett’s multiple test correction are presented. n=number of biological replicates. Source numerical data and unprocessed blots are available in source data.
Extended Data Fig. 5.
Extended Data Fig. 5.. PPID regulates mitochondrial protein import.
a, In vitro import of either 35S-ANT2, 35S-MIC19 and 35S-OTC into isolated mitochondria from brown adipocytes upon PERK or PPID knock-down and palmitate stimulation. B=blank tube containing only precursor, ΔΨ=membrane potential. Below, graphical representation from the experiment represented above. Mean± SD and two-way ANOVA with Dunnett’s multiple test correction are presented (ANT2, n=4 each group; MIC19 and OTC, n=3 each group). b, Blue-Native PAGE immunoblots assessing the assembly of TOM40, TOM70, TIM22 and TIM23 complexes under the conditions described in a. c, Determination of mitochondrial membrane potential by TMRM and MitoTracker Green staining in differentiated brown adipocytes under the conditions described in a. Source numerical data and unprocessed blots are available in source data.
Extended Data Fig. 6.
Extended Data Fig. 6.. PPID conservation and characterization of residues with key biological activities.
a, ProteinBlast analysis using mouse PPID protein sequence (NP_001343255.1) and top hits. E-value indicates the expect parameter for a specific hit, the lower, the more significant. b, Alignment of the top hit domains indicated in a. c, Superimposition of aligned domains between PPID (PDB: AF-Q3UB60) and TOM70 (PDB: AF-Q9CZW5) and detail of the CX14(F/Y)R motif indicated in b. d, Kinetic PPIase assay of different PPID mutants. PPIase activity is normalized to controls (WT). Mean± SD and one-way ANOVA with Dunnett’s multiple test correction are presented (n=3). n=number of biological replicates. e, Determination of PPID TPR activity by its ability to bind to HSP90 C-terminal domain (CTD) using pull-down affinity assays with Co-NTA resin. f, Quantification of protein binding from e. Mean± SD and one-way ANOVA with Tukey’s multiple test correction are presented (n=3). n=number of biological replicates. g, 35S-TOM70 insertion into naked liposomes in the presence of PPID WT and H141A mutant with or without 100μM cyclosporin A (CsA). One-way ANOVA statistics are presented for individual comparisons (n=4). n=number of biological replicates. h, Thermal shift assay experiments evaluating the binding of CsA to PPID WT and H141A mutant. Thermal shifts are annotated for three independent assays. i, Coomassie stained gel showing isolated PPID, HSC70 and HSP90 used in Fig. 4d. Source numerical data and unprocessed blots are available in source data.
Extended Data Fig. 7.
Extended Data Fig. 7.. In vitro reconstitution of PPID-TOM70 complexes.
a and b, Separation of PPID-TOM70 complexes by Size Exclusion Chromatography (SEC) after incubation at 37°C. c, Light scattering mass photometry on the indicated fractions from Fig. 5a. Source numerical data and unprocessed blots are available in source data.
Extended Data Fig. 8.
Extended Data Fig. 8.. Effects of PPID suppression in adipocytes in HFD-fed mice.
a, Design and generation of PPIDflox/flox mice using EasiCRISPR. b, Example of genotyping during the generation of adipocyte-specific PPID−/− mice. c, PPID levels across different tissues in adipocyte-specific PPID−/− lean mice. d, Body weight over 8 weeks under HFD in adipocyte-specific PPID+/+ (n=13) and PPID−/− (n=12). Mean±SD is presented. n=number of biological replicates. e, Magnetic Resonance Imaging to determine lean and fat composition in PPID WT (n=8, PPID+/+) and KO (n=6, PPID−/−) mice. Mean±SD and multiple two-sided t-test comparisons are presented. f-h, Determination of free fatty acids (n=4 each group), adiponectin (WT n=4, PPID−/− n=5, PERK−/− n=5) and leptin (WT n=4, PPID−/− n=5, PERK−/− n=5) levels in mouse sera. Mean± SD. One-way ANOVA with Tukey’s multiple comparisons are presented. i, Body weight in adipocyte-specific PPID−/− (KO, n=6) and PPID+/+ (WT, n=8) controls after 12 weeks under HFD. Mean± SD and two-sample two-sided t-test are presented. n=number of biological replicates. j, Food intake in adipocyte-specific HFD-fed PPID+/+ (WT, n=8) and PPID−/− (KO, n=6) mice at 30°C. Mean±SD is presented. No significant differences were detected, two-sample two-sided t-test. n=number of biological replicates. k, Rectal temperature over time in PPID WT (n=8, PPID+/+) and KO (n=6, PPID−/−) male mice. Mean±SD and multiple two-way ANOVA comparisons are presented. l, Tissue weights in adipocyte-specific HFD-fed PPID+/+ (WT, n=5) and PPID−/− (KO, n=5) mice. Mean±SD and multiple t-test comparisons are presented. Source numerical data and unprocessed blots are available in source data.
Extended Data Fig. 9.
Extended Data Fig. 9.. Alterations in mitochondrial ultrastructure in HFD-fed PPID−/− mice determined by TEM.
Representative TEM images from HFD-fed PPID+/+ and PPID−/− mice. A total of 20 images per mouse were analyzed. Samples were processed in batches of one PPID+/+ and PPID−/− at a time. A total of three mice per group were analyzed. Representative images from three mice per genotype are presented. Information is provided in Fig. 7a and Methods.
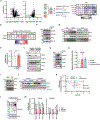
Fig. 1.
Fig. 1.. PERK suppression causes obesity, and glucose intolerance.
a, Body weight gain (%) over 16 weeks under HFD in AdipoQ-Cre PERKflox/flox mice. WT = PERK+/+ (n=5), KO = PERK−/− (n=6). Mean±SD and two-way ANOVA statistics are presented. b, Oxygen consumption in adipocyte-specific HFD-fed PERK+/+ (WT, n=5) and PERK−/− (KO, n=5) mice at 30°C. Two-sided ANCOVA statistics are presented. c, Glucose tolerance test. Blood glucose levels at different time points in adipocyte-specific 20-week HFD-fed PERK KO mice (PERK−/−, n=10) and controls (PERK+/+, n=6). Mice were fasted for 16 hours, and glucose tolerance was measured after intraperitoneal injection of glucose (2g/Kg). Mean± SD and two-way ANOVA statistics are presented. d, Blood glucose levels from Fig. 1c after 16-hour fasting in adipocyte AdipoQ-Cre-specific PERK−/− (KO) and PERK+/+ (WT) controls. nWT=6, nKO=10. Mean± SD and two-sample two-sided t-test are presented. e, Serum insulin levels in adipocyte-specific HFD-fed PERK−/− (KO, n=5) and controls PERK+/+ (WT, n=5) mice. Mean± SD and two-sample two-sided t-test are presented. Source numerical data are available in source data.
Fig. 2.
Fig. 2.. PERK suppression impairs TOM70 insertion and mitochondrial function.
a, Electron microscopy images show decreased cristae density and structural aberrations in PERK−/− mice compared to PERK+/+ controls. The graph on the right represents the distribution of cristae density compared to PERK+/+ controls fitted to a normal distribution (mean±2SD). Mitochondria from 4 different mice were analyzed. Mean± SD and multiple t-tests with Holm-Šídák correction are presented. b, Determination of oxygen consumption in iBAT mitochondria from PERK+/+ and PERK−/− HFD-fed mice. n=4 mice in each group, mean± SD, and multiple two-sided t-test comparison statistics are presented. c, In vitro import of either 35S-ANT2 or 35S-OTC after 5 minutes into isolated mitochondria from PERK−/− (KO) and PERK+/+ (WT) HFD-fed mice. B=blank tube containing only precursor, ΔΨ=membrane potential. d, Graphical representation from the experiment represented in c. PERK−/− (KO, n=4) and PERK+/+ (WT, n=4). Mean± SD and two-sample t-test are presented. e, Western blot analyses of mitochondrial proteins in isolated mitochondria (left panel) and after carbonate extraction (right panel). A pool of mitochondria from three animals per replicate. f, In vitro incorporation of 35S-TOM70 into isolated mitochondria from PERK−/− (KO) (n=4) and PERK+/+ (WT) HFD-fed mice (n=4). Samples were resolved by BN-PAGE. Mean± SD and two-way ANOVA regression statistics are presented. g, In vitro incorporation of 14C-leucine into isolated mitochondria from PERK−/− (KO, n=3) and PERK+/+ (WT, n=3) HFD-fed mice. Mean± SD and two-way ANOVA statistics are presented. Source numerical data and unprocessed blots are available in source data.
Fig. 3.
Fig. 3.. Cytosolic chaperone PPID regulates TOM70 import and mitochondrial respiratory function.
a, Gene ontology enrichment analysis of the specific PERK-dependent pathways affected upon HFD. b, Network analysis from the targets in a, depicting the main connected nodes using the STRING database. c, Volcano plot representation from isolated mitochondria proteomics highlighting the components of the chaperone clusters identified in b. PPID is the only downregulated chaperone. Multiple t-testing two-sided comparisons are presented. d, Determination of PPID levels and other chaperones by SDS-PAGE in PERK+/+ and PERK−/− mice, one animal per lane. e, Impact of PPID ectopic expression on TOM70 levels in the presence or absence of PERK and/or palmitate in the medium. f, High-resolution respirometry in differentiated brown adipocytes in response to palmitate stimulation, PERK suppression and palmitate, and PERK suppression and palmitate rescued by PPID re-expression. Mean± SD, n=4, and one-way ANOVA with Tukey’s comparisons are presented. g, In vitro incorporation of 35S-TOM70 into isolated mitochondria from mouse iBAT over time in the presence of 5 μM PPID or BSA control. Right, graphical representation from the experiments, n=4, mean± SD, and two-way ANOVA statistics are presented. h, Protein levels in differentiated brown adipocytes upon PPID knock-down (siPpid) and/or palmitate stimulation for 24h. i, In vitro incorporation of 35S-TOM70 into isolated mitochondria from PPID knock-down (siPpid) or control differentiated brown adipocytes. n=4, mean± SD, and two-way ANOVA statistics are presented. j, High-resolution respirometry in differentiated brown adipocytes in response to PPID suppression, palmitate stimulation, or PPID suppression and palmitate. n=3, Mean± SD and one-way ANOVA with Tukey’s comparisons are presented. In, g, i, j, n= number of biological replicates. Source numerical data and unprocessed blots are available in source data.
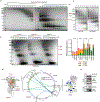
Fig. 4.
Fig. 4.. PPID PPIase and TPR domains are required for TOM70 insertion.
a, Interactions between PPID and TOM70 were determined by pull-down assays using recombinant 10xHis tagged PPID mutants and 35S-labeled TOM70. Non-tagged protein was used as a control. The bar plot below shows the quantification (mean±SD) from four independent experiments (n=3 biological replicates). One-way ANOVA followed by Tukey comparison tests were used. b, In vitro incorporation of 35S-TOM70 into isolated mitochondria in the presence of PPID mutants or control BSA. The bar plot below shows the quantification (mean±SD) from three independent experiments. One-way ANOVA followed by Tukey comparison tests were used. c, In vitro incorporation of 35S-TOM70 over time into liposomes in the presence of PPID mutants or BSA control. The plot below shows the quantification (mean±SD) from three independent experiments. One-way ANOVA followed by Dunnett’s multiple comparison tests were used. d, In vitro incorporation of 35S-TOM70 or 35S-TOM20 over time into liposomes in the presence of BSA control or chaperones PPID, HSC70, or HSP90. The bar plot below shows the quantification (mean±SD) from three independent experiments. One-way ANOVA followed by Tukey comparison tests were used. Source numerical data and unprocessed blots are available in source data.
Fig. 5
Fig. 5. PPID and TOM70 interact through their TPR domains.
a, Separation of PPID-TOM70 complexes by glycerol gradient ultracentrifugation after incubation at 37°C. b, Immunodetection of PPID or TOM70 on selected fractions from a. c, Comparative separation of PPID-TOM70 complexes by glycerol gradient ultracentrifugation after incubation at 37°C upon incubation with either PPID WT or C296S or R312 alleles. Bar plot on the right represents relative abundances across fractions 1 through 4 determined by densitometry. d, Circular diagram depicting PPID-TOM70 interactions by cross-linking mass spectrometry using SMCC as a crosslinker. Atomic AlphaFold models for mouse TOM70 (AF-Q9CZW5) and PPID (AF-Q3UB60) highlighting the SMCC-linked residues as spheres. The TOM70 substrate cavity (from PDB 7KDT) is represented in salmon. e, Co-immunoprecipitation of PPID and TOM70 in differentiated brown adipocytes. Ectopically expressed PPID with a myc tag was immunoprecipitated using mock transduced cells as a control. Source numerical data and unprocessed blots are available in source data.
Fig. 6.
Fig. 6.. PPID controls TOM70 membrane insertion and mitochondrial function in vivo in HFD-fed mice.
a, Body weight gain (%) over 16 weeks under HFD in adipocyte-specific PPID WT (PPID+/+, n=13) and KO (PPID−/−, n=12) mice. Mean±SD and two-way ANOVA statistics are presented. b, Glucose tolerance test. Blood glucose levels at different time points in adipocyte-specific 16-week HFD-fed PPID KO mice (PPID−/−, n=5) and controls (PPID+/+, n=7). Mice were fasted for 16 hours, and glucose tolerance was measured after intraperitoneal injection of glucose (2g/Kg). Mean± SD and two-way ANOVA statistics are presented. c, Blood glucose levels after 16-hour fasting in adipocyte-specific HFD-fed PPID−/− (KO, n=6) and PPID+/+ (WT, n=8) controls. Mean± SD and two-sample two-sided t-test are presented. n=number of biological replicates. d, Blood insulin levels in adipocyte-specific HFD-fed PPID−/− (KO, n=5) and controls PPID+/+ (WT, n=5) mice. Mean± SD and two-sample two-sided t-test are presented. e, Oxygen consumption in adipocyte-specific HFD-fed PPID+/+ (WT, n=7) and PPID−/− (KO, n=6) mice at multiple environmental temperatures. Two-sided ANCOVA statistics are presented. f, Increment in oxygen consumption (ΔO2) upon CL316,243 stimulation in mice housed at 30°C (WT n = 4, PERK−/− n = 5, and PPID−/− n=5, mean ± SD, *p < 0.05; BMR, basal metabolic rate). Two-way ANOVA statistics are presented. g, Detail of iBAT enlargement in HFD-fed PPID−/− compared to PPID+/+ mice. h, Hematoxylin-Eosin staining of iBAT sections denotes whitening of the tissue in PPID−/− mice. One section per animal is presented. Source numerical data are available in source data.
Fig. 7.
Fig. 7.. PPID controls TOM70 membrane insertion and mitochondrial function in vivo in HFD-fed mice.
a, Electron microscopy images show decreased cristae density in PPID−/− mice compared to PPID+/+ controls. The graph below represents the distribution of cristae density compared to PERK+/+ controls fitted to a normal distribution (mean±2SD). Mitochondria from 3 different mice (N=3) were analyzed. Mean± SD and multiple two-sided t-tests with Holm-Šídák correction are presented. b, Determination of protein levels by SDS-PAGE from whole iBAT tissue samples. One animal per lane. Plot indicates the quantitation of protein levels. Mean± SD, n=4, and multiple two-sided t-tests with Holm-Šídák correction are presented. c, In vitro incorporation of 35S-TOM70 over time into isolated iBAT mitochondria from PPID+/+ and PPID−/− HFD-fed mice. n=5 mice in each group, mean± SD, and two-way ANOVA statistics are presented. d, Determination of oxygen consumption in iBAT mitochondria from PPID+/+ and PPID−/− HFD-fed mice. n=4 mice in each group, mean± SD, and multiple t-test comparison statistics are presented. e, Oxygen consumption rates in isolated iBAT mitochondria from PPID−/− and PPID+/+ mice shown in panel d. n=4, Mean±SD is presented. f, Proposed model for the regulation of TOM70 OMM insertion through PERK-controlled cytosolic chaperone PPID under lipid stress or diet-induced obesity. Under conditions of dietary lipid overload, brown adipocytes activate PERK-dependent ER stress responses that increase PPID levels. Cytosolic PPID acts as a chaperone carrier for the mitochondrial receptor TOM70. PPID mediates TOM70 insertion into the outer mitochondrial membrane which participates in the delivery of mitochondrial precursors to the TOM40 pore. PPID functions as ER-stress and PERK dependent cytosolic chaperone that sustains mitochondrial respiration and thermogenesis, whole body glucose homeostasis and body weight balance. Image generated with Biorender. Source numerical data and unprocessed blots are available in source data.

References

    1. Barnes AS The epidemic of obesity and diabetes: Trends and treatments. Tex Heart Inst J 38, 142–144 (2011). - PMC - PubMed
    1. Wang Y. et al. Has the prevalence of overweight, obesity and central obesity levelled off in the United States? Trends, patterns, disparities, and future projections for the obesity epidemic. Int J Epidemiol 49, 810–823 (2021). - PMC - PubMed
    1. Kalyani RR, Golden SH & Cefalu WT Diabetes and aging: Unique considerations and goals of care. Diabetes Care 40, 440–443 (2017). - PMC - PubMed
    1. Chia CW, Egan JM & Ferrucci L Age-related changes in glucose metabolism, hyperglycemia, and cardiovascular risk. Circ Res 123, 886–904 (2018). - PMC - PubMed
    1. Luo C. et al. Obesity/Type 2 diabetes-associated liver tumors are sensitive to cyclin D1 deficiency. Cancer Res 80, 3215–3221 (2020). - PMC - PubMed

Methods-only references

    1. Uldry M. et al. Complementary action of the PGC-1 coactivators in mitochondrial biogenesis and brown fat differentiation. Cell Metab 3, 333–341 (2006). - PubMed
    1. Mina AI et al. CalR: A Web-Based Analysis Tool for Indirect Calorimetry Experiments. Cell Metab 28, 656–666.e1 (2018). - PMC - PubMed
    1. Shabalina IG et al. Uncoupling protein-1 is not leaky. Biochim Biophys Acta Bioenerg 1797, 773–784 (2010). - PubMed
    1. Chen ZL et al. A high-speed search engine pLink 2 with systematic evaluation for proteome-scale identification of cross-linked peptides. Nat Commun 10, 3404 (2019). - PMC - PubMed
    1. Perez-Riverol Y. et al. The PRIDE database resources in 2022: A hub for mass spectrometry-based proteomics evidences. Nucleic Acids Res 50, D543–D552 (2022). - PMC - PubMed

MeSH terms

Substances

Grants and funding

LinkOut - more resources