. 2025 Feb;44(4):1007-1038.
doi: 10.1038/s44318-024-00335-7. Epub 2025 Jan 3.

MTCH2 controls energy demand and expenditure to fuel anabolism during adipogenesis

Affiliations

MTCH2 controls energy demand and expenditure to fuel anabolism during adipogenesis

Sabita Chourasia et al. EMBO J. 2025 Feb.

Abstract

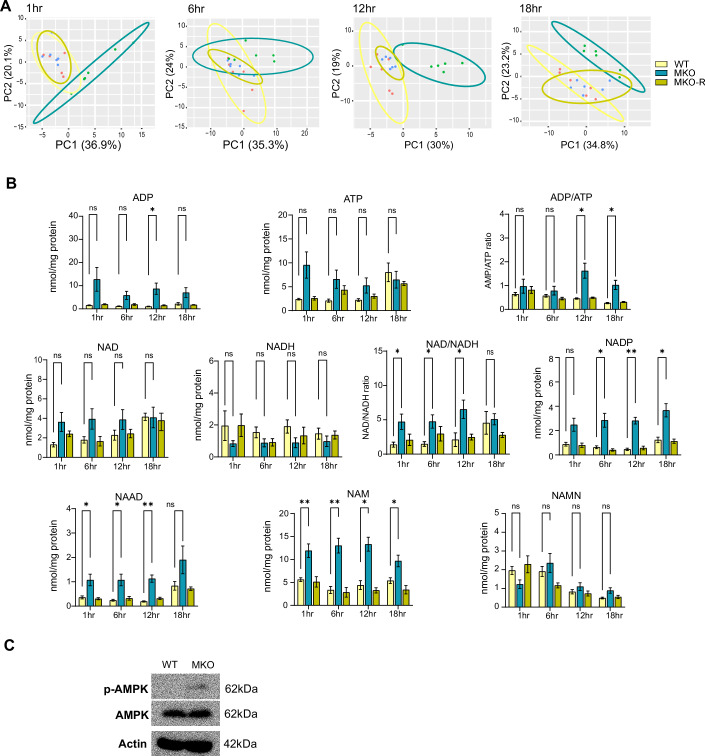
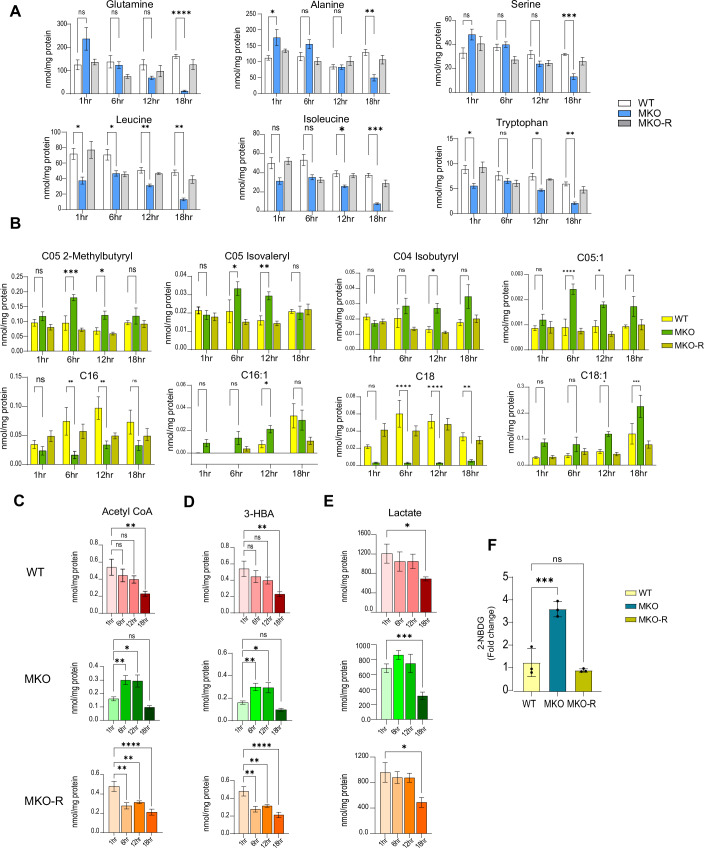
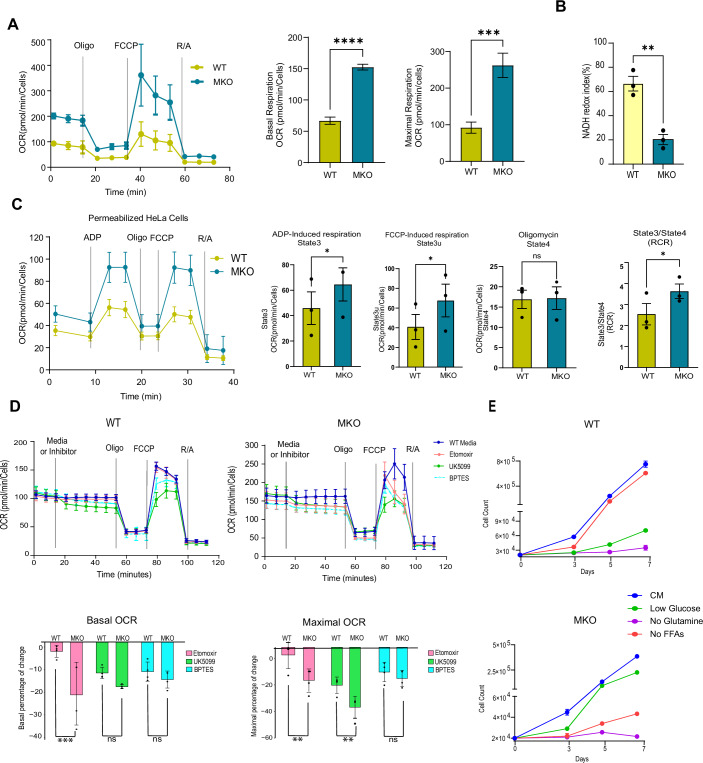
Mitochondrial carrier homolog 2 (MTCH2) is a regulator of apoptosis, mitochondrial dynamics, and metabolism. Loss of MTCH2 results in mitochondrial fragmentation, an increase in whole-body energy utilization, and protection against diet-induced obesity. In this study, we used temporal metabolomics on HeLa cells to show that MTCH2 deletion results in a high ATP demand, an oxidized cellular environment, and elevated utilization of lipids, amino acids, and carbohydrates, accompanied by a decrease in several metabolites. Lipidomics analysis revealed a strategic adaptive reduction in membrane lipids and an increase in storage lipids in MTCH2 knockout cells. Importantly, MTCH2 knockout cells showed an increase in mitochondrial oxidative function, which may explain the higher energy demand. Interestingly, this imbalance in energy metabolism and reductive potential triggered by MTCH2-deletion prevents NIH3T3L1 preadipocytes from differentiating into mature adipocytes, an energy consuming reductive biosynthetic process. In summary, the loss of MTCH2 leads to increased mitochondrial oxidative activity and energy demand, creating a catabolic and oxidative environment that fails to fuel the anabolic processes required for lipid accumulation and adipocyte differentiation.

Keywords: Adipogenesis; Energy Expenditure and Demand; MTCH2; Mitochondrial Oxidative Function.


Conflict of interest statement

Disclosure and competing interests statement. The authors declare no competing interests.

Figures

Figure 1
Figure 1. A high ATP demand and an oxidizing environment in MTCH2 knockout cells.
(A) PCA plots of WT, MKO, and MKO-R cell lines. Ellipses describe 95% confidence intervals. (B) Average levels of ADP, ATP, and ADP/ATP, NAD+, NADH, NAD+/NADH, NADP+, NAAD, NAM, and NAMN in all 3 cell lines at all four-time points. Results in all graphs in (B) are presented as mean ± SEM (*P < 0.05, **P < 0.001; two-way ANOVA with Dunnett multiple comparison test; n = 6 biological replicates). (C) MKO cells show an increase in AMPK phosphorylation. Western blot analysis of WT and MKO cells using anti-p-AMPK and anti-AMPK antibodies. β-Actin is used as a loading control. Source data are available online for this figure.
Figure 2
Figure 2. An increase in amino acid/lipid/carbohydrate utilization in MKO cells.
(A) Average levels of a set of amino acids in all 3 cell lines at all four time points. (B) Average levels of acylcarnitines in all 3 cell lines at all four time points. (CE) Average levels of acetyl CoA (C), 3-HBA (D) and lactate (E) in all 3 cell lines at all four time points. Results in all graphs in (AE) are presented as mean ± SEM (ns, non-significant, *P<0.05, **P<0.001, ***P<0.0003, ****P<0.0007; two-way ANOVA with Dunnett multiple comparison test (n = 6 independent biological replicates)). (F) Glucose uptake from media of WT and MKO cells after two-hour incubation in low-glucose medium. Results are presented as mean ± SEM (***P<0.0003); one-way ANOVA with Dunnett multiple comparison test (N = 3 independent experiment)). Source data are available online for this figure.
Figure 3
Figure 3. Increased mitochondrial Oxidative function in MKO cells.
(A) Representative traces of real-time OCR measurements in WT and MKO cells display basal respiration and OCR changes in response to sequential inhibitor injections (Left panel). The middle and right panels show basal and maximal respiration. Results are presented as mean ± SEM, with statistical significance determined by an unpaired t test (***P<0.0003, ****P<0.0007). Data represents one of three independent experiments, each with 6–8 technical replicates. (B) Reduced NADH redox in MKO cells. NADH redox index was calculated as described in “Methods”. Results are presented as mean percent ± SEM (Unpaired t test, **P<0.001). N = 3 independent experiments. (C) Respiratory Control Ratio (RCR) analysis on permeabilized WT and MKO cells. Succinate and rotenone are used to measure ADP phosphorylation and maximal respiration. State 3, State 3u, State 4, and RCR were calculated as described in “Methods”. Results are presented as mean percent ± SEM (Unpaired t test, *P<0.05; ns, non-significant). N = 3 independent experiments. (D) Representative traces of real-time OCR measurements of WT (top left panel) and MKO (top right panel) cells showing the basal respiration and OCR change in Basal and Maximal respiration Response to sequential injections of inhibitors. Percentage of change in basal OCR (bottom left panel) and Maximal OCR (bottom right panel) in response to UK5099, etomoxir, and BPTES in WT and MKO cells. Results are presented as mean percent ± SEM (two-way ANOVA, Post-hoc tests were done using estimated marginal means (R package ‘emmeans’). **P<0.001, ***P<0.0003). N = 4 independent experiments. (E) Cell count of WT and MKO cells proliferating under the conditions of complete medium (25 mM glucose), and medium with no free fatty acids (FFAs), low glucose (12 mM), or no glutamine. N = 3 independent experiments. Source data are available online for this figure.
Figure 4
Figure 4. Membrane lipids decrease and storage lipids and lipid droplets increase in MKO cells.
(A) Heat map comparing the levels of lipids at 20 h post media change in all 3 cell lines. Membrane lipids: TC total cholesterol, FC free cholesterol, PC phosphatidylserine, PI phosphatidylinositol, PG phosphatidylglycerol, PE phosphatidylethanolamine, PC phosphatidylcholine, PA phosphatidic acid, LPS Lyso-phosphatidylserine, LPI Lyso-phosphatidylinositol, LPG Lyso-phosphatidylglycerol, LPE Lyso-phosphatidylethanolamine, LPC Lyso-phosphatidylcholine, LPA Lyso-phosphatidic acid, LCL Lyso-cardiolipin, CL cardiolipin, SM sphingomyelin. Neutral/Storage lipids: TAG triglycerides, CE cholesterol ester, DAG diglycerides. Fatty acids: FA esterified fatty acid, FFA free fatty acids. Cholesterol: TC total cholesterol, FC free cholesterol. We calculated the average value of all species per category per biological replicate. These values were compared between groups using ANOVA. Values in the heat map are scaled to z-scores per row (compound category). ANOVA data also appears in Table EV1. (B) Level of esterified FFA (left panel) and FA (right panel), in all 3 cell lines. Results in graphs are presented as mean ± SEM (ns, non-significant, ***P<0.0003, ****P<0.0007; One-way ANOVA, n = 4 biological replicates). (C) Volcano plot comparing the levels of membrane and storage lipids between the WT and MKO cell lines.one-way ANOVA followed by Tukey’s post-hoc test, n = 4 biological replicates. (D) Left panel: WT and MKO cells were plated into complete media (CM), then media was refreshed (considered as time 0) and pictures were taken at 0, 12, 20, and 30 h-post media change. LDs were labeled using BODIPY 493/503, and mitochondria were labeled using MitoTracker deep red (MTDR) and nucleus by Hoechst. Right panel: Temporal quantification of the number of LDs in WT and MKO cells at the four time points. Results are presented as means ± SEM (ns, non-significant, *P<0.05, ****P<0.0007; n = 3 independent biological replicates). (E) Left panel: WT and MKO cells were plated into complete media, then transferred to HBSS and pictures were taken at 2, 4, 8, and 12 h-post media change. Right panel: Temporal quantification of the number of LDs in WT and MKO cells at five time points. Data are presented as means ± SEM (ns, non-significant, ****P<0.0007; n = 3 independent biological replicates). (F) Temporal quantification of the percentage of cells with dispersed, intermediate, or clustered LDs after incubation of cells for the indicated times in either CM (left panel; pictures of cells appear in D) or HBSS (right panel; pictures of cells appear in E). Results are presented as mean ± SEM. n = 3 independent biological replicates). Scale bar = 5 μm. Source data are available online for this figure.
Figure 5
Figure 5. MTCH2 is critical for adipocyte differentiation.
(A) NIH3T3L1 cells were differentiated into adipocytes for 6 days in 4-well glass bottom plates. LDs were stained with Bodipy green and nuclei with Hoechst. The well overview is taken at ×10 magnification. One region (marked by a yellow box) was magnified. Right panel: measure of differentiation by quantification of the number of LDs. Results are presented as mean ± SEM (***P<0.0003; one-way ANOVA, n = 3 biological replicates). (B) mRNA level of WT and MTCH2 knockout (KO) cells at day 0 and day 6-post differentiation. Components of the adipogenic program Pparg, Cebpa, Cebpb, and Cebpd. Results are presented as mean ± SEM of one representative out of three independent experiments. Normalization was done by taking geometric mean of three housekeeping genes, Importin, Tubulin and AcTH. (C) Levels of NAD+, NADH+, NADP+, AMP, ATP (and AMP/ATP ratio) in undifferentiated WT and MTCH2 KO preadipocyte NIH3T3L1. Results are presented as mean ± SEM (**P<0.001, ***P<0.0003, ****P<0.0007, unpaired t test, n = 4 biological replicates). (D) Levels of NAD+, NADH+, NADP+, AMP, ATP in WT and MTCH2 KO preadipocyte at day 0 and day 6-post differentiation. Results are presented as mean ± SEM (ns, non-significant, *P<0.05, **P<0.001, ****P<0.0007, Two-way ANOVA with sidak’s multiple comparison test, n = 4 biological replicates). Source data are available online for this figure.
Figure 6
Figure 6. Schematic representation comparing the metabolic state of wild type and MTCH2 knockout cells.
Left panel: In wild type cells, MTCH2 might act as a mitochondrial mediator/sensor by sensing and connecting between metabolic intermediates/pathways and dynamic changes in mitochondria morphology/energy production by receiving and sending signals. Right panel: MTCH2 knockout cells, missing a pivotal mediator/sensor, can lead to a disconnection between the cellular energy demand and the cellular energy utilization (created with BioRender.com).
Figure EV1
Figure EV1. Global untargeted metabolomics analysis of WT, MKO, and MKO-R cells.
(A) MTCH2 mRNA expression checked by RT-PCR in all 6 clones of WT and MKO and WT cells. Results are presented as mean ± SEM (****P<0.0007, ordinary one-way ANOVA). N=Two independent experiments. (B) A representative immunoblot of MTCH2 protein level by for MTCH2 expression in all 6 clones of MKO and WT cells. (C) A heat map comparing the levels of the top 70 metabolites (out of 107 differential metabolites detected in global metabolomics, all 107 differential metabolites appear in Dataset EV1) in the WT, MKO, and MKO-R cell lines. Metabolite concentration values (Relative abundance) were log 1.5-transformed for statistics. The groups were compared by ANOVA. Values are scaled to Z-scores per row (metabolites); n=4 independent biological replicates. (D) Pathway enrichment analysis of 107 differential metabolites detected in global metabolomics. Enrichment was detected using a Hypergeometric Test using a Relative-betweenness Certrality topology against the Homo sapiens (KEGG) database, using MetaboAnalyst server (n=4 independent biological replicates). (E) Number of metabolites detected in significantly enriched pathways with an FDR cutoff<0.12 (n=4 independent biological replicates). Source data are available online for this figure.
Figure EV2
Figure EV2. An increase in amino acid/TCA cycle/lipid utilization in MKO cells.
(A) Average levels of a set of amino acids in all 3 cell lines at all four time points. (B) Left panel: Schematic representation of the TCA cycle. Right panels: Average levels of a set of TCA cycle intermediates in all 3 cell lines at all four time points. (C) Average levels of acylcarnitines in all 3 cell lines at all four time points. Results in all graphs in (AC) are presented as mean ± SEM (ns, non-significant, *P<0.05, **P<0.001, ***P<0.0003, ****P<0.0007; two-way ANOVA with Dunnett multiple comparison test; n=6 biological replicates). Source data are available online for this figure.
Figure EV3
Figure EV3. Increased mitochondrial oxidative function in MKO cells.
(A) Cell Respiratory Control Ratio of WT and MKO cells. Results are presented as mean ± SEM (Unpaired t test, *P<0.05. N=3 independent experiments with 6–8 technical replicates in each experiment). (B) Increased total mitochondrial NADH content in MKO cells. Mitochondrial NADH levels were calculated as described in the Methods. Results are presented as mean ± SEM (Unpaired t test, *P<0.05, N=3 independent experiments). Mitochondrial NADH content was calculated as the difference in NADH mean autofluorescence intensity (MFI). Maximal NADH autofluorescence was determined in response to KCN and minimal NADH autofluorescence was determined in response to FCCP as described in the Methods. (C) Increased mitochondrial membrane potential in MKO cells. Results are presented as means ± SEM (Unpaired t test, **P<0.001, N=3 independent experiments). (D) Mitochondrial ROS levels in WT and MKO cells. Levels of mitochondrial ROS (measured using mitoSOX) are presented. Results are presented as mean ± SEM (Unpaired t test, ns-nonsignificant, N=3 independent experiments). Source data are available online for this figure.
Figure EV4
Figure EV4. MKO cells show accelerated mitochondria elongation under nutrient depletion conditions.
(A, B) The levels of Free fatty acids (NEFA)(A) and Esterified fatty acids (B) in all 3 cell lines. Results are presented as mean ± SEM (ns, non-significant, *P<0.05, **P<0.001, ***P<0.0003, ****P<0.0007; one-way ANOVA, n = 4 independent biological replicates). (C) Quantification of LD average size in WT and MKO cells. The average LD size from different time points was combined and plotted as a single group for both WT and KO cells. Results are presented as mean ± SEM (**P<0.001; Unpaired t test, n=3 independent biological replicates). (D) mRNA levels of ACSL1 and SCD1in WT and MKO cells. Results are presented as mean ± SEM (*P<0.05, ***P<0.0003; Unpaired t test, N = 3 independent experiments). (E) Left panel: Western blot for ACSL1 and SCD1 proteins in lysates from WT and MKO cells 20 h-post media change. Right panels: Quantification of relative density of ACSL1 and SCD1 normalized to Actin (loading control). Results are presented as mean ± SEM (ns, non-significant, **P<0.001, Unpaired t test). N = 3 independent experiments (F). Analyses of mitochondria morphology. Left panel: WT and MKO cells were plated into complete media (CM), then media was refreshed (considered as time 0) and pictures were taken at 0, 12, 20, and 30 h-post media change. Mitochondria were labeled using Mito Tracker Deep red (MTDR). Scale bar=5 μm. Right panels: Quantification of mitochondria morphology of WT and MKO cells. Results are presented as mean ± SEM (ns, non-significant, *P<0.05, ****P<0.0007; Unpaired t-test, N=3 independent experiments). (G) Left panel: Analyses of mitochondria morphology in WT and MKO cells incubated in HBSS, and pictures were taken at 2, 4, 8 and 12-h post incubation and labeled as in (F). Scale bar = 5 μm. Right panels: Quantification of mitochondria morphology of WT and MKO cells. Results are presented as means ± SEM (ns, non-significant, **P<0.001, ***P<0.0003, ****P<0.0007; n = 3 Independent biological replicates). Source data are available online for this figure.
Figure EV5
Figure EV5. MTCH2 is critical for adipocyte differentiation.
(A) MTCH2 mRNA expression was checked by RT-PCR (left panel) and protein level were checked by Immunoblot (right panel) in 4 different MTCH2 knockout (KO) and WT clones. *, nonspecific band. Results are presented as mean ± SEM of one representative out of three independent experiments (****P<0.0007, ordinary one-way ANOVA). (B) Mitochondrial morphology in NIH3T3L1 Preadipocytes. MTCH2 knockout (KO) leads to mitochondrial fragmentation. Mitochondria were labeled using MitoTracker Deep red (MTDR). Scale bar = 5 μm. (C) RT-PCR of WT and MTCH2 knockout (KO) cells at day 0 and day 6-post differentiation. Components of the adipogenic effector genes were analyzed: adiponectin (AdipoQ), Adipsin, fatty-acid-binding protein 4 (Fabp4), fatty acid synthase (FASN), pyruvate dehydrogenase (Pdha1), stearyl-CoA desaturase (Scd1), 1-acyl-sn-glycerol-3-phosphate (Agpat), diacylglycerolacyltransferase (Dgat1), perilipin (Plin1), mitoguardin 2 (Miga2), and poly(ADP-ribose) polymerase1 (Parp1). Results are presented as mean ± SD of one representative out of three independent experiments. Normalization was done by taking geometric mean of three housekeeping genes, Importin, Tubulin and AcTH. Source data are available online for this figure.

References

    1. Abu Shelbayeh O, Arroum T, Morris S, Busch KB (2023) PGC-1α is a master regulator of mitochondrial lifecycle and ROS stress response. Antioxidants 12:1075 - PMC - PubMed
    1. Anderson KA, Madsen AS, Olsen CA, Hirschey MD (2017) Metabolic control by sirtuins and other enzymes that sense NAD+, NADH, or their ratio. Biochim Biophys Acta Bioenerg 1858:991–998 - PMC - PubMed
    1. Audano M, Pedretti S, Caruso D, Crestani M, De Fabiani E, Mitro N (2022) Regulatory mechanisms of the early phase of white adipocyte differentiation: an overview. Cell Mol Life Sci 79:139 - PMC - PubMed
    1. Bahat A, Goldman A, Zaltsman Y, Khan DH, Halperin C, Amzallag E, Krupalnik V, Mullokandov M, Silberman A, Erez A et al (2018) MTCH2-mediated mitochondrial fusion drives exit from naïve pluripotency in embryonic stem cells. Nat Commun 9:5132 - PMC - PubMed
    1. Barile M, Singh BK, Kristian T, Nakagawa T, Okabe K, Nawaz A, Nishida Y, Yaku K, Usui I, Tobe K (2020) NAD+ metabolism regulates preadipocyte differentiation by enhancing α-ketoglutarate-mediated histone H3K9 demethylation at the PPARγ promoter. Front Cell Dev Biol 24(8):586179 - PMC - PubMed

LinkOut - more resources