Comparative Study
. 2025 Jan;31(1):267-277.
doi: 10.1038/s41591-024-03355-2. Epub 2025 Jan 3.

Proteomic changes upon treatment with semaglutide in individuals with obesity

Affiliations
Comparative Study

Proteomic changes upon treatment with semaglutide in individuals with obesity

Lasse Maretty et al. Nat Med. 2025 Jan.

Abstract

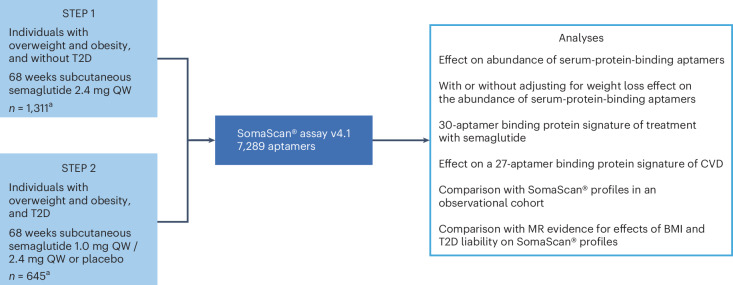
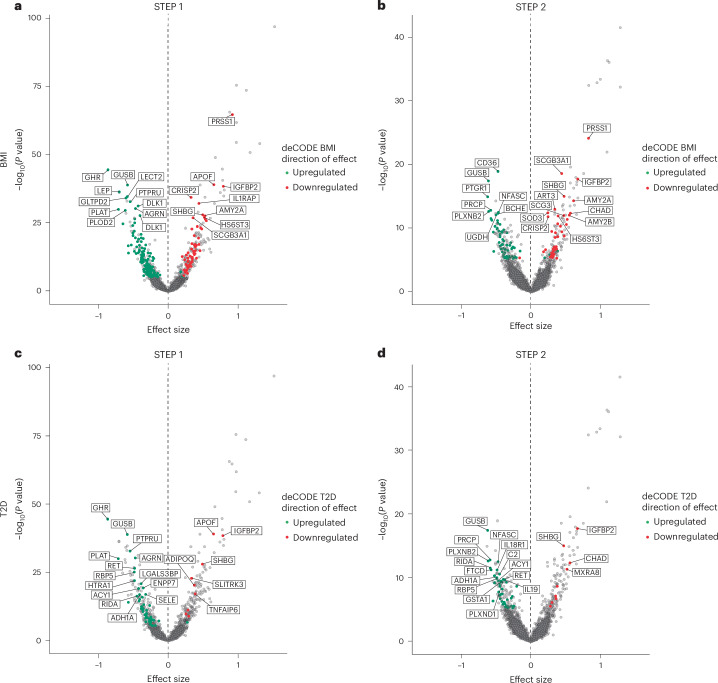
Obesity and type 2 diabetes are prevalent chronic diseases effectively managed by semaglutide. Here we studied the effects of semaglutide on the circulating proteome using baseline and end-of-treatment serum samples from two phase 3 trials in participants with overweight or obesity, with or without diabetes: STEP 1 (n = 1,311) and STEP 2 (n = 645). We identified evidence supporting broad effects of semaglutide, implicating processes related to body weight regulation, glycemic control, lipid metabolism and inflammatory pathways. Several proteins were regulated with semaglutide, after accounting for changes in body weight and HbA1c at end of trial, suggesting effects of semaglutide on the proteome beyond weight loss and glucose lowering. A comparison of semaglutide with real-world proteomic profiles revealed potential benefits on disease-specific proteomic signatures including the downregulation of specific proteins associated with cardiovascular disease risk, supporting its reported effects of lowering cardiovascular disease risk and potential drug repurposing opportunities. This study showcases the potential of proteomics data gathered from randomized trials for providing insights into disease mechanisms and drug repurposing opportunities. These data also highlight the unmet need for, and importance of, examining proteomic changes in response to weight loss pharmacotherapy in future trials.


Conflict of interest statement

Competing interests: L.S., K.S., M. Galanakis, M.T.I., J.S., A.S., L.B.K. and A.A.T. are employees and shareholders of Novo Nordisk. D.G., L.M. and M. Geybels were employees and shareholders of Novo Nordisk at the time of the analysis. M. Galanakis, M. Geybels and D.V. have received a grant from the Danish Innovation Fund (204000005B). J.Q.P. has received consulting fees from Boehringer Ingelheim and Novo Nordisk. L.Z. declares no competing interests.

Figures

Fig. 1
Fig. 1. Study design.
Of the 3,171 participants included in the STEP 1 and STEP 2 trials, 1,956 participants (STEP 1, n = 1,311; STEP 2, n = 645) consented to aptamer-based proteomic analyses using the SomaScan® assay v4.1. aParticipants included in the study who had an available biosample for proteomics profiling. The semaglutide 1.0 mg arm was excluded from most downstream analyses, except for the CVD risk analysis. MR, Mendelian randomization; QW, every week.
Fig. 2
Fig. 2. Effects of subcutaneous semaglutide versus effects of placebo on the circulating proteome.
a,b, Effect sizes on protein levels in STEP 1 (a) and STEP 2 (b). c, Comparison between effect sizes in STEP 1 and STEP 2. d,e, Effect sizes on proteins that remained significant in the regression model after adjusting for both baseline and change in body weight and HbA1c in STEP 1 (d) and STEP 2 (e). The dashed red line represents the FDR threshold. STEP 1: n = 1,133; STEP 2: n = 395. For ae, effect sizes and P values were computed using linear regression. P values were corrected for multiplicity using Holm–Bonferroni correction. AMY2A and AMY2B, alpha-amylase 2A and 2B; APOF, apolipoprotein F; BGN, biglycan; CD36, cluster of differentiation 36; CELA1 and CELA2A, chymotrypsin-like elastase 1 and 2A; CPA1, carboxypeptidase A1; CPB1, carboxypeptidase B1; CRISP2, cysteine-rich secretory protein 2; CTRB1 and CTRB2, chymotrypsinogen B1 and B2; EVA1C, eva-1 homolog C; GUSB, glucuronidase beta; HSPA1A, heat shock protein family A member 1A; KIRREL2, kirre-like nephrin family adhesion molecule 2; LECT2, leukocyte cell-derived chemotaxin-2; LEP, leptin; NPPB, natriuretic peptide B; PLAT, plasminogen activator, tissue type; PNLIP, pancreatic lipase; PNLIPRP1 and PNLIPRP2, pancreatic lipase-related protein 1 and 2; PRSS1, PRSS2 and PRSS3, trypsin 1, 2 and 3; PTGR1, prostaglandin reductase-1; REG1B and REG3A, regenerating family member 1 beta and 3 alpha; SCARA5, scavenger receptor class A member 5; SCGB3A1, secretoglobin family 3A member 1; SHBG, sex-hormone-binding globulin.
Fig. 3
Fig. 3. Relationship between number of comorbidities and predicted CVD risk in STEP 1 (a) and effect of semaglutide on predicted CVD risk in STEP 1 and STEP 2 (b).
The CVD2 test predicts the risk of a new cardiovascular event within 4 years for patients who have already experienced a cardiovascular event. a, log(CVD2 score) versus number of comorbidities: Kruskal–Wallis rank-sum test P = 1.57e−05. The center line and lower and upper bounds of the boxes represent the median and 1st quartile and 3rd quartile, respectively. The bottom and top whiskers indicate the minimum and maximum values, respectively, at 1.5× the inter-quartile range from the box bounds. STEP 1: n = 1,133; STEP 2: n = 395. b, Change from baseline in log(CVD2 score) across treatment groups: Wilcoxon rank-sum test P = 0.000416 (STEP 1, semaglutide 2.4 mg versus placebo), P = 3.5e−05 (STEP 2, semaglutide 1.0 mg versus placebo), P = 0.0028 (STEP 2, semaglutide 2.4 mg versus placebo) and P = 0.252 (STEP 2, semaglutide 2.4 mg versus semaglutide 1.0 mg). Data are presented as mean values with error bars indicating 95% CIs. Two-sided test was used. P values for pairwise arm comparisons in STEP 2 were corrected for multiple testing using the Holm–Bonferroni method. STEP 1: n = 1,133; STEP 2: n = 595. MACE, major adverse cardiovascular event.
Fig. 4
Fig. 4. Effect of semaglutide in STEP 1 (a) and STEP 2 (b) on a selected set of proteomic signatures.
a,b, Protein set analysis results for a selected set of proteomic signatures affected by semaglutide treatment (according to SomaScan®) in STEP 1 (a) and STEP 2 (b). STEP 1: n = 1,133; STEP 2: n = 395. Enrichment P values were computed using CameraPR. The protein sets (signatures) were created using data from a study by deCODE that estimated the associations between protein levels and clinical phenotypes in an observational cohort of 35,559 Icelanders. For each phenotype, the significantly associated proteins were divided into those that were downregulated with the trait and those that were upregulated. Circle sizes visually indicate the number of proteins in a set (log2 scale). The black diamonds within the colored circles indicate sets that are significantly affected by treatment (FDR-adjusted P value (q value) < 0.05). For example, proteins downregulated with neuropathic pain in the deCODE study were upregulated by semaglutide, and proteins upregulated with neuropathic pain in the deCODE study were downregulated by semaglutide. Results for the full list of protein sets are available in Supplementary Tables 11 and 12 for STEP 1 and STEP 2, respectively.
Fig. 5
Fig. 5. Comparison of the effects of semaglutide on the circulating proteome with effects associated with genetic liability to higher BMI and T2D.
a,b, Proteins that were upregulated or downregulated by higher BMI in STEP 1 (a) and STEP 2 (b). c,d, Proteins that were upregulated or downregulated by T2D in STEP 1 (c) and STEP 2 (d). Negative values on the x-axis indicate proteins that have been downregulated by semaglutide, and positive values indicate proteins that have been upregulated by semaglutide. As such, the figure shows that semaglutide consistently reverses the protein expression patterns driven by higher BMI or T2D. STEP 1: n = 1,133; STEP 2: n = 395. Effect sizes and P values were computed using linear regression. P values were corrected for multiplicity using Holm–Bonferroni correction. ACY1, aminoacylase-1; ADH1A, alcohol dehydrogenase 1A; ADIPOQ, adiponectin; AGRN, agrin; ART3, ADP-ribosyltransferase 3; BCHE, butyrylcholinesterase; C2, complement component 2; CHAD, chondroadherin; DLK1, protein delta homolog 1; ENPP7, ectonucleotide pyrophosphatase/phosphodiesterase 7; FTCD, formimidoyltransferase cyclodeaminase; GLTPD2, glycolipid transfer protein domain containing 2; GSTA1, glutathione S-transferase A1; HS6ST3, heparan sulfate 6-O-sulfotransferase 3; HTRA1, high-temperature requirement A-1; IL1RAP, interleukin 1 receptor accessory protein; IL18RA, interleukin 18 receptor 1; IL19, interleukin 19; LGALS3BP, galectin 3 binding protein; MXRA8, matrix remodeling associated 8; NFASC, neurofascin; PLOD2, procollagen-lysine,2-oxoglutarate 5-dioxygenase 2; PLXNB2 and PLXND1; PRCP, prolylcarboxypeptidase; PTPRU, protein tyrosine phosphatase receptor type U; RBP5, retinol binding protein 5; RET, rearranged during transfection; RIDA, reactive intermediate imine deaminase A; SCG3, secretogranin III; SELE, selectin E; SLITRK3, slit guidance ligand and neurotrophic tyrosine receptor kinase-like family member 3; SOD3, superoxide dismutase 3; TNFAIP6, tumor necrosis alpha induced protein 6; UGDH, uridine phosphorylase-glucose 6-dehydrogenase.
Extended Data Fig. 1
Extended Data Fig. 1. Effects of subcutaneous semaglutide versus placebo on the circulating proteome; relative abundance of specific proteins at baseline and week 68 in STEP 1 (a) and STEP 2 (b).
Data are presented as mean values with error bars indicating 95% confidence intervals. STEP 1: n = 1,133; STEP 2: n = 395. CRP, C-reactive protein; LEP, leptin, NCAM1, neural cell adhesion molecule 1.
Extended Data Fig. 2
Extended Data Fig. 2. Pathways implicated by proteins affected by semaglutide treatment in STEP 1 (a) and STEP 2 (b).
The figure shows the effect of semaglutide treatment (according to SomaScan®) on hallmark gene sets. Circle sizes visually indicate the number of proteins in a set (log2-scale). Black diamonds within the coloured circles indicate sets that are significantly affected by treatment (false discovery rate-adjusted P value [q value] < 0.05). Enrichment P values were computed using CameraPR. Results for the full list of gene sets are available in Supplementary Tables 9 and 10 for STEP 1 and STEP 2, respectively. KRAS, Kirsten rat sarcoma virus; MTORC1, mammalian target of rapamycin complex 1; MYC, myelocytomatosis oncogene.
Extended Data Fig. 3
Extended Data Fig. 3. Proteins increased by semaglutide treatment are implicated in the exocrine pancreas.
Effect size was normalized using the means and standard deviations at baseline to compare results across proteins, with positive and negative values indicating that semaglutide increased and decreased protein levels; −log10(P values) indicate the level of significance of the effect size (approximately 500 proteins [approximately 8–10% of the measured proteome] were significant). The red dashed line shows the Bonferroni correction limit, and the blue dashed line shows the false discovery rate. Effect sizes and P values were computed using linear regression. AMY2A/2B, alpha-amylase 2 A/2B; CLPS, caseinolytic protease subunit S; CPB1, carboxypeptidase B1; EOT, end of treatment; PNLIPRP1/2, pancreatic lipase-related protein 1/2; PNLIP, pancreatic lipase; PRSS1/2/3, trypsin 1/2/3.
Extended Data Fig. 4
Extended Data Fig. 4. Thirty-aptamer signature of semaglutide treatment in STEP 1 (a) and STEP 2 (b).
AGRN, agrin; APOF, apolipoprotein F; ATF6, activating transcription factor 6; CHTF8, chromosome transmission fidelity protein 8 homolog; CPA1, carboxypeptidase A1; CPB1, carboxypeptidase B1; CRISP2, cysteine-rich secretory protein 2; CSF1R, colony stimulating factor 1 receptor; CTRB1/2, chymotrypsinogen B1/2; DLK1, protein delta homolog 1; GHR, growth hormone receptor; GLTPD2, glycolipid transfer protein domain containing 2; GUSB, glucuronidase beta; IGFBP2, insulin-like growth factor-binding protein 2; KIRREL2, kirre-like nephrin family adhesion molecule 2; LECT2, leukocyte cell-derived chemotaxin-2; LEP, leptin; PLAT, plasminogen activator, tissue type; PNLIP, pancreatic lipase; PNLIPRP1, pancreatic lipase-related protein 1; PRSS1/2/3, trypsin 1/2/3; REG1B/3A, regenerating family member 1 beta/3 alpha; SCARA5, scavenger receptor class A member 5.

References

    1. World Obesity Federation. World Obesity Atlas 2023 (Global Obesity Observatory, 2023).
    1. Murray, C. J. L. et al. Global burden of 87 risk factors in 204 countries and territories, 1990–2019: a systematic analysis for the Global Burden of Disease Study 2019. Lancet396, 1223–1249 (2020). - PMC - PubMed
    1. Bhaskaran, K., dos-Santos-Silva, I., Leon, D. A., Douglas, I. J. & Smeeth, L. Association of BMI with overall and cause-specific mortality: a population-based cohort study of 3.6 million adults in the UK. Lancet Diabetes Endocrinol.6, 944–953 (2018). - PMC - PubMed
    1. Kivimäki, M. et al. Body-mass index and risk of obesity-related complex multimorbidity: an observational multicohort study. Lancet Diabetes Endocrinol.10, 253–263 (2022). - PMC - PubMed
    1. Tahrani, A. A. & Morton, J. Benefits of weight loss of 10% or more in patients with overweight or obesity: a review. Obesity30, 802–840 (2022). - PubMed

Publication types

MeSH terms