. 2025 Feb;31(2):466-477.
doi: 10.1038/s41591-024-03362-3. Epub 2025 Jan 3.

Clinicogenomic landscape of pancreatic adenocarcinoma identifies KRAS mutant dosage as prognostic of overall survival

Affiliations

Clinicogenomic landscape of pancreatic adenocarcinoma identifies KRAS mutant dosage as prognostic of overall survival

Anna M Varghese et al. Nat Med. 2025 Feb.

Abstract

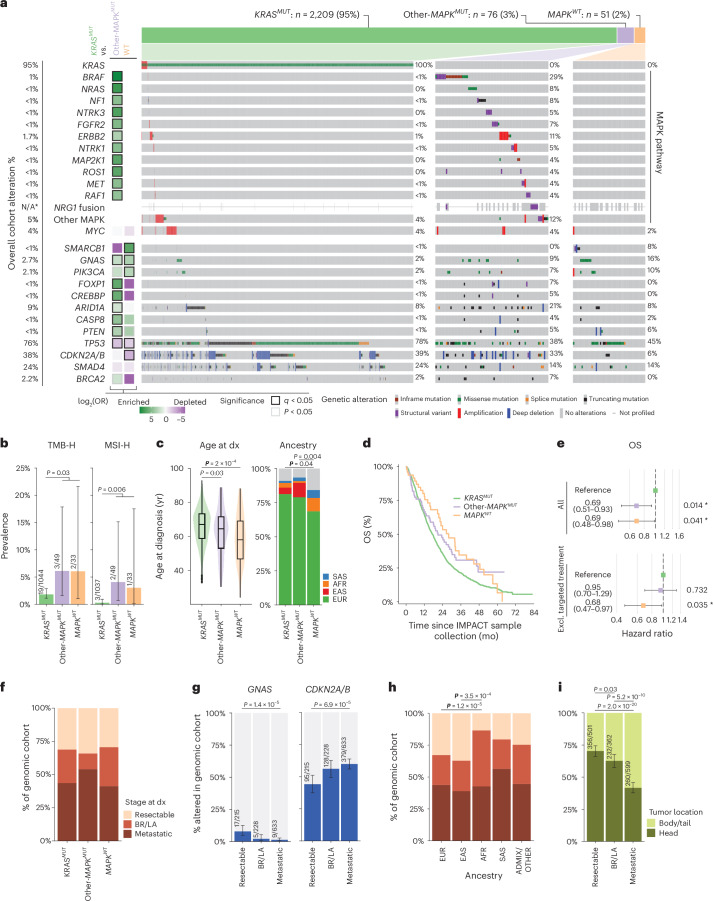
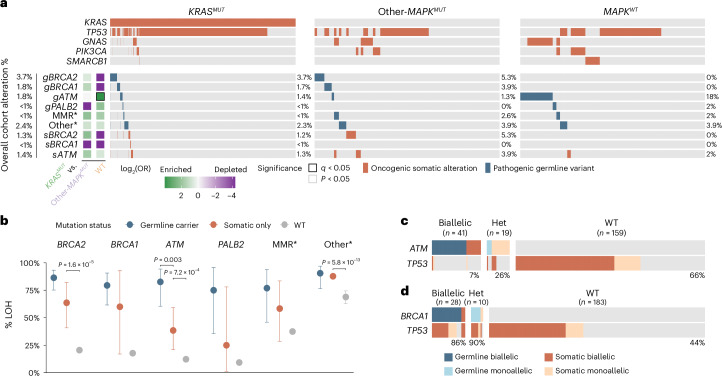
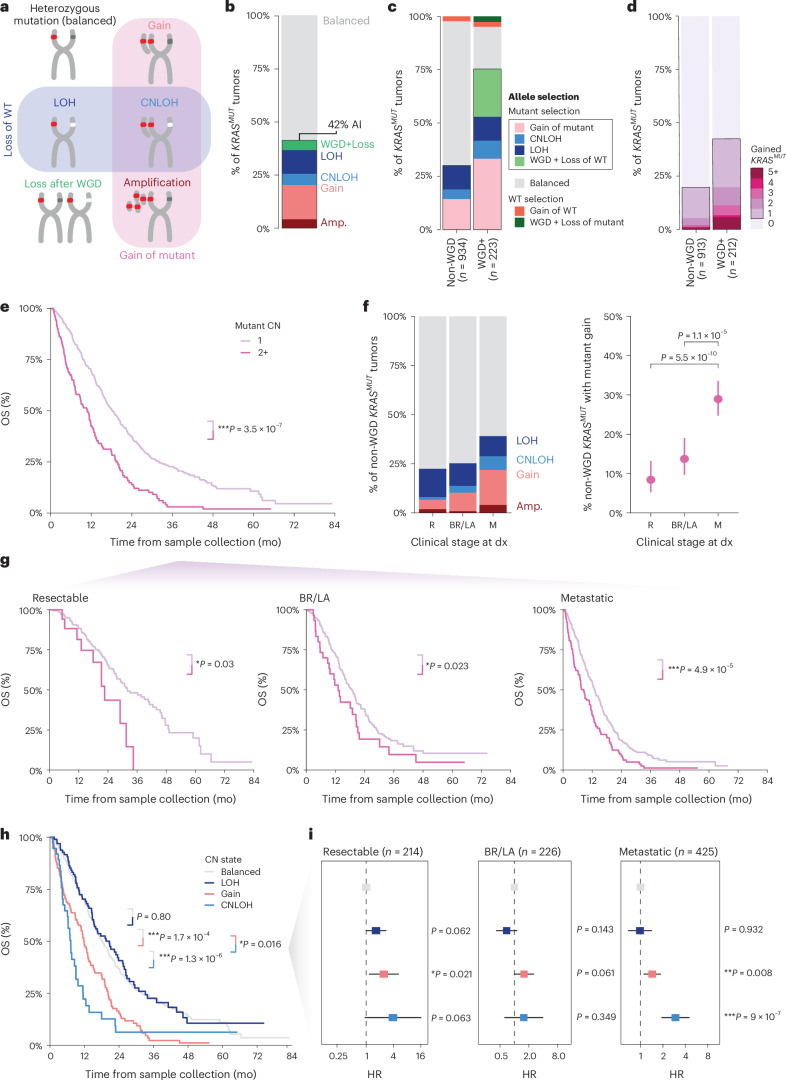
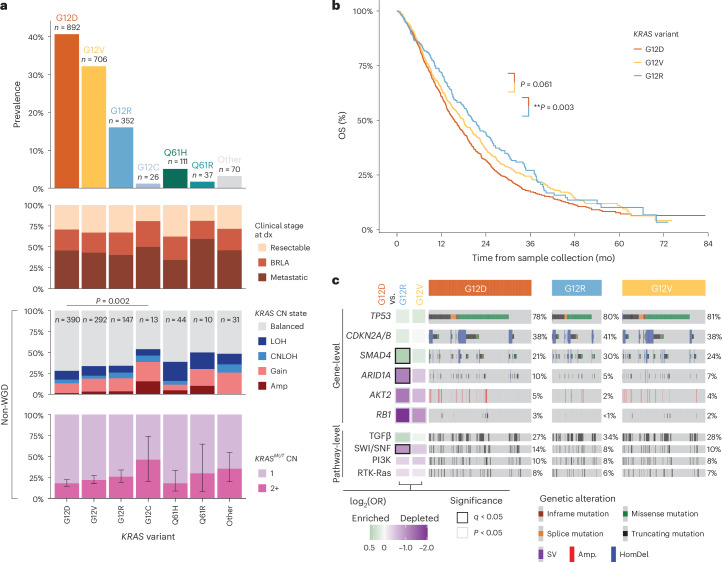
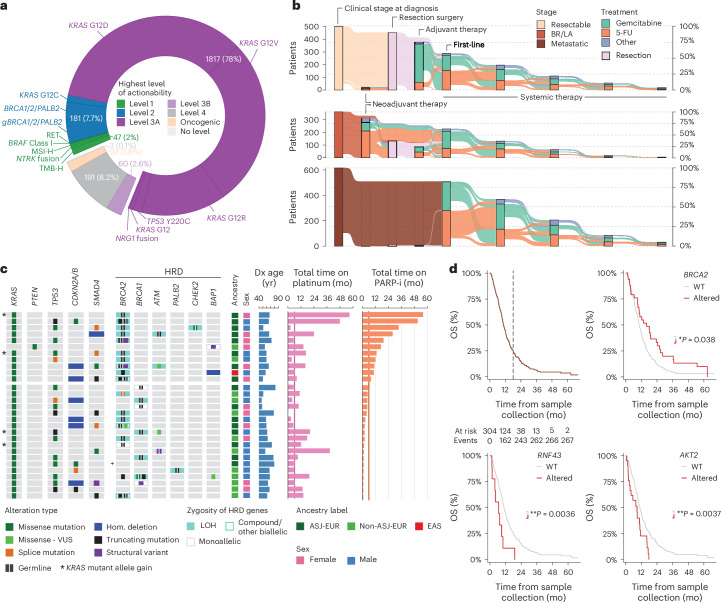
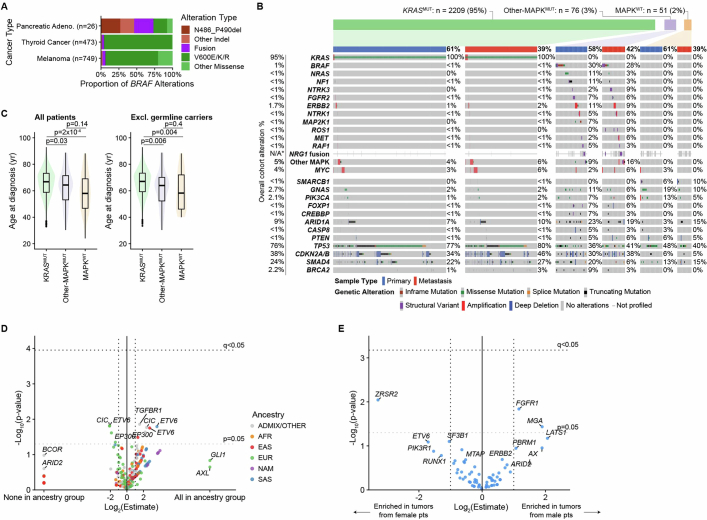
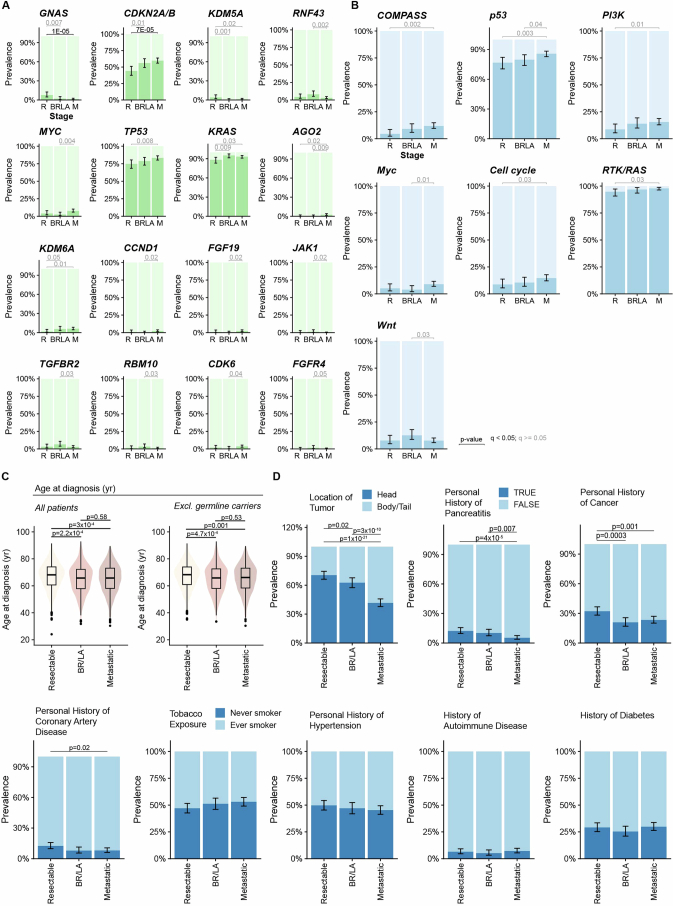
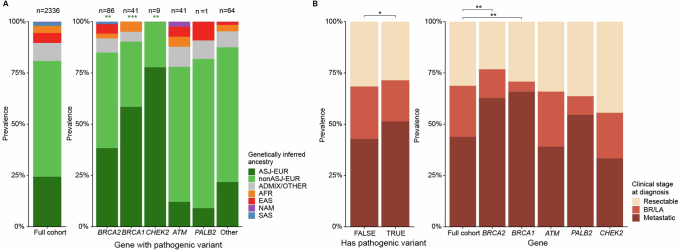
Nearly all pancreatic adenocarcinomas (PDAC) are genomically characterized by KRAS exon 2 mutations. Most patients with PDAC present with advanced disease and are treated with cytotoxic therapy. Genomic biomarkers prognostic of disease outcomes have been challenging to identify. Herein leveraging a cohort of 2,336 patients spanning all disease stages, we characterize the genomic and clinical correlates of outcomes in PDAC. We show that a genomic subtype of KRAS wild-type tumors is associated with early disease onset, distinct somatic and germline features, and significantly better overall survival. Allelic imbalances at the KRAS locus are widespread. KRAS mutant allele dosage gains, observed in one in five (20%) KRAS-mutated diploid tumors, are correlated with advanced disease and demonstrate prognostic potential across disease stages. With the rapidly expanding landscape of KRAS targeting, our findings have potential implications for clinical practice and for understanding de novo and acquired resistance to RAS therapeutics.


Conflict of interest statement

Competing interests: M.A.P. declares stock ownership in Amgen. A.M.V. declares consulting activity from AstraZeneca (spouse), Eli Lilly (spouse) and Paige AI (spouse), and intellectual property rights (SOPHiA Genetics) (spouse). B.N. is a current employee of Eli Lilly and Company. D. Mandelker declares consulting fees from AstraZeneca. F.B. receives research support from BMS. D.P.K. receives funding from the Thompson Family Foundation and Applebaum Foundation and is a consultant at Merck, BMS, BeiGene, Lilly, Abbvie, Incyte, Janssen, Listen and TG Therapeutics. A.R.B. declares stock ownership in Johnson & Johnson and intellectual property rights in SOPHiA Genetics. W.P. receives research funding from Merck, Astellas, Miracogen, Amgen and Revolution Medicines, is a consultancy/advisory board member for Astellas, EXACT Therapeutics, Innovent Biologics and Regeneron and has received honoraria for CME: American Physician Institute, Integrity. M.F.B. declares consulting activity from AstraZeneca, Eli Lilly and Paige AI and intellectual property rights (SOPHiA Genetics). E.M.O. receives research funding from Agenus, Amgen, Genentech/Roche, BioNTech, AstraZeneca, Arcus, Elicio, Parker Institute, NIH/NCI and Digestive Care, consulting/DSMB role at Arcus, Ability Pharma, Alligator, Agenus, BioNTech, Ipsen, Merck, Moma Therapeutics, Novartis, Syros, Leap Therapeutics, Astellas, BMS, Fibrogen, Revolution Medicine, Merus, Moma Therapeutics and Tango; Agios (spouse), Genentech-Roche (spouse), Eisai (spouse) Servier (spouse). The remaining authors declare no competing interests.

Figures

Fig. 1
Fig. 1. Somatic alteration landscape in PDAC.
a, Oncoprint of somatic oncogenic alterations in selected genes (Methods) across the following three genomic groups: KRASMUT, other-MAPKMUT and MAPKWT. Tile plot on the left indicates gene-level alteration enrichment in other-MAPKMUT and MAPKWT subtypes compared to KRASMUT using two-sided Fisher exact test. An asterisk indicates that NRG1 was not included in the enrichment analysis as it was profiled only in a subset of samples (Methods). Other MAPK pathway genes include FGFR1, ERBB3, FGFR4, EGFR, RASA1, CBL, MAPK1, ALK, MAP2K2, ERRFI1, FLT3, JAK2, KIT, PDGFRA, RAC1, RET, RRAS2, SOS1 and SPRED1. b, TMB-H and MSI-H prevalence by genomic subtype among tumor samples with ≥30% purity (n = 1,126). c, Age at diagnosis by genomic subtype with statistical comparison by two-sided Wilcoxon rank sum test (n = 2,336). Boxes represent the 25th, 50th (median) and 75th percentiles. Whiskers represent the minimum and maximum values, no further than 1.5× the interquartile range from the respective quartiles, with points beyond this range plotted individually. d, Kaplan–Meier curves showing OS for three genomic subtypes (Methods). e, Forest plot of multivariable Cox proportional hazards model of OS in overall cohort (top, corresponding to d; n = 2,270) and among patients who did not receive targeted therapies (bottom; n = 2,187). Models were stratified by stage at diagnosis and adjusted for sex, age, ancestry, disease status, resection and interval between diagnosis and sample collection (full model shown in Extended Data Table 1). f, Distribution of stage at diagnosis by genomic subtypes (n = 2,336). g, Prevalence of oncogenic alterations in GNAS and CDKN2A/CDKN2B by stage at diagnosis among tumor samples with purity >30% (n = 1076). h, Genetic ancestry by stage at diagnosis (n = 2,336). i, Tumor location (body/tail versus head) by stage (n = 1,462). Statistical significance is displayed as nominal P value for significant results after multiple test correction by FDR by Wilcoxon rank sum test for c, two-sided chi-squared test for h and two-sided Fisher’s exact test for b, g and i. Error bars represent 95th percentile binomial CI around the mean for b, g and i, and 95th percentile confidence intervals of the HR estimate (colored squares) for e. mo, month.
Fig. 2
Fig. 2. Germline alteration landscape in PDAC.
a, Oncoprint of pathogenic germline variants and somatic oncogenic alterations by genomic subtype. Displayed sBRCA2, sBRCA1 and sATM alterations are exclusively in sporadic tumors without a pathogenic germline variant in these genes. An asterisk indicates that MMR includes MSH2, MSH6, MLH1 and PMS2. ‘Other’ includes all other pathogenic variants in high- and moderate-penetrance genes—BRIP1, CDKN2A, CHEK2, FLCN, HOXB13, MITF, NBN, NF1, RAD51D, SDHA, SMARCA4, STK11, TP53 and TSC1. Tiles at left show gene-level enrichment in other-MAPKMUT and MAPKWT subtypes compared to KRASMUT by two-sided Fisher’s exact test. b, Rates of loss of heterozygosity (Methods) at BRCA2, BRCA1, ATM, PALB2, MMR and other loci (as in a) in n = 1,946 patients with germline pathogenic variants, somatic mutations in sporadic cancers and patients WT for any alteration in corresponding genes (comparisons by two-sided Fisher's exact test). Error bars represent 95th percentile binomial confidence intervals around the mean. c, Pattern of germline and somatic ATM and TP53 alterations, with monoallelic or biallelic zygosity status indicated. d, Pattern of germline and somatic BRCA1 and TP53 alterations, as in c.
Fig. 3
Fig. 3. KRAS mutant allele dosage gains and their prognostic implications.
a, Schematic of copy number states as related to mutant copy gain and retention of the WT allele in cases of allelic imbalance. The ‘Loss after WGD’ state indicates any copy number losses of the minor allele following WGD but excludes complete losses of the minor allele which are considered as CNLOH (Methods). b, Overall prevalence of copy number states in KRASMUT tumors. c, Prevalence of copy number state with allele selection by WGD status. d, Estimated number of gained mutant KRAS copies by WGD status. Tumors in which the WT allele was gained, or the mutant allele was lost are not shown here (n = 32, ‘WT selection’ in c). e, Kaplan–Meier curves of OS stratified by the number of mutant KRAS copies in diploid (non-WGD) KRASMUT tumors excluding tumors with gain of WT allele (n = 865; Extended Data Table 2). f, Prevalence of KRAS copy number states (left) and mutant copy gain (two or more mutant copies; right) by clinical stage at diagnosis (n = 874). Statistical comparisons show pairwise two-sided Fisher's exact tests. g, Kaplan–Meier curves of OS stratified by the number of mutant KRAS copies as in e, within each clinical stage at diagnosis (Extended Data Table 2). h, Kaplan–Meier curves of OS stratified by copy number state in diploid (non-WGD) KRASMUT tumors excluding tumors with gain of WT allele (n = 865; Extended Data Table 3). i, Forest plots of multivariable Cox proportional hazards model of OS by KRAS copy number state as in h, within each clinical stage at diagnosis (n = 865; Extended Data Table 3). Error bars represent 95th percentile binomial CI in f, and 95th percentile CI of the HR in i. Displayed P values in e, gi are two-sided nominal P values from multivariable Cox proportional hazards models that include age, sex, ancestry and time from diagnosis to sample collection as covariates. Models for e and h are stratified by clinical stage at diagnosis (Extended Data Tables 3 and 4). R, resectable; M, metastatic.
Fig. 4
Fig. 4. Differential genomic and prognostic features of KRAS variants.
a, Top, prevalence of the most common KRAS variants among all KRASMUT tumors. Bottom, disease stage composition, distributions of allelic imbalances and KRASMUT allele dosage gains across patients with different KRAS variants. Allelic imbalances and dosage gains are shown only for non-WGD tumors as indicated. Displayed nominal P value denotes statistical comparison of distribution of gene-level copy number state by two-sided chi-squared test. Tumors with multiple driver KRAS mutations are not shown here (n = 14; Extended Data Fig. 4a,b). Error bars for KRASMUT CN represent 95th percentile binomial CIs around the mean. b, Kaplan–Meier curve of OS among KRAS G12D, G12V and G12R variants. Displayed P values are nominal two-sided P values from a multivariable Cox proportional hazards model stratified by stage at diagnosis and accounting for KRAS mutant allele copy number, sex, age, ancestry, disease status and interval from diagnosis to sample collection (Extended Data Table 4). c, Oncoprint showing the prevalence of co-occurring TP53, CDKN2A/CDKN2B, SMAD4, ARID1A, AKT2, and RB1 mutations and TGFβ, SWI/SNF, PI3K and RTK–Ras signaling pathway alterations among KRAS G12D, G12R and G12V tumors. Tiles on the left indicate pairwise enrichment testing of co-occurring alterations between KRAS G12D versus G12R and G12V mutant tumors by two-sided Fisher's exact test.
Fig. 5
Fig. 5. Clinically actionable alterations and treatment landscape.
a, Highest OncoKB level of evidence by patient, with actionable (levels 1, 2 and 3A) alterations labeled. b, Alluvial diagram of treatment sequence for all 1,480 patients with treatment annotation by clinical stage at diagnosis showing prevalence of neoadjuvant therapy, resection surgery, adjuvant therapy and up to 5 rounds of systemic therapy. Different lines of treatment are shown on the x axis. c, Clinicogenomic characterization of n = 29 patients who were metastatic at presentation and received PARP-inhibitor therapy as part of systemic treatment. Cumulative times on PARP-inhibitor therapy and platinum therapy are shown as bar charts, along with demographic information (age at diagnosis, sex and genetic ancestry), germline and somatic alterations in HRD genes with associated zygosity, and somatic alterations in other commonly altered genes or genes of interest. The patient marked with a plus (+) received PARP-inhibitor therapy to target a germline RAD50 mutation (not shown). d, OS for n = 304 patients who were metastatic at presentation and received either 5-FU or gemcitabine-based first-line treatments (top left). Top-right, bottom-left and bottom-right, Kaplan–Meier curves of OS by alteration status of indicated genes. P values are nominal two-sided P values from a multivariable Cox model that accounts for sex, age, ancestry and interval from diagnosis to sample collection for each gene (Methods; Extended Data Table 5).
Extended Data Fig. 1
Extended Data Fig. 1. Somatic alteration landscape in PDAC: additional insights.
a, Prevalence of BRAF alteration types in PDAC, melanoma and thyroid cancer. b, Oncoprint of somatic oncogenic alterations with tumor samples grouped by genomic subtype (as in Fig. 1a) and by primary or metastasis sample type. c, Age at diagnosis across genomic groups including all patients (left, n = 2,336) and excluding patients with pathogenic germline variants (right, n = 2,006). Nominal P values indicate statistical comparison by two-sided Wilcoxon rank sum test. Boxes represent the 25th, 50th (median) and 75th percentiles. Whiskers represent the minimum and maximum values, no further than 1.5× the interquartile range (IQR) from the respective upper and lower quartiles, with points beyond this range plotted individually. d, Gene-level alteration enrichment by genetic ancestry (n = 75 genes with sufficient sample size). e, Gene-level alteration enrichment by sex (n = 75 genes with sufficient sample size). Enrichment was calculated using a two-sided Fisher exact test with P values adjusted for multiple testing by FDR for assessment of significance for d and e.
Extended Data Fig. 2
Extended Data Fig. 2. Stage differences in pathway and gene alteration patterns, age and additional clinical features.
a,b, Pathway- (a) and gene-level alteration (b) prevalence by clinical stage at diagnosis. Analysis limited to high-purity tumor samples (n = 1,076) and genes or pathways altered in at least 3 tumors in at least one stage. c, Age at diagnosis across the clinical stages at diagnosis including all patients (left, n = 2,336) and excluding patients with pathogenic germline variants (right, n = 2,006). Boxes represent the 25th, 50th (median) and 75th percentiles. Whiskers represent the minimum and maximum values, no further than 1.5× the interquartile range (IQR) from the respective upper and lower quartiles, with points beyond this range plotted individually. Groups were compared using two-sided Wilcoxon rank sum tests; nominal P value displayed. d, Tumor location, tobacco exposure and personal history of pancreatitis, hypertension, cancer, autoimmune disease, coronary artery disease and diabetes by clinical stage at diagnosis (n = 1,480). Error bars represent 95th percentile binomial CIs around the mean for a, b and d. Enrichment was calculated using a two-sided Fisher exact test for a, b and d with nominal P values displayed. P values were adjusted for multiple testing by FDR for assessment of significance for a and b (colored by Padj < 0.05).
Extended Data Fig. 3
Extended Data Fig. 3. Pathogenic germline variant prevalence by ancestry and stage.
a, Distribution of genetically inferred ancestry across the overall cohort (left) and by germline mutated genes. Asterisks denote enrichment of ASJ-EUR ancestry by Fisher’s exact test (q < 0.05). b, Distribution of clinical stage at diagnosis across the overall cohort (left) and by germline mutated genes. Asterisks denote chi-squared test (q < 0.05).
Extended Data Fig. 4
Extended Data Fig. 4. Differential genomic and prognostic features of KRAS variants: additional insights.
a, Bubble chart of co-occurring KRAS mutations. Number and bubble size indicate the prevalence of a given combination, and number in parentheses is the prevalence of the mutation in the overall cohort. b, Purity-adjusted variant allele frequency (VAF) of KRAS mutations by tumor, ordered by difference in VAF. Please note the 14 tumors shown here are excluded from Fig. 4. c, Prevalence of sex, genetic ancestry, age at diagnosis and smoking status by KRAS variant. Dotted line for age shows overall median. P value denotes two-sided Fisher’s exact test. Boxes for age represent the 25th, 50th (median) and 75th percentiles. Whiskers represent the minimum and maximum values, no further than 1.5× the interquartile range (IQR) from the respective upper and lower quartiles, with points beyond this range plotted individually. d, Prevalence of WGD by KRAS variant (n = 1,150); prevalence of KRAS allelic imbalance and KRAS allele selection state by KRAS variant among diploid tumors (n = 927). e,f, Progression-free survival (PFS) differences between first-line standard-of-care treatments across the different KRAS variant groups. e, Kaplan–Meier curves for PFS differences between FOLFIRINOX (5-FU) and gemcitabine for KRAS G12D, G12V and G12R. P values represent statistical comparison of univariate Kaplan–Meier curves by log-rank test. f, Multivariable Cox proportional hazards model for e. P values are nominal two-sided P values from the Cox regression model. Error bars represent 95th percentile binomial CIs around the mean for c and d.
Extended Data Fig. 5
Extended Data Fig. 5. OncoKB clinical actionability across the three genomic subtypes of PDAC.
Prevalence of actionable alterations by OncoKB levels of actionability across KRASMUT, other-MAPKMUT and MAPKWT tumors.

References

    1. Siegel, R. L., Giaquinto, A. N. & Jemal, A. Cancer statistics, 2024. CA Cancer J. Clin.74, 12–49 (2024). - PubMed
    1. Conroy, T. et al. FOLFIRINOX versus gemcitabine for metastatic pancreatic cancer. N. Engl. J. Med.364, 1817–1825 (2011). - PubMed
    1. Von Hoff, D. D. et al. Increased survival in pancreatic cancer with nab-paclitaxel plus gemcitabine. N. Engl. J. Med.369, 1691–1703 (2013). - PMC - PubMed
    1. Wainberg, Z. A. et al. NAPOLI-3: a randomized, open-label phase 3 study of liposomal irinotecan + 5-fluorouracil/leucovorin + oxaliplatin (NALIRIFOX) versus nab-paclitaxel + gemcitabine in treatment-naive patients with metastatic pancreatic ductal adenocarcinoma (mPDAC). J. Clin. Oncol.41, LBA661–LBA661 (2023). - PMC - PubMed
    1. Park, W., Chawla, A. & O’Reilly, E. M. Pancreatic cancer: a review. JAMA326, 851 (2021). - PMC - PubMed

Substances