Clinical Trial
. 2025 Mar;31(3):881-893.
doi: 10.1038/s41591-024-03418-4. Epub 2025 Jan 3.

Personalized, autologous neoantigen-specific T cell therapy in metastatic melanoma: a phase 1 trial

Affiliations
Clinical Trial

Personalized, autologous neoantigen-specific T cell therapy in metastatic melanoma: a phase 1 trial

Jessica S W Borgers et al. Nat Med. 2025 Mar.

Erratum in

  • Publisher Correction: Personalized, autologous neoantigen-specific T cell therapy in metastatic melanoma: a phase 1 trial.
    Borgers JSW, Lenkala D, Kohler V, Jackson EK, Linssen MD, Hymson S, McCarthy B, O'Reilly Cosgrove E, Balogh KN, Esaulova E, Starr K, Ware Y, Klobuch S, Sciuto T, Chen X, Mahimkar G, Sheen JHF, Ramesh S, Wilgenhof S, van Thienen JV, Scheiner KC, Jedema I, Rooney M, Dong JZ, Srouji JR, Juneja VR, Arieta CM, Nuijen B, Gottstein C, Finney OC, Manson K, Nijenhuis CM, Gaynor RB, DeMario M, Haanen JB, van Buuren MM. Borgers JSW, et al. Nat Med. 2025 Sep;31(9):3206. doi: 10.1038/s41591-025-03896-0. Nat Med. 2025. PMID: 40760355 Free PMC article. No abstract available.

Abstract

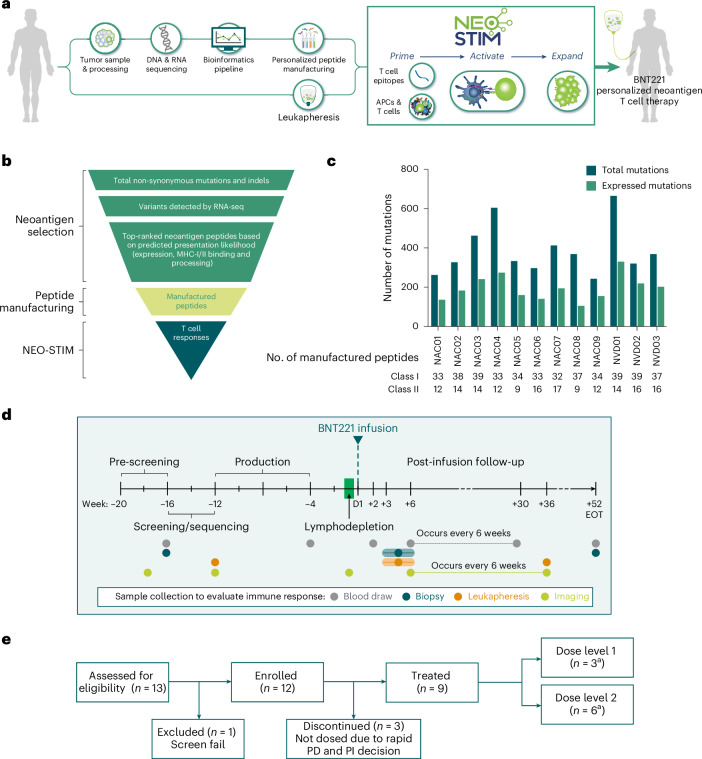
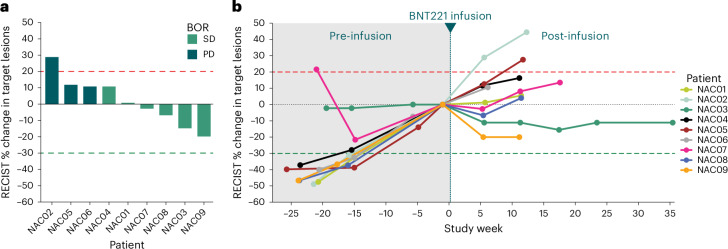
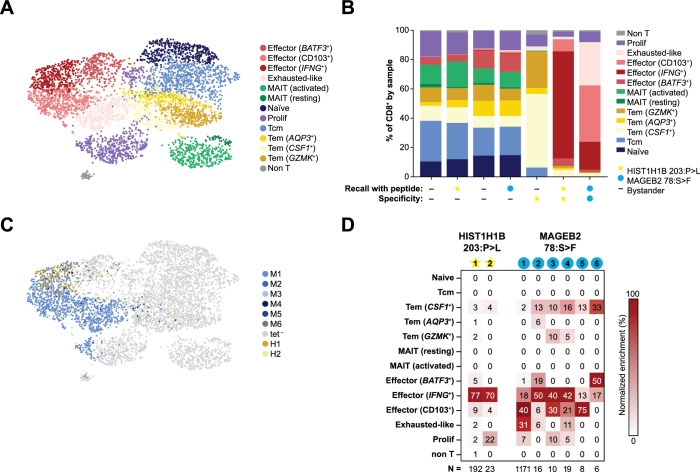
New treatment approaches are warranted for patients with advanced melanoma refractory to immune checkpoint blockade (ICB) or BRAF-targeted therapy. We designed BNT221, a personalized, neoantigen-specific autologous T cell product derived from peripheral blood, and tested this in a 3 + 3 dose-finding study with two dose levels (DLs) in patients with locally advanced or metastatic melanoma, disease progression after ICB, measurable disease (Response Evaluation Criteria in Solid Tumors version 1.1) and, where appropriate, BRAF-targeted therapy. Primary and secondary objectives were evaluation of safety, highest tolerated dose and anti-tumor activity. We report here the non-pre-specified, final results of the completed monotherapy arm consisting of nine patients: three at DL1 (1 × 10⁸-1 × 10⁹ cells) and six at DL2 (2 × 10⁹-1 × 10¹⁰ cells). Drug products (DPs) were generated for all enrolled patients. BNT221 was well tolerated across both DLs, with no dose-limiting toxicities of grade 3 or higher attributed to the T cell product observed. Specifically, no cytokine release, immune effector cell-associated neurotoxicity or macrophage activation syndromes were reported. A dose of 5.0 × 10⁸-1.0 × 10¹⁰ cells was identified for further study conduct. Six patients showed stable disease as best overall response, and tumor reductions (≤20%) were reported for four of these patients. In exploratory analyses, multiple mutant-specific CD4+ and CD8+ T cell responses were generated in each DP. These were cytotoxic, polyfunctional and expressed T cell receptors with broad functional avidities. Neoantigen-specific clonotypes were detected after treatment in blood and tumor. Our results provide key insights into this neoantigen-specific adoptive T cell therapy and demonstrate proof of concept for this new therapeutic approach. ClinicalTrials.gov registration: NCT04625205 .


Conflict of interest statement

Competing interests: J.S.W.B., J.V.v.T., S.K., S.W. and I.J. declare no competing interests. D.L., V.K., E.K.J., S.H., E.O.C., K.N.B., E.E., K.S., Y.W., T.S., X.C., G.M., J.H.F.S., S.R., M.R., J.Z.D., J.R.S., V.R.J., C.M.A., C.G., O.C.F., K.M., R.B.G., M.D.M. and M.M.v.B. are employees of BioNTech US or BioNTech SE. B.M.C. is a former employee of BioNTech US. V.K., S.H., K.N.B., K.S., Y.W., X.C., S.R., J.R.S., V.R.J., C.M.A, O.C.F., K.M., R.B.G., M.D.M. and M.M.v.B. own stock in BioNTech. C.M.N., B.N., K.C.S. and M.D.L. are contractors for BioNTech US for manufacture of the BNT221 drug product. M.M.v.B., D.L., C.M.A., J.B.H. and M.D.M. are inventors on patent applications that cover part of this article. J.B.H. received grant or research support from BioNTech US, Bristol Myers Squibb, Novartis AG, Amgen, Sastra Cell Therapy and Asher Bio. BioNTech’s role in this study is disclosed in the author contributions; none of the other organizations had a role in the study or publication. J.B.H. discloses ownership interest in Neogene Therapeutics. J.B.H. has an advisory role for Agenus, AstraZeneca, Bristol Myers Squibb, CureVac, GSK, Imcyse, Iovance Bio, Immunocore, Ipsen, Merck Serono, Merck Sharp & Dohme, Molecular Partners, Novartis, Orgenesis, Pfizer, Roche/Genentech, Sanofi and Third Rock Ventures and is a scientific advisory board (SAB) member at Achilles Tx, BioNTech US, Instil Bio, T-Knife, Neogene Therapeutics (AstraZeneca) and Sastra Cell Therapy. R.B.G. is on the Board of Directors for Alkermes and Zai Lab and is a member of the SAB for Leap Therapeutics.

Figures

Fig. 1
Fig. 1. Patient enrollment, manufacturing process and trial design.
a, NEO-STIM manufacturing process. A tumor and reference blood sample from each patient underwent WES; the tumor sample was also analyzed by RNA-seq, and personalized neoantigens were predicted. Synthetic peptides covering the epitopes were synthesized. These peptides were used in the cell culture process (NEO-STIM) to prime, activate and expand T cells isolated from the patient’s leukapheresis product to generate the BNT221 DP, which was subsequently infused back into the patient after a lymphodepleting chemotherapy regimen. The figure panel was created in BioRender (Gottstein, C. https://BioRender.com/z33v290 (2024)). b, Epitope flow from initial sequencing results to the final T cell response. Variants detected by RNA-seq in the tumor samples were considered to be expressed. The expression of the mutation was calculated as a percentage of reads with the mutation multiplied by gene’s TPM and FPKM to remove gene length bias. Peptides representing 40 top-ranked short epitopes (MHC class I) and 20 top-ranked long epitopes (MHC class II or I/II) were selected for manufacturing. c, Quantification of total and expressed mutations as well as number of manufactured peptides out of the 40 selected class I and 20 selected class II peptides. Abbreviations for patient IDs: NAC, neoantigen cell dose received; NVD, never dosed. d, NCT04625205 trial schematic. e, Patient enrollment: out of 13 patients, 12 initially fulfilled eligibility criteria, but three of those were not dosed due to rapid PD and principal investigator (PI) decision. aOf the nine treated patients, three were assigned to DL1 and six to DL2. The disposition schematic reflects the intent-to-treat population. Actual received doses were lower for three patients in DL2 (see ‘Identification of highest tolerable dose’ subsection and Extended Data Table 2). D, day; FPKM, fragments per kilobase of transcript per million mapped reads; TPM, transcripts per million.
Fig. 2
Fig. 2. Clinical efficacy.
a, Waterfall plot of clinical responses based on RECIST 1.1. Baseline measurement is the CT scan taken on day −7 before the BNT221 infusion. For patients NAC05 and NAC06, RECIST was reported as PD due to the emergence of non-target lesions. b, Spider plot of clinical responses. Patient NAC07 had a resection of one of the target lesions before infusion, which accounted for the change in sum of target lesions at week −15. Note: five patients received bridging therapy during the manufacturing period before BNT221 dosing; these were patients NAC01, NAC03, NAC05, NAC06 and NAC09. No patient had a response reported from these salvage regimens. Treatments were approved therapies in all cases, and details are provided in Extended Data Table 2. Abbreviations for patient IDs: NAC, neoantigen cell dose received; NVD, never dosed.
Fig. 3
Fig. 3. Polyclonal T cell responses in DP are mutant specific, polyfunctional and can be detected in the periphery.
a, Overview of samples and methods used for characterization and tracking of CD4+/CD8+ responses. T cell responses and TCR clonotypes associated with the neoantigen-specific T cells are identified from the DP. Where sample was available, responses were tracked in patient tumors at week −16 and weeks +3–6 and in the peripheral blood at week −12, week +2 and weeks +3–6. The figure panel was created in BioRender (Gottstein, C. https://BioRender.com/k25z010 (2024)). b, Example flow cytometry plots of tet+ CD8+ T cells specific for mutant S100A662:R>W neoantigen in NAC01 in the DP (top) and at +3–6 weeks after infusion (bottom). Percentages are out of total CD8+ T cells. Fluorophores used in top panel were BV650 for tetramer 1 and BV421 for tetramer 2; fluorophores used in bottom panel were BV605 for tetramer 1 and PE for tetramer 2. c, Responses were detected in the DP using MHC class I tetramers for CD8+ responses and upregulation of IFNγ and/or TNF when rechallenged with mutant neoantigen peptide for CD4+ responses (n = 3, technical replicates). Responses shown as below detection limit (BDL) were detected in individual vessels before pooling but not in the final DP. After infusion, CD8+ T cells were detected using MHC class I tetramers, bulk TCR-seq and/or through rechallenge with neoantigen peptide to evaluate degranulation and/or secretion of TNF/IFNγ. Of the 12 patients with characterized DP, sufficient post-infusion PBMC sample was available from nine patients to track CD8+ responses by flow cytometry and bulk TCR-seq and from five to track CD4+ responses by flow cytometry. Most CD8+ responses (38/53) were tracked using both tetramer−based analysis and bulk TCR-seq in blood and bulk TCR-seq in tumor. The remaining responses (15/53) were tracked using tetramer staining in blood only. CD4+ T cells were detected using MHC class II tetramers and/or through rechallenge with neoantigen peptide to evaluate degranulation and/or secretion of TNF/IFNγ. To avoid the detection of false positives, tetramers that use different color combinations were used to confirm responses with an additional sample. Horizontal bar represents mean of all responses. A high frequency within the CD8+ responses correlated with detectability after infusion in periphery (red dots), as determined by unpaired two-sided t-test, P = 0.015. d, Representative data are shown for IFNγ and/or TNF-secreting and/or degranulating CD107a-positive CD8+ tet+ T cells in response to recall with different concentrations of mutant and wild-type PPAN165:P>L from NAC03. Data are shown as mean with s.d. (n = 3, technical replicates) where P values are defined with a two-way ANOVA with Sidak’s multiple comparison test; P values: NS: P = 0.13; ****P ≤ 0.0001. e, Representative data are shown for IFNγ and/or TNF-secreting CD4+ T cells in response to recall with different concentrations of mutant and wild-type GANAB658:E>G from NAC03. Data are shown as mean with s.d. (n = 3, technical replicates) where P values are defined with a two-way ANOVA with Sidak’s multiple comparison test; P values for increasing concentrations: NS: P > 0.99; *P = 0.03; ***P = 0.0004; ***P = 0.0003; **P = 0.002. f, A cytotoxicity assay was performed using A375 target cell lines (lentiviral transduced) expressing either the relevant wild-type or mutant neoantigen on the corresponding HLA allele and co-cultured with CD8+ T cells from the DP (bead isolated). Upregulation of caspase 3 (Cas3) on target cells was used to assess the killing capacity. Representative response for patient NAC03 to mutant and wild-type PPAN165:P>L is shown. MT, mutant; WT, wild-type. Data are shown as mean with s.d. (n = 3, technical replicates) where P values are derived by transforming percentages into proportions, and an additive log ratio transformation was applied before performing a two-tailed Student’s t-test (NS: P > 0.99; ****P ≤ 0.0001). g, Summary of all DP CD8+ responses tested for killing capacity through the cytotoxicity assay. h, Summary of polyfunctionality data for all responses tested in the DPs. All graphs are normalized to total functional cells, which are defined as cells expressing/secreting any single or combination of IFNγ, TNF and/or CD107a. Left panel: CD8+ responses; right panel: CD4+ responses. Abbreviations for patient IDs: NAC, neoantigen cell dose received; NVD, never dosed. NS, not significant.
Fig. 4
Fig. 4. A subset of post-infusion responses are functional.
a, Example flow cytometry plots to illustrate the experimental approach. NAC02 PBMCs were recalled with no peptides (DMSO) or with a peptide pool consisting of all short and long epitope peptides for which responses were detected in the DP. Cells were then stained for HLA-DR, IFNγ, TNF and CD107a for assessing functionality. Left, for CD4+ T cells, gating on cells with high HLA-DR expression enriched for cells considered reactive to the recalled peptide(s) and, therefore, neoantigen specific; right, HLA-DR+ CD4+ cells were further analyzed for IFNγ, TNF and/or CD107a expression. b, Summary of functionality profiles for all patients where functionality of T cell responses (CD8+ and CD4+) was tested in the periphery at +3−6 weeks after infusion. Responses are considered functional if expression of IFNγ, TNF or CD107a is at least 1.5-fold greater in the peptide recall condition compared to no peptide recall (DMSO). c, Post-infusion (weeks +3–6) PBMCs were stained with tetramers and surface antibodies for flow cytometry analysis. No stimulation or recall was performed. Example flow plot, with upper panel showing tet+ cells specific for XIRP1482:P>S in red and tet cells in gray. CD8+ cells were gated according to tetramer positivity and surface expression of activation/exhaustion markers. Lower panel shows mean fluorescence intensity of PD-1 surface expression of XIRP1482:P>S+ (red, CD8+ tet+) and XIRP1482:P>S (gray, CD8+ tet) T cells from NAC03. d, The heatmap shows transformed distance in MFI of tet+ over tet CD8+ T cells (top) and CD4+ cells (bottom). Positive values (red) indicate upregulation, and negative values (blue) indicate downregulation. x axis: surface markers that were quantified in the flow cytometry panel; y axis: patient IDs and the corresponding neoantigen epitopes. For NAC07, the EIFH3359:Q>E epitope was presented on two different class II alleles, and both are shown in the heatmap. Abbreviations for patient IDs: NAC, neoantigen cell dose received; NVD, never dosed. SSC-A, side scatter area.
Fig. 5
Fig. 5. Case study: patient NAC09—tumor reduction, T cell infiltration and neoantigen-specific T cells from DP in periphery and tumor.
a, CT scans from NAC09. Circled regions highlight the target (top) and non-target lesions (bottom) with observed regression between day −7 and week +6. NTL, non-target lesion; TL, target lesion. b, Multiplexed immunofluorescent images of tumor pre-infusion and post-infusion for NAC09 showing CD3+, CD8+ and SOX10+ (top) and CD3+, CD4+ and SOX10+ (bottom) cells. SOX10, a melanoma marker, highlights the tumor cells. Representative images from a total of 20 regions of interest per tissue are shown. c, Detection of MAGEB278:S>F-specific clonotypes in the periphery and in the tumor using bulk TCR-seq. Clonotypes were identified from NAC09 DP using tetramer sorting, followed by scGEX/VDJ/CITE-seq. Bar plot shows frequencies of each clonotype in the DP. d, Percentage of MAGEB278:S>F-specific clonotypes from DP in peripheral blood using bulk TCR-seq of the TCR β-chain. Clonotypes with percentages below the limit of detection for the assay are shown at 0.0001%. e, Percentage of MAGEB278:S>F-specific clonotypes of total TCRs detected in the peripheral blood (left) and tumor (right) pre-infusion and post-infusion using bulk TCR-seq. Note that clone 5 was detected at week +2 but not at weeks +3–6. f, log fold change (FC) of T cell responses for all responses tested in the blood pre-infusion and post-infusion (weeks +3–6) by bulk TCR-seq. inf, infinite fold change (positive: responses that were detected post-treatment only; negative: responses that were detected pre-treatment only). Left, peripheral blood; right, tumor. Clonotypes with percentages below the limit of detection for the assay are shown at 0.0001%. Abbreviations for patient IDs: NAC, neoantigen cell dose received. wk, weeks.
Extended Data Fig. 1
Extended Data Fig. 1. NEO-STIM manufacturing process is feasible and reproducible.
a. Manufacturing process. STIM1: First set of cell culture vessels, which went through the NEO-STIM process for 14 days; note that up to six vessels (depicted as six circles arranged in a bigger circle) were cultured in parallel; STIM2: Second set of cell culture vessels, which were thawed 12 days later than STIM1 and went through NEO-STIM; STIM1 and STIM2 were combined on day 14. The combined cell culture was then expanded until day 26, harvested, and formulated. An aliquot was removed for quality control, and the remaining formulated T cells were frozen until infusion. Abbreviations: DP: drug product; IL7: interleukin-7; IL15: interleukin-15; PBMC: peripheral blood mononuclear cells (from patient leukapheresis). The figure panel was created in BioRender (Gottstein, C. https://BioRender.com/m09o437 (2024)). b. Expansion of cells measured separately for first round of stimulation (STIM1; [Cells Harvested D14] / [Cells Seeded D0]), second round of stimulation (STIM2; [Cells Harvested D26] / [Cells Seeded D12 + Cells Restimulated D14]) and for the combined cell culture ([Cells Harvested D26] / [Cells Seeded D0 + Cells Seeded D12]). c. Distribution of the different blood cell subtypes in PBMC (pre-NEO-STIM) and in the final DP in all patients. d. Turnaround times from tumor biopsy to release of product, including infusion to the patient (needle-to-needle time) for DPs of all treated patients. The cell therapy manufacturing step contains transfer time between peptide manufacturing and start of cell therapy manufacturing, the latter always being 26 days. Abbreviations for patient IDs: NAC: neoantigen cell dose received; NVD: never dosed.
Extended Data Fig. 2
Extended Data Fig. 2. Neoantigen-specific T cells have diverse phenotypes.
Extended Data Fig. 2: Neoantigen-specific T cells have diverse phenotypes. a. Sample treatment schematic for panel B. The figure panel was created in BioRender (Gottstein, C. https://BioRender.com/e86m166 (2024)). b. UMAP plot of multimodal single-cell data (GEX, CITE, VDJ) (top), cell type distribution (bottom), and key cell type markers (right) in drug product (DP) for representative patient NAC01. The grouping on the right y axis of the heatmap is based on current understanding of marker functions (left y axis). Exhausted-like cells were identified, among other features, by high PD-1 and low/absent IL-7RA expression. Italicized markers shown in the heatmap are RNA; non-italicized markers are CITE-seq surface proteins. See Supplementary Fig. 6 for further detail. c. Cell type distribution across de novo responses (not detected pre-treatment; left) or pre-existing responses (detected pre-treatment; right). d. DP frequency by FACS, bulk TCR-seq and number of clonotypes across responses from de novo (orange) or pre-existing (blue) responses. Boxplots show median and 25th and 75th data quartiles. Outliers (whiskers) were defined as 1.5 times the interquartile range. Number of responses across nine patients: n=29;22 (left) and n=17;21 (middle and right). Two-sided Mann-Whitney U test was used for statistical analysis; *P=0.02; ***P=0.0002; ****P=0.000004. Abbreviations for patient IDs: NAC: neoantigen cell dose received.
Extended Data Fig. 3
Extended Data Fig. 3. Neoantigen-specific T cells upregulate a transcriptional activation signature when stimulated with cognate antigen.
a. Activation scores across all responses sequenced. Sequencing: Defined as a response with a significant difference in score between NP and Pep of ≥ 0.1. Statistical evaluation by two-sided t-test without multiple comparison adjustments. NS:P=0.37 (left) and P=0.96 (right); **P=0.005; ****P<0.00001. Fuchs activation score is a cell-level gene set score for T cell genes upregulated in response to peptide recall with viral peptides. See Supplementary Fig. 5 for reference. Cytokines: Defined as T cells producing TNF, IFNγ, and/or CD107a in response to peptide in recall response assay, compared to NP control, as assessed in drug product (DP) characterization experiments. Cytotoxicity: Defined as T cells killing target cells expressing respective neoantigens in cytotoxicity assay of DP characterization experiments. Pre-existing responses and de novo responses determined by bulk TCR-seq and/or tetramer-based flow cytometry in the pre-infusion sample. Note that NAC03 de novo response showed statistical significance when comparing sequencing signatures of NP and Pep, but difference was less than 0.1. NT: Not tested. ND: No data (applies to sequencing responses with only one sample). NP – no peptide; Pep – stimulated with peptide. b. Statistical evaluation of difference in activation scores between all de novo and pre-existing responses. Boxplots show median and 25th and 75th data quartiles. Outliers (whiskers) were defined using 1.5 times the interquartile range. Two-sided Mann-Whitney U test was applied to calculate statistical significance. NS:P= 0.11. n=9;7 for de novo; pre-existing. NP – no peptide; Pep – stimulated with peptide. Abbreviations for patient IDs: NAC: neoantigen cell dose received.
Extended Data Fig. 4
Extended Data Fig. 4. Neoantigen-specific TCRs show diverse functional avidity.
a. Neoantigen-specific VDJ regions from TCRs of the DP were sequenced, alpha and beta chain RNA generated, and transfected into NFAT Jurkat cells to measure functional avidity (n=4, technical replicates). EC50: Peptide concentration resulting in half maximal effect. EC50 datapoints from saturated curves in black; estimated EC50 datapoints from unsaturated curves in gray. Boxplots show median and 25th and 75th data quartiles. Outliers (whiskers) were defined using 1.5 times the interquartile range. b. Minimum peptide concentration required for NFAT activation (n=4, technical replicates). Boxplots as in A. c. Row 1: Number of total CD8+ neoantigen-specific responses detected in the drug products across all patients; row 2: Number of CD8+ responses for which material was available for sequencing and avidity testing. Row 3: Number of TCR clones sequenced; note that there may be more than one TCR clone per neoantigen. Row 4: Number of TCR clones tested for functional avidity. The subset of TCR clones that were found to be neoantigen-specific is shown in panel A and B. TCR clones reported for EC50 values (A): n=22, 2, 40, 8, 12, 9, 9, 4, 6, and minimum peptide concentration (B): n=23, 7, 40, 9, 14, 11, 9, 6, 14 for NAC01-NAC09. Abbreviations for patient IDs: NAC: neoantigen cell dose received.
Extended Data Fig. 5
Extended Data Fig. 5. Transcriptional differences between MAGE-B278:S > F and HIST1H1B203:P > L responses.
a. UMAP of multimodal single-cell data from Patient NAC09 drug product (GEX, CITE, VDJ). b. Percentages of single-cell phenotypes out of all CD8+ T cells for each experimental condition from NAC09 drug product. c. UMAP highlighting MAGEB278:S>F-specific (blue) and HIST1H1B203:P>L-specific (yellow) clonotypes. All highlighted cells underwent antigen recall with peptide prior to sequencing. Tet: bystander cells. d. Heatmap showing phenotypes of HIST1H1B203:P>L-specific cells (left) and MAGEB278:S>F-specific cells (right) after antigen recall by clonotype. Abbreviations for patient IDs: NAC: neoantigen cell dose received.

References

    1. Michielin, O. et al. Cutaneous melanoma: ESMO Clinical Practice Guidelines for diagnosis, treatment and follow-up. Ann. Oncol.30, 1884–1901 (2019). - PubMed
    1. Seth, R. et al. Systemic therapy for melanoma: ASCO guideline update. J. Clin. Oncol.41, 4794–4820 (2023). - PubMed
    1. Larkin, J. et al. Five-year survival with combined nivolumab and ipilimumab in advanced melanoma. N. Engl. J. Med.381, 1535–1546 (2019). - PubMed
    1. Curti, B. D. & Faries, M. B. Recent advances in the treatment of melanoma. N. Engl. J. Med.384, 2229–2240 (2021). - PubMed
    1. Hamid, O. et al. Five-year survival outcomes for patients with advanced melanoma treated with pembrolizumab in KEYNOTE-001. Ann. Oncol.30, 582–588 (2019). - PMC - PubMed

Publication types

Substances

Associated data