. 2025 Feb;4(2):163-179.
doi: 10.1038/s44161-024-00586-x. Epub 2025 Jan 3.

Cardiac conduction system regeneration prevents arrhythmias after myocardial infarction

Affiliations

Cardiac conduction system regeneration prevents arrhythmias after myocardial infarction

Judy R Sayers et al. Nat Cardiovasc Res. 2025 Feb.

Abstract

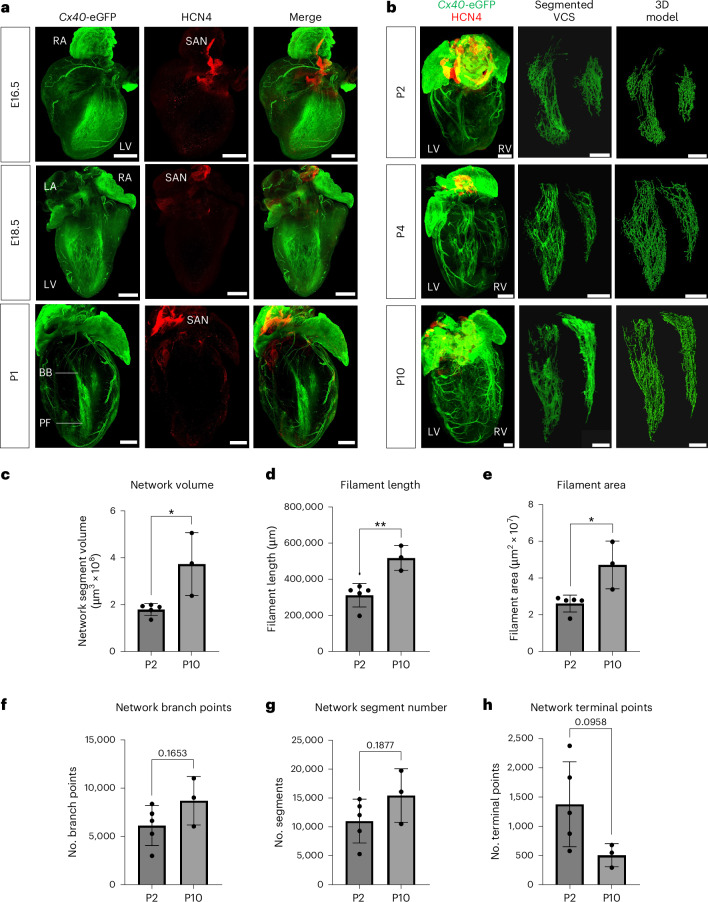
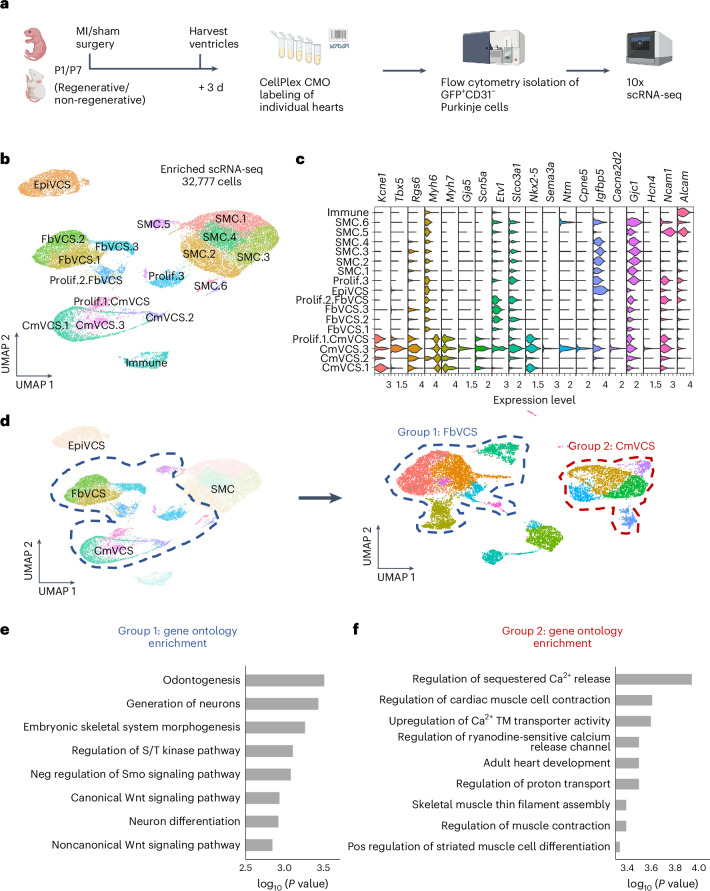
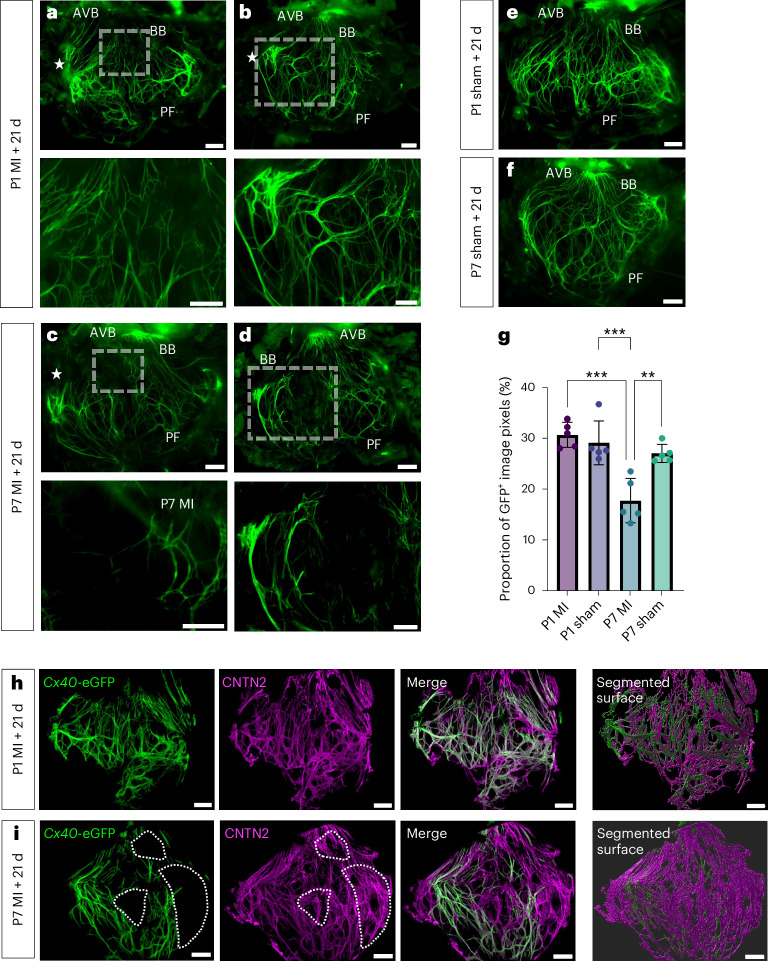
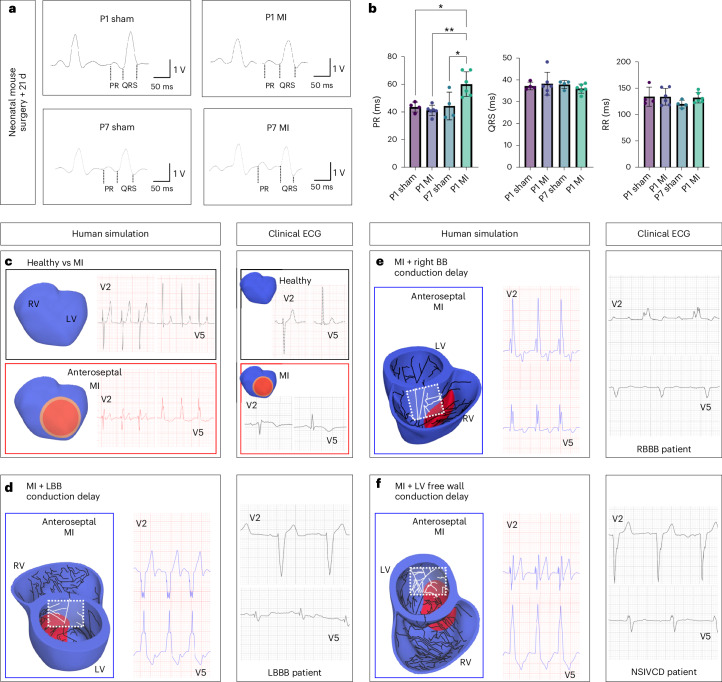
Arrhythmias are a hallmark of myocardial infarction (MI) and increase patient mortality. How insult to the cardiac conduction system causes arrhythmias following MI is poorly understood. Here, we demonstrate conduction system restoration during neonatal mouse heart regeneration versus pathological remodeling at non-regenerative stages. Tissue-cleared whole-organ imaging identified disorganized bundling of conduction fibers after MI and global His-Purkinje disruption. Single-cell RNA sequencing (scRNA-seq) revealed specific molecular changes to regenerate the conduction network versus aberrant electrical alterations during fibrotic repair. This manifested functionally as a transition from normal rhythm to pathological conduction delay beyond the regenerative window. Modeling in the infarcted human heart implicated the non-regenerative phenotype as causative for heart block, as observed in patients. These findings elucidate the mechanisms underpinning conduction system regeneration and reveal how MI-induced damage elicits clinical arrhythmogenesis.


Conflict of interest statement

Competing interests: The authors declare no competing interests.

Figures

Fig. 1
Fig. 1. Developmental growth and expansion of the murine CCS.
a, Three-dimensional-rendered tissue-cleared Cx40eGFP/+ E16.5 (top), E18.5 (middle) and P1 (bottom) hearts, revealing the refinement of trabecular CX40 expression to the developing His–Purkinje network. Green, Cx40-eGFP and anti-GFP antibody, labeling the developing VCS, atria and coronary arteries; red, HCN4, labeling nodal cells of the conduction system. b, Time series of tissue-cleared hearts through postnatal development from P2 to P10. Depicted from left to right, the 3D-rendered whole heart, the segmented VCS network and its 3D filament model. Scale bars, 500 μm. Labels indicate left atrium (LA), right atrium (RA), LV, right ventricle (RV), BBs, Purkinje fibers (PFs) and the sinoatrial node (SAN). ch, Graphs quantifying network volume, filament length, filament area, number of branch points, number of segments and number of terminal points (that is, ends of branches) across postnatal development. Statistics: two-tailed unpaired t-test (*P < 0.05, **P < 0.01, ***P < 0.001); P = 0.0160 (c), P = 0.0054 (d), P = 0.0139 (e); mean values are depicted; error bars plot ±2 s.d.; n = 5 (P2) and n = 3 (P10) independent biological replicates. Source data
Fig. 2
Fig. 2. The His–Purkinje network is disrupted and the bundling of conduction fibers is altered by MI with differences in regenerative versus non-regenerative hearts.
ad, Three-dimensional-rendered tissue-cleared Cx40eGFP/+ hearts following MI or sham surgery at P1 (a,b) versus P7 (c,d), showing disruption of the His–Purkinje network after MI. Panel inserts show maximum intensity projections taken from the same heart, rotated by 90° to look side-on through the ventricle. Stars indicate the location of the LAD ligation. Arrows highlight regions of VCS disruption. Labels indicate left atrium, right atrium, left ventricle, right ventricle and Purkinje fibers. Scale bars, 500 μm for whole-heart images and 200 μm for magnified inserts. eh, The dissected LV His–Purkinje network of Cx40eGFP/+ hearts 3 d after MI or sham surgery at the P1 (e,f) and P7 (g,h) stages. Panels show magnified inserts from the boxed regions of the corresponding P1 and P7 MI images, highlighting the disruption in fiber bundle morphology after MI. Stars indicate the level of the LAD ligation. Labels indicate the atrioventricular bundle (AVB), BBs and Purkinje fibers. Scale bars, 500 μm, 100 μm for magnified inserts. i, Cx40-eGFP signal is significantly increased in the distal Purkinje network below the level of the LAD ligation in P1 MI hearts 3 d after injury but not in P7 MI or P1 or P7 sham-operated hearts at an equivalent time point. ROI, region of interest. Statistics: one-way ANOVA with the Tukey–Kramer test for multiple comparisons (*P < 0.05, **P < 0.01, ***P < 0.001, ****P < 0.0001); P = 0.0015 (P1 MI + 3 d versus P1 sham + 3 d), P = 0.002 (P1 MI + 3 d versus P7 MI + 3 d), P < 0.0001 (P1 MI + 3 d versus P7 sham + 3 d); mean values are depicted; error bars plot ±2 s.d.; n = 6 (P1 MI + 3 d), n = 5 (P1 sham + 3 d), n = 9 (P7 MI + 3 d), n = 8 (P7 sham + 3 d) independent biological replicates. Source data
Fig. 3
Fig. 3. scRNA-seq identifies a heterogeneous transcriptomic signature across the VCS of injured and regenerating murine hearts.
a, Schematic to illustrate the experimental design, including neonatal mouse surgeries, the 3-d-after-injury harvest time point, the CellPlex multiplexing strategy, flow cytometry enrichment and 10x scRNA-seq. CMO, cell multiplexing oligo. b, Uniform manifold approximation and projection (UMAP) visualization of cells integrated across all conditions reveals substantial heterogeneity across the dataset. Cm, cardiomyocyte like; epi, epicardial like; Fb, fibroblast like; SMC, smooth muscle cell. c, Violin plot showing expression of known conduction system markers across clusters in the dataset. The core Purkinje cluster CmVCS.3 shows particularly conserved expression of these canonical conduction system markers. d, Reclustering following removal of smooth muscle, immune and epicardial-like cell populations. Reclustered UMAP identifies two major groups of fibroblast-like (group 1, FbVCS) and cardiomyocyte-like (group 2, CmVCS) conduction cells. e, Top gene ontology enrichment terms for genes upregulated in group 1 fibroblast-like VCS cells (Fisher’s exact test). Neg, negative. f, Top gene ontology enrichment terms for genes upregulated in group 2 cardiomyocyte-like VCS cells (Fisher’s exact test). Pos, positive; TM, transmembrane. Schematic in a created with BioRender.com.
Fig. 4
Fig. 4. Shift in VCS composition and electrical remodeling of conductive subpopulations following MI in regenerating versus non-regenerating hearts.
a, UMAP visualization of the reclustered scRNA-seq data following removal of smooth muscle, immune and epicardial-like VCS cell populations, split by age (P1 versus P7) and treatment (MI versus sham). The boxed region highlights a relative decrease in the group 2 cardiomyocyte-like VCS cluster in the P7 MI dataset. b,c, Milo differential abundance testing identifies significantly enriched or reduced neighborhoods between non-regenerative P7 sham-operated versus MI hearts (b) and infarcted regenerative P1 versus non-regenerative P7 hearts (c). d, Cell cycle analysis identifies three cycling populations in the reclustered scRNA-seq dataset. The cardiomyocyte-like VCS cycling population is missing in the P7 MI dataset, as highlighted by the dashed region. e, Dot plot showing average expression of ion channel and cell–cell adhesion markers with significant differential expression between P1 versus P7 MI hearts within the fibroblast-like VCS group 1. These markers were all upregulated in P1 MI hearts but downregulated in the P7 MI heart. f, Dot plot showing average expression of ion channel and cell–cell adhesion markers with significant differential expression between P1 versus P7 MI hearts within the cardiomyocyte-like VCS group 2. These markers were all upregulated in P1 MI hearts but downregulated in the P7 MI heart. In e,f, only genes not differentially expressed between the P1 sham and P7 sham datasets (using a log2 (FC) cutoff threshold of 0.1) were analyzed to remove developmentally driven expression changes. g,h, HCR gene expression analysis of Slc8a1 (magenta) encoding the NCX1 sodium–calcium exchanger and Ctnna3 (gray) encoding α-catenin on the dissected LV His–Purkinje network of P1 (g) and P7 (h) hearts 3 d after MI (dpi). Numbered inserts below the main image show magnified panels from the corresponding boxed regions. Arrowheads in g highlight HCR probe expression overlapping with Cx40-eGFP-positive conduction fibers in the P1 heart. Arrowheads in h highlight HCR probe expression in Cx40-eGFP-negative gaps in the conductive network. The experiment was repeated independently three times with similar results. Stars indicate the level of the LAD ligation. Labels indicate BBs and Purkinje fibers. Scale bars, 500 μm for whole-heart images and 100 μm for magnified inserts.
Fig. 5
Fig. 5. Fast-conducting CX40 is downregulated in patches of the His–Purkinje network following MI in non-regenerative hearts.
The LV His–Purkinje network of Cx40eGFP/+ hearts 21 d following MI (ad) or sham surgery (e,f) at P1 and P7 stages. ad, Bottom, magnified inserts from the boxed regions of the corresponding images. While the P1 heart showed enriched Cx40-eGFP expression nearest the LAD ligation site but regenerated a full VCS network (a,b, bottom), the P7 network had patches where Cx40-eGFP expression was lost (c,d, bottom). Stars indicate the level of LAD ligation. Labels indicate the AVB, BBs and Purkinje fibers. Scale bars, 200 μm. g, Quantification of the proportion of total pixels in the rectangular region within which the Purkinje fiber network exists, which are Cx40-eGFP+. The percentage of image pixels positive for GFP is significantly lower in P7 MI hearts than that in all other conditions. Statistics: one-way ANOVA with the Tukey–Kramer test for multiple comparisons (*P < 0.05, **P < 0.01, ***P < 0.001); P = 0.0001 (P1 MI versus P7 MI), P = 0.0004 (P1 sham versus P7 MI), P = 0.0028 (P7 sham versus P7 MI); mean values are depicted; error bars plotted for ±2 s.d.; n = 5 independent biological replicates for each condition. h,i, Immunostaining after fixation for the VCS marker CNTN2 (magenta) and GFP (green) (h) revealed that the fibers of the network remained intact but that CX40 was downregulated across patches (dotted regions) remote from the LAD site in the non-regenerative P7 heart after MI (i). The experiment was repeated independently three times with similar results. Scale bars, 500 μm, 100 μm for magnified inserts. Source data
Fig. 6
Fig. 6. Maintenance of cardiac rhythm in regenerating hearts after MI versus delayed conduction during non-regenerative fibrotic repair.
a, Representative lead II surface ECGs from mice 21 d after MI or sham surgery at the P1 and P7 stages. ECGs from P7 mice with MI had prolonged PR intervals, whereas ECGs from P1 mice with MI and P1 and P7 sham-operated mice were comparably normal. b, Graphs quantifying PR, QRS and RR intervals in mice 21 d after P1 sham, P1 MI, P7 sham and P7 MI surgeries. The PR interval was significantly longer in P7 mice with MI than in all other groups, but no significant differences in QRS or RR intervals were detected, indicating an overall delayed atrioventricular conduction in the non-regenerative infarcted heart. Statistics: one-way ANOVA with the Tukey–Kramer test for multiple comparisons (*P < 0.05, **P < 0.01, ***P < 0.001); P = 0.0113 (P1 sham versus P7 MI), P = 0.0014 (P1 MI versus P7 MI), P = 0.0161 (P7 sham versus P7 MI); mean values are depicted; error bars plot ±2 s.d.; n = 6 (P1 MI and P7 MI conditions), n = 4 (P1 sham and P7 sham conditions) with independent biological replicates. cf, Simulated human ECGs presented alongside analogous clinical patient ECGs (corresponding panels on the right) showing leads V2 and V5 in all cases. c, The simulated ECG under healthy conditions closely mirrors the morphology of the ECG from the individual whose anatomy was used to construct the model (black boxes); incorporating an anteroseptal chronic infarct from LAD MI into the model produces an ECG with an inverted T wave, fractured and lengthened QRS and ST deviation (red boxes). ECG alterations are consistent with the clinical ECG in the red box in c, right, obtained from a 70-year-old male with hypertension presenting with angina and out-of-hospital VF arrest (treated with cardiopulmonary resuscitation (CPR) and one successful automated external defibrillator (AED) shock) who had occlusion of the proximal LAD and reduced ejection fraction (42%). The patient’s ECG shows T wave inversion and anterior ST (ST segment between ventricular depolarization (QRS complex) and repolarization (T wave)) elevation. d, Regionally reduced conduction in a defined patch within the LBB in the simulated anteroseptal MI heart results in an ECG signature typical of LBBB, characterized by prolonged QRS and QRS morphology alterations (leading to QS or RS complexes and notched R waves in lateral leads). These alterations are recognizable in the clinical ECG in d, right, obtained from a 69-year-old male with hypertension, type II diabetes mellitus and end-stage renal failure presenting with heart failure symptoms. The patient had large anterior MI with no inducible ischemia on a myocardial perfusion scan. The patient had severely impaired LV systolic function (ejection fraction 30%) and LBBB (QRS duration, 173 ms). e, Regionally reduced conduction in a defined patch within the right BB in the simulated anteroseptal MI heart results in an ECG signature typical of RBBB, including QRS prolongation and morphological changes (RSR′ complex in V1 or V2, slurred S wave in lateral leads). This is comparable to the clinical ECG in e, right, obtained from a 51-year-old man with type II diabetes mellitus presenting with heart failure symptoms 2 years after coronary artery bypass grafting. The patient had severely impaired LV systolic function on transthoracic echocardiography (previously normal), first-degree heart block (277 ms) and RBBB (QRS duration, 161 ms), despite medical optimization. A myocardial perfusion scan showed a fixed apical perfusion defect, further apical-to-mid-inferior lateral defect, with minimal inducible ischemia. f, Regionally reduced conduction in a defined patch of Purkinje fibers in the LV free wall in the simulated anteroseptal MI heart results in an ECG signature typical of NSIVCD (including wide QRS and slurred S wave). Comparable changes are seen in the clinical ECG in f, right, obtained from a 63-year-old male with two previous MI events and subsequent coronary artery bypass grafting presenting with worsening heart failure symptoms. Severely impaired function (ejection fraction, 15%) and primary prevention implantable cardioverter defibrillator. Broadening of QRS (160 ms) with NSIVCD. Source data
Extended Data Fig. 1
Extended Data Fig. 1. A pipeline for tissue clearing, imaging and analysis of mouse hearts through post-natal development.
a. Schematic to illustrate the stages of the sample preparation, tissue clearing, immunostaining, imaging and analysis pipeline developed to enable wholemount imaging of the ventricular conduction system throughout post-natal mouse development. b. Time course of post-natal hearts imaged before and after processing through the tissue clearing pipeline. Scale: imaged on 5 mm graph paper. Schematic in a created with BioRender.com.
Extended Data Fig. 2
Extended Data Fig. 2. Expression of known ventricular conduction system markers show heterogeneous expression across the enriched CX40 + CD31- single-cell RNA-sequencing dataset.
a. Featureplots of Gja5, Irx3, Kcnj3 and Myl4 identify a core Purkinje cluster with most highly conserved expression of ventricular conduction system (VCS) markers. b. Featureplots of other well-known VCS markers show varied expression patterns across the CX40 + CD31- single-cell RNA-sequencing dataset. c. Featureplots of the most differentially expressed genes of the conductive VCS cluster 13 isolated from the cardiomyocyte-enriched single-nuclear RNA-sequencing dataset also show varied expression patterns across the CX40 + CD31- single-cell RNA-sequencing dataset.
Extended Data Fig. 3
Extended Data Fig. 3. Enhanced proliferation of pre-existing CX40-eGFP+ cells does not drive regeneration of the ventricular conduction system.
a. Ki67+ cycling cells are commonly found in non-conductive cells adjacent to the CX40-eGFP-positive VCS in P1 hearts that underwent sham or MI surgery, 3 days after injury. White arrows indicate Ki67 + CX40-eGFP-negative cells. b. There are a small number of cycling VCS cells in the P1 heart 7 days following either sham or MI surgery. White arrows indicate rare Ki67 + Cx40-eGFP-positive cells. Scale bars: 100μm. c. Quantification of the proportion of GFP-positive cells that are also Ki67+ in P1 hearts, 7 days following MI or sham treatments. Statistics: Two-tailed unpaired t test; error bars plotted for +/− 2 SD; n = 3 independent biological replicates Source data
Extended Data Fig. 4
Extended Data Fig. 4. Existing Cx40-positive cells concentrate around damaged areas of the His/Purkinje network during regeneration.
a. Schematic to illustrate experimental design. Cx40-CreERT2/+; mTmG pups were injected with tamoxifen on P1. MI surgery was performed on P2, and hearts were then harvested 4 days later for VCS dissection. b. The dissected CreERT2; mTmG VCS of hearts dissected 4dpi, imaged under green fluorescence (488 nm). Numbered boxes on the right-hand side show magnified panels from the corresponding boxed regions, in which concentrations of GFP-positive traced cells are found adjacent to the injured area of the network. Stars indicate location of the LAD ligation. Scale bars: 500μm, 100μm for zoomed inserts. Schematic in a created with BioRender.com.
Extended Data Fig. 5
Extended Data Fig. 5. Nkx2-5 regulates regeneration of the His/Purkinje network after myocardial infarction.
a–c. Hearts that underwent MI surgery at P1, 21 days after injury (b-c) together with the stage-matched uninjured control (a). Overall regeneration of the His/Purkinje network is seen following MI at P1. d–f. Hearts from Nkx2-5Cre/+ haploinsufficient animals with a hypomorphic conduction system, that underwent MI surgery at P1, 21 days after injury (e-f) together with the stage-matched uninjured control (d). The reduced levels of Nkx2-5 lead to very disrupted His/Purkinje network morphology as compared to the uninjured hypomorphic control. In all cases each image shows a separate individual’s heart. g–i. Hearts that underwent MI surgery at P7, 21 days after injury (h-i) together with the stage-matched uninjured control (g). The His/Purkinje network has sustained alterations following MI at P7. j–l. Hearts from Nkx2-5Cre/+ haploinsufficient animals with a hypomorphic conduction system, that underwent MI surgery at P7, 21 days after injury (k-l) together with the stage-matched uninjured control (j). The hearts recover after P7 MI to a similar extent to the wild-type hearts despite reduced dosage of Nkx2-5. Stars indicate location of the LAD ligation. Labels indicate atrioventricular bundle (AVB), bundle branches (BB), Purkinje fibres (PF). Scale bars: 500μm
Extended Data Fig. 6
Extended Data Fig. 6. Differential gene regulatory network analysis between the regenerating versus non-regenerating ventricular conduction system.
a. Dot plot to show the top gene ontology terms associated with the most differentially expressed regulons between the cardiomyocyte-like VCS of P1 MI versus P7 MI hearts (Fisher’s exact test). The same terms were found associated with the most differentially expressed regulons between the fibroblast-like VCS of P1 MI versus P7 MI hearts. b-c. The most differentially expressed regulons identified through SCENIC analysis between P1 MI versus P7 MI cells in the cardiomyocyte-like VCS (b) and the fibroblast-like VCS (c) populations.
Extended Data Fig. 7
Extended Data Fig. 7. Reconstitution of a full CX40+ conduction network in the regenerative neonatal mouse heart.
The dissected left ventricular His/Purkinje network of Cx40eGFP/+ hearts that did not undergo surgery (a–e), hearts 21 days following P1 sham surgery (f–j), or hearts 21 days following P1 MI surgery (k-o). Five representative hearts are shown in each case. Panels show magnified inserts from the boxed regions of the corresponding MI hearts. The P1 heart reconstitutes an apparently normal conduction network with bright CX40+ bundle branches (k’-o’) and full network coverage in the Purkinje fibre area underlying the infarct (k’-o’), but with especially bright CX40+ fibres still apparent nearest the LAD ligation region. Labels indicate atrioventricular bundle (AVB), bundle branches (BB), Purkinje fibres (PF). Scale bars: 500μm, 100μm for zoomed inserts.
Extended Data Fig. 8
Extended Data Fig. 8. Large gaps in the CX40-eGFP+ bundle branches and Purkinje fibres of the conduction network are sustained in the non-regenerative infarcted mouse heart.
The dissected left ventricular His/Purkinje network of Cx40eGFP/+ hearts that did not undergo surgery (a–e), hearts 21 days following P7 sham surgery (f–j), or hearts 21 days following P7 MI surgery (k–o). Five representative hearts are shown in each case. Panels show magnified inserts from the boxed regions of the corresponding MI hearts. The P7 heart fails to reconstitute a normal conduction network: there are large CX40- negative gaps in the bundle branches (k’-o’) and altered network bundling with gaps extending in some cases to the distal Purkinje region, including in the area underlying the infarct (k’-o’). Labels indicate atrioventricular bundle (AVB), bundle branches (BB), Purkinje fibres (PF). Scale bars: 500μm, 100μm for zoomed inserts.
Extended Data Fig. 9
Extended Data Fig. 9. The pace-maker ion channel HCN4 is ectopically expressed in the infarct area after MI and is more dysregulated in non-regenerative hearts.
Tissue clearing with immunostaining of wholemount Cx40eGFP/+ hearts 7 days following MI or sham surgery at P1 (a) versus P7 (b) stages revealed upregulation of HCN4 in the infarct region which was particularly pronounced in the non-regenerative P7 heart. Hearts are shown in 4-chamber view (top) and in side-view (bottom). Stars indicate location of LAD ligation. c-d. Immunostaining on dissected left ventricular His/Purkinje network 21 days after MI injury. Antibody staining against GFP (cyan), VCS marker contactin-2 (CNTN2) (magenta) and pace-maker ion channel HCN4 (yellow) revealed upregulation of HCN4 in P7 (d) but not P1 (c) hearts adjacent to the VCS network nearest the site of LAD ligation. Stars indicate location of LAD ligation. Labels indicate atrioventricular bundle (AVB), bundle branches (BB), Purkinje fibres (PF). Scale bars: 500μm.
Extended Data Fig. 10
Extended Data Fig. 10. Increased arrhythmic risk caused by VCS conduction delays in MI.
a–d. Scenarios of human-based computer modelling and simulation of cardiac electrophysiology presenting variability in the size of the MI region (a, b: 6.2% of the ventricles; c, d: 10.2% of the ventricles) and the presence of VCS conduction delay regions (a, c: no conduction delay; b, d: with conduction delay in the LV free wall, coloured in white). For each scenario, the simulated ECG is presented with annotations describing the sinus rhythm stimuli (S1, as orange vertical lines) and the occurrence of arrhythmias. Cases a and b show differences in arrhythmia inducibility based on the existence of VCS conduction delays. e-f. are time series of activation maps of cases a and b in the time window 1345–1695 ms, respectively. Repolarisation from the previous sinus rhythm stimulus takes place in both e and f (t = 1345–1395 ms). Case e shows no arrhythmia, as the Purkinje system remained refractory to stimuli from the MI region, hindering reentry. A new stimulus (yellow star in a and e) propagates normally through the VCS (t = 1405–1445 ms) leading to normal ventricular activation (t = 1695 ms). Case f shows a reentrant pattern based on VCS retrograde propagation during ventricular repolarisation (t = 1345–1395 ms). The reentry was caused by the delayed repolarisation in the MI region, eventually entering into the Purkinje fibres retrogradely. The conduction delay in f allows the VCS to recover excitation, thus enabling reentrant patterns. The new sinus rhythm stimulus (yellow star in b and f) collided with the reentrant wavefront in the VCS (red cross, t = 1405 ms), which perturbed the normal activation sequence, prevented uniform depolarisation leading to arrhythmia (t = 1445–1695 ms).

References

    1. Levine, H. J. Rest heart rate and life expectancy. J. Am. Coll. Cardiol.30, 1104–1106 (1997). - PubMed
    1. Boyden, P. A., Albala, A. & Dresdner, K. P. Jr Electrophysiology and ultrastructure of canine subendocardial Purkinje cells isolated from control and 24-hour infarcted hearts. Circ. Res.65, 955–970 (1989). - PubMed
    1. Boyden, P. A., Barbhaiya, C., Lee, T. & ter Keurs, H. E. Nonuniform Ca2+ transients in arrhythmogenic Purkinje cells that survive in the infarcted canine heart. Cardiovasc. Res.57, 681–693 (2003). - PMC - PubMed
    1. Bogun, F. et al. Role of Purkinje fibers in post-infarction ventricular tachycardia. J. Am. Coll. Cardiol.48, 2500–2507 (2006). - PubMed
    1. Matsuyama, T.-A., Tanaka, H., Ishibashi-Ueda, H. & Takamatsu, T. Spatiotemporally non-uniform Ca2+ dynamics of cardiac Purkinje fibers in mouse myocardial infarct. J. Histochem. Cytochem.65, 655–667 (2017). - PMC - PubMed

MeSH terms

LinkOut - more resources