Review
. 2025 Feb;12(6):e2406324.
doi: 10.1002/advs.202406324. Epub 2025 Jan 3.

Periodic Table of Immunomodulatory Elements and Derived Two-Dimensional Biomaterials

Affiliations
Review

Periodic Table of Immunomodulatory Elements and Derived Two-Dimensional Biomaterials

Alireza Rafieerad et al. Adv Sci (Weinh). 2025 Feb.

Abstract

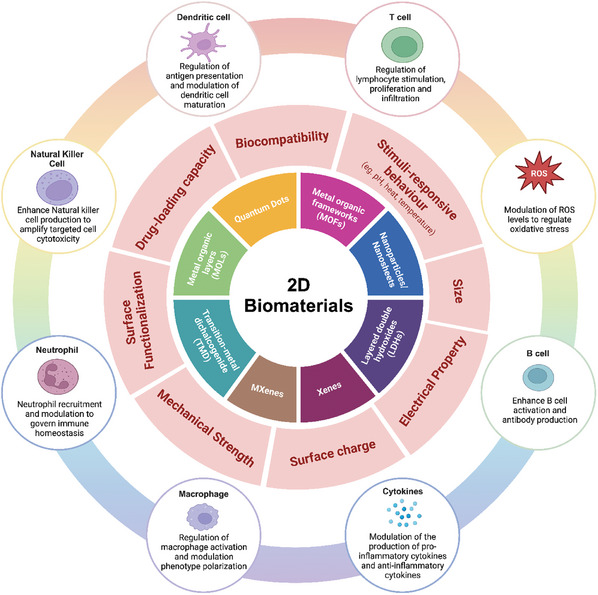
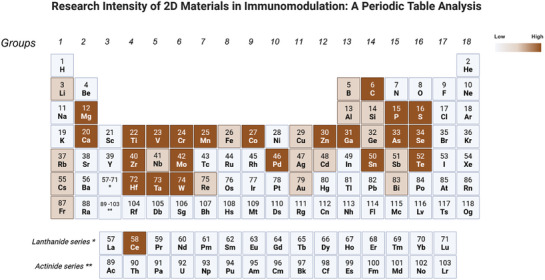
Periodic table of chemical elements serves as the foundation of material chemistry, impacting human health in many different ways. It contributes to the creation, growth, and manipulation of functional metallic, ceramic, metalloid, polymeric, and carbon-based materials on and near an atomic scale. Recent nanotechnology advancements have revolutionized the field of biomedical engineering to tackle longstanding clinical challenges. The use of nano-biomaterials has gained traction in medicine, specifically in the areas of nano-immunoengineering to treat inflammatory and infectious diseases. Two-dimensional (2D) nanomaterials have been found to possess high bioactive surface area and compatibility with human and mammalian cells at controlled doses. Furthermore, these biomaterials have intrinsic immunomodulatory properties, which is crucial for their application in immuno-nanomedicine. While significant progress has been made in understanding their bioactivity and biocompatibility, the exact immunomodulatory responses and mechanisms of these materials are still being explored. Current work outlines an innovative "immunomodulatory periodic table of elements" beyond the periodic table of life, medicine, and microbial genomics and comprehensively reviews the role of each element in designing immunoengineered 2D biomaterials in a group-wise manner. It recapitulates the most recent advances in immunomodulatory nanomaterials, paving the way for the development of new mono, hybrid, composite, and hetero-structured biomaterials.

Keywords: 2D biomaterials; cancer therapy; immunoengineering; immunomodulatory periodic elements; nanomedicine; theranostic.


Conflict of interest statement

The authors declare no conflict of interest.

Figures

Figure 1
Figure 1
A comprehensive, multilayered schematic illustration of 2D biomaterials and their immunomodulatory mechanisms, organized in a concentric circular format. The inner circle represents the different classes of two‐dimensional biomaterials derived from the elements of the periodic table. The middle circle outlines critical physicochemical factors, such as size, surface charge, biocompatibility, stimuli responsiveness, surface functionalization, and electrical, mechanical and drug loading properties, that influence the immune response and therapeutic efficacy of these nanomaterials. The outer circle depicts diverse immunomodulatory mechanisms triggered by the interaction between 2D biomaterials and immune cells. This integrated representation demonstrates how the inherent properties of elements from the periodic table can be harnessed to engineer 2D nanoforms with specific physicochemical characteristics, directly dictating their immunomodulatory regulation in disease treatment and management. For example, owing to their unique physiochemical properties, MXenes modulate both immunosuppressive and immune tolerance pathways. Its excellent photothermal ability harnesses its immunosuppressive behavior in the tumor microenvironment, while its immune tolerance aids in the prevention of allograft rejection and supports various tissue regeneration applications. This multifunctionality demonstrates the versatility of 2D nanomaterials derived from the periodic table of elements, underscoring their potential in diverse therapeutics through tailored immunomodulation.
Figure 2
Figure 2
Research intensity of 2D materials in immunomodulation: a periodic table analysis. Elements are arranged by increasing the atomic size (right to left, top to bottom, groupwise). Dark brown indicates elements with extensive studies, light brown indicates moderate‐ and early‐stage studies, and gray indicates no reported usage in immunomodulation studies.
Figure 3
Figure 3
The antibacterial activity of the rubidium‐hydroxyapatite nanocomposite (Rb‐nHAP) was compared with that of pristine hydroxyapatite by bacterial colony tests on surface samples after 24 hours against (A, C1) Escherichia coli and (B, C2) Staphylococcus aureus (Reproduced with permission.[ 62 ] Copyright 2020, Taylor & Francis Group).
Figure 4
Figure 4
In vivo tumor regression analysis after treatment with cesium‐based biomaterials in mouse xenograft models. The composites were injected into tumors that developed from MCF‐7 cells. (A) Timeline of the experiment performed on animals treated with (B) control; (C) cesium chloride, (D) cesium, and (E) tumor volume images after excision post euthanasia from treated and control animals. (F) Tumor volume regression analysis of the animals. One‐way ANOVA revealed a reduction in the tumor size of the control and nanoccaecal samples (= 0.054). H&E‐stained tumor images after microtomy of waxed tumors from the (G) control, (H) cesium chloride, and (I) cesium‐treated animals. The arrows indicate the approximate locations of the apoptotic‐cell populations with fragmented nuclei (Reproduced with permission.[ 64 ] Copyright 2016, American Chemical Society Publications).
Figure 5
Figure 5
Immunomodulatory characterization of magnesium hydroxide‐modified titanium implants in a tested mouse model. (A) Immunofluorescence imaging of inducible nitric oxide synthase (iNOS) and the mannose receptor cluster of differentiation 206 (CD206) in tissues adjacent to samples. (B) H&E staining; the blue lines indicate the thickness of the fibrous layers. (C) Representative methamphetamine blue‐stained images of the femur bone after implantation for eight weeks (Reproduced with permission.[ 71 ] Copyright 2022, Oxford University Press).
Figure 6
Figure 6
Demonstration of the effect of nanocrystalline magnesium phosphate (NMP) on accelerating bone healing and implant osseointegration processes. (A, B) 3D computerized microtomography models and corresponding analysis of the bone defects at days 3, 7 and 14 revealed a remarkable improvement in bone healing among the NMP‐treated defects. (C) μ‐CT analyses revealed a smaller defect volume, less trabecular separation, greater trabecular thickness and greater number of trabeculae in the NMP‐treated samples than in the control samples. (D) Masson's trichrome staining revealed more collagen formation (E), alkaline phosphatase staining revealed more osteoblasts (F), and tartrate‐resistant acid phosphatase staining revealed more osteoclasts (G) in the NMP‐treated defects. (D, H, I) Computerized microtomograph models and coronal histological sections of titanium‐based implants show more bone in contact with the artificial substrate than do magnesium phosphate‐based nanocomposite‐coated samples. (J) Regression coefficients for the NMP samples. (K) qRT‒PCR analysis revealed that the expression of RunX2 and COL1A1 was upregulated in the nanotreated samples compared with the control samples on day 3. However, no significant differences were observed on day 14. FIB images depicting the bone matrix (L) and the collagen fibers (M) undergoing mineralization by osteoblasts in the treated samples on day 7. Data analyses are assessed by two‐sample‐student calculations (t tests) and accepted as statistically significant (*) at p values of less than 0.05 (Reproduced with permission.[ 78 ] Copyright 2016, American Chemical Society Publications).
Figure 7
Figure 7
In vivo evaluation of inflammation in the tissues around titanium‐ and titanium surface‐modified implants with rods, cubes, and octa‐shaped nanoceria (CeO2@Ti). (A, B) H&E staining after 3 and 6 weeks in the experiments. (C, D) Quantification of immune cells in 72 areas in the surrounding tissues of 24 rats in each group (significantly different from each other: p < 0.05) (Reproduced with permission.[ 116 ] Copyright 2019, Elsevier Ltd.).
Figure 8
Figure 8
(A) Immunofluorescence H&E staining images of inflammatory cytokines, including IL‐6, IL‐1β, and tumor necrosis factor‐alpha (TNF‐α), in the areas surrounding the implanted titanium substrates and rods, cubes, and octa‐shaped CeO2‐coated titanium disks after 3 weeks. (B) Relative intensity of fluorescence detection of these inflammatory cytokines around the control and experimental implants after 3 weeks (significantly different from each group: p < 0.05) (Reproduced with permission.[ 116 ] Copyright 2019, Elsevier Ltd.).
Figure 9
Figure 9
Effects of exposure to 100 µg/L CeO2 for 96 h on gene transcription in Mytilus galloprovincialis hemocytes (white bars) and digestive glands (black bars). (A) Relative expression of superoxide dismutase, catalase, glutathione transferase, 5‐hydroxyl triptamine receptor, lysozyme, mytilin, myticin B, C1q‐domain‐containing protein, Toll‐like receptor i isoform, and metallothionein isoforms 10 and 20. (B) Heatmap of differentially expressed genes in each sample (n = 6, *p < 0.05, and (Mann‒Whitney U test)). (C) Effects of CeO2 on M. galloprovincialis larval development after 48 h in a tested embryotoxicity bioassay. The fertilized eggs were exposed to CeO2 at different doses ranging from 0.01 to 1000 µg/L. (n = 6 for each sample). Inset: Representative light microscopy image of CeO2‐exposed embryos at a concentration of 1000 µg/L at a scale of 20 µm (Reproduced with permission.[ 179 ] Copyright 2019, Elsevier Inc.).
Figure 10
Figure 10
(A) Cytotoxicity assessment of titanium carbide MXene/oxide (Ti3C2Tx MQDs) with human peripheral blood mononuclear cells at different concentrations of 66 ng mL−1 (1x), 10x and 20x after 24 hours of culture via flow cytometry. The live cells were stained green with calcein AM, and the dead cells were stained red with ethidium homodimer‐1. (B) The percentage of viable live lymphocytes. (C) Quantification of stimulated naïve CD4+ T lymphocyte proliferation after 7 days of the experiment. (D) The immune modulatory effects of these MQDs on human T lymphocytes were evaluated. To do this, flow cytometry phenotyping was applied to stimulated naïve CD4+ T cells, and the cells were identified and quantified accordingly. (E) Compared with the control treatment, treatment with these MQDs effectively reduced the percentage of proinflammatory CD4+IFN‐γ+ cells. (F) Identification of CD4+ CD25+ FoxP3+ T‐regulatory cells. (G) Effects of these MQDs on the percentage of CD4+CD25+FoxP3+ regulatory T cells (Reproduced with permission.[ 200 ] Copyright 2019, Wiley‐VCH GmbH).
Figure 11
Figure 11
Transcriptomic analysis (RNA sequencing) of lymphocytes cultured with MXene nanosheet‐treated endothelial cells in a coculture system. Human peripheral blood mononuclear cells (HPBMs) were cultured with Ti3C2Tx MXene‐treated HUVECs followed by activation with interferon (INF)‐gamma. (A, B) A total of ∼37,000 genes were detected within the treated lymphocytes. Among them, ∼2300 genes (6.3 per cent) were significantly upregulated, and approximately 2100 genes were downregulated in the cells cultured with HUVECs treated with MXene at a concentration of 2 µg/mL. (C) Gene set enrichment analysis against 1026 REACTOMEs (the top upregulated pathways are normalized on the basis of cell cycle regulation, and the top downregulated pathways are related to IFN signaling). (D) The graphs show that both IFN‐alpha beta and IFN‐gamma have remarkable enrichment of downregulated genes in the tested samples (n = 3 per group) (Reproduced with permission.[ 201 ] Copyright 2023, Elsevier Ltd.).
Figure 12
Figure 12
Modulation of T‐cell receptor (TCR) and immune cell infiltration by a novel radioenhancer composed of functionalized hafnium oxide crystalline nanoparticles (NBTXR3) activated by radiation therapy (RT). Cell density measurements of (A) CD4+, (B) CD8+, and (C) CD68+ infiltrates in the treated tumors analyzed by immunohistochemistry (IHC) at 5 days after the last RT fraction. For each sample, 3 slices of tumor formalin‐fixed, paraffin‐embedded (FFPE) blocks (the first, middle and third sections of each tumor sample) were stained with antibodies (n = 4–5 mice per group). TCR repertoire analysis, box/whisker representation plots of (D) Simpson‐clonality, (E) Morisita index, and (F) expanded clones of treated (T) and nontreated (–) CT26 tumors. WT‐bearing model mice 3 days after the last RT fraction (n = 7–8 mice per group were analyzed by one‐way ANOVA for Simpson‐clonality and expanded‐clones. The Mann‒Whitney test was used for the other variables, including statistical significance, marked as *p < 0.05, **p < 0.01, ***p < 0.001, and ****p < 0.000. (Reproduced with permission.[ 217 ] Copyright 2022, Springer Nature, Author(s)).
Figure 13
Figure 13
Schematic depicting the exfoliation of degradable hafnium disulfide nanosheet (HfS2)‐modified tannic acid (TA) with potential bioactivity properties for the treatment of inflammatory bowel disease via oral administration or intravenous processes (Reproduced with permission.[ 220 ] Copyright 2022, American Chemical Society Publications).
Figure 14
Figure 14
(A) Fluorescence microscopy images of intracellular ROS. (B) Masson's trichrome staining revealed collagen fibers. (C) Immunohistochemical staining of the cells. (D, E) Demonstration of immune fluorescence images of CD31 and VEGF. (F) Schematic of the in vivo multimodal infection management of designed material‐based thermotherapy. These data suggest the potential of the synthesized system for ROS scavenging and accelerating wound healing (Reproduced with permission.[ 242 ] Copyright 2020, American Chemical Society).
Figure 15
Figure 15
Mechanistic immunomodulatory evaluation of Ta4C3T x MQDs. (A) Light microscopy revealed that these MQDs were internalized into cultured human vein endothelial cells (HUVECs) after 24 hours. (B, C) Quantitative PCR analysis of genes involved in antigen presentation, lymphocyte recruitment, cellular adhesion, and chemokine signaling. (D) Treatment with these MQDs altered the expression of the T‐cell coinhibitor on the surface of these activated cells. (E) Schematic of their immunomodulatory mechanisms in reducing T‐cell activation (Reproduced with permission.[ 247 ] Copyright 2021, Wiley‐VCH GmbH).
Figure 16
Figure 16
(A) Schematic illustration and (B‐E) in vivo immunomodulatory validation of the immunoengineered Ta4C3T x MQD‐based system in a tested rat cardiac allograft vasculopathy model. The animals received a tail‐vein injection at a concentration of 1 mg kg−1/body weight for seven days. (B) A representative photograph of a transplanted aortic segment. (C) Experimental timeline. (D, E) H&E staining confirmed the explanted abdominal segments. Inflammation signs are obvious in the transplanted animals. Furthermore, there appeared to be significant reductions in cell thickening and lymphocyte infiltration in the MQD‐treated group compared with the control group (Reproduced with permission.[ 247 ] Copyright 2021, Wiley‐VCH GmbH).

Similar articles

Cited by

References

    1. Yin H., Xing K., Zhang Y., Dissanayake D. M. A. S., Lu Z., Zhao H., Zeng Z., Yun J.‐H., Qi D.‐C., Yin Z., Chem. Soc. Rev 2021, 50, 6423. - PubMed
    1. Smith B. R., Gambhir S. S., Chem. Rev. 2017, 117, 901. - PubMed
    1. Nanocarriers as an Emerging Platform for Cancer Therapy, Jenny Stanford Publishing, Singapore, 2020.
    1. Pelaz B., Alexiou C., Alvarez‐Puebla R. A., Alves F., Andrews A. M., Ashraf S., Balogh L. P., Ballerini L., Bestetti A., Brendel C., Bosi S., Carril M., Chan W. C. W., Chen C., Chen X., Chen X., Cheng Z., Cui D., Du J., Dullin C., Escudero A., Feliu N., Gao M., George M., Gogotsi Y., Grünweller A., Gu Z., Halas N. J., Hampp N., Hartmann R. K., ACS Nano 2017, 11, 2313. - PMC - PubMed
    1. Chellan P., Sadler P. J., Philos. Trans. R. Soc., A 2015, 373, 20140182. - PMC - PubMed

Substances

LinkOut - more resources