. 2025 Apr;45(4):422-427.
doi: 10.1002/cac2.12658. Epub 2025 Jan 4.

Single-cell multi-omics reveals tumor microenvironment factors underlying poor immunotherapy responses in ALK-positive lung cancer

Affiliations

Single-cell multi-omics reveals tumor microenvironment factors underlying poor immunotherapy responses in ALK-positive lung cancer

Seungbyn Baek et al. Cancer Commun (Lond). 2025 Apr.
No abstract available


Conflict of interest statement

The authors declare that they have no conflicts of interest.

Figures
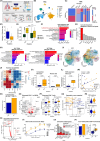
FIGURE 1
FIGURE 1
Comparative analysis of TME of ALK‐positive and WT lung cancer. (A) Study scheme for single cell multi‐omics data and downstream analysis. (B) UMAP plots of immune cells with batch‐corrected scRNA‐seq profiles, color‐coded for cell types. We performed pre‐processing, dimension reductions with batch correction, and clustering to obtain immune clusters. We annotated each cluster with corresponding cell types with cell type markers. (C) Mosaic plots for comparison of immune cell compositions between WT and ALK‐positive groups for each omics approach. The color indicates Pearson residuals, showing enrichment or depletion of the cell types for each group. The yellow dashed lines represent the expected cell proportions, calculated by dividing the total cell counts for each mutation group by the overall total cell counts. Significance was calculated using the Chi‐square test. (D) Ratio of malignant to normal epithelial cells for each mutation group. The malignant and normal epithelial cells were identified through the cell‐classifier and detection of copy number variations. (E) Difference of tumor stemness scores between epithelial cell types for each mutation group. Transcriptome‐based differentiation potential – indicating stemness for tumor cells – for each cell was calculated based on varieties of expressed genes and correlation patterns of commonly expressed genes for stem‐like cells. Significance was calculated using two‐sided Wilcoxon rank‐sum test. n.s., not significant, ****P < 0.0001. (F) Pathway enrichment of top 100 upregulated genes in ALK‐positive malignant cells compared to WT malignant cells for MsigDB Hallmark (2020) gene sets. The color indicates fractions of the query genes that overlap with each reference gene set. Significance was calculated using Fisher's exact test with the Benjamini‐Hochberg correction. (G) Differences in the number of cell‐cell interactions from each immune cell type to malignant cells between ALK‐positive and WT samples. The cell‐cell interactions between two cell types were calculated based on the expressions of known interacting ligands and receptors. (H) Pathway enrichment of top 50 upregulated genes in TAMs of ALK‐positive tumors (left) and those of WT samples (right) for MsigDB Hallmark (2020) gene sets. The color indicates fractions of query genes that overlap with genes of each reference gene set. The P‐values were calculated using the Fisher's exact test with the Benjamini‐Hochberg correction. (I) Stream plots depicting cell transitions according to their RNA velocity for TAMs in ALK‐positive tumors (left) and WT tumors (right). The RNA velocities were calculated by quantifying spliced and unspliced reads for each gene using Velocyto and modeling gene splicing kinetics with scVelo. (J) Heatmap depicting cell type transitions from row to column. The color indicates log2 fold changes calculated by dividing transition probability for TAMs in ALK‐positive tumors by TAMs in WT tumors. (K) Proportions of memory B cells and plasma cells in tumor for each mutation group. Significance of the difference was calculated using the two‐sided Wilcoxon rank‐sum test. (L) Ratios of expanded to non‐expanded memory B cells for each mutation group. Higher ratios indicate higher B cell activation and immune responses. B cells with BCR sequences that had two or more overlapping clones were defined as expanded cells. Significance of the difference was calculated using the two‐sided Wilcoxon rank‐sum test. (M) Scatter plot of relationship between proportion of memory B cells and proportion of CD4+ T cells in each of mutation group. (N) Bar plots depicting total interactions among major components of tertiary lymphoid structure (TLS) composed of B cells, CD8+ T cells, and CD4+ T cells in ALK‐positive and WT tumors. Cell‐cell interaction counts among those cell types were added for each mutation group. (O) Volcano plot of DEGs of exhausted CD8+ T cells between ALK‐positive and WT tumors. The P‐values were calculated using the two‐sided Wilcoxon rank‐sum test with Bonferroni correction. The significant genes are colored red. (P) Comparison of gene signature scores for gene sets related to functions and states of CD8+ T cells for exhausted CD8+ T cells between two mutation groups. Significance of the differences were calculated using the two‐sided Wilcoxon rank‐sum test. (Q) Visualization of two DEG analyses between expanded and non‐expanded effector and exhausted CD8+ T cells for each mutation group. T cells with TCR sequences that had five or more overlapping clones were defined as expanded cells. The genes are considered significant for each mutation group if the adjusted P‐values < 0.05 (by two‐sided Wilcoxon rank‐sum tests with Bonferroni correction). (R) Gene signature scores for exhausted CD8+ T cells with neighboring nodes to IFNG (top) and KLRK1 (bot) within WT and ALK group, respectively. Cell‐type specific networks were constructed for each cell types for each mutation group and neighboring nodes were defined as all connected nodes to the hub genes. The neighboring nodes to IFNG were defined in WT network whereas the neighboring nodes to KLRK1 were defined in ALK network to generate gene signatures. (S) Volcano plot for differentially enriched chromVAR motifs for exhausted CD8+ T cells. The peaks from scATAC‐seq profiles were added with motif information and motif deviations compared to random peak sequences were calculated to generate motif deviation matrices. With those matrices, differentially enriched motifs were calculated. The P‐values were calculated using the two‐sided Wilcoxon rank‐sum tests with Bonferroni correction. (T) Enrichment of genes with BATF motifs from DEGs of exhausted CD8+ T cells between ALK‐positive and WT groups. For each gene in the lists of DEGs, the number of BATF motifs was calculated and compared to genes not in the lists of DEGs. For each BATF motif count threshold, P‐values and odd ratios were calculated using Fisher's exact tests for each mutation group. (U) Number of peaks related to exhaustion‐related genes. Peaks were colored red for containing BATF motifs. (V) Characterization of peaks from exhausted CD8+ T cells that are related to exhaustion genes. Percentages of peaks linked to the exhaustion genes that contained BATF motifs (Left). Average number of peaks co‐accessible to peaks related to the exhaustion genes for each mutation group (Right). Peak co‐accessibilities for each mutation group were calculated based on co‐occurrences of those peaks for cells in each group. Abbreviations: LUAD, lung adenocarcinoma; ALK, Anaplastic lymphoma kinase; WT, wild type; scRNA‐seq, single‐cell RNA sequencing; scATAC‐seq, Single‐cell Assay for Transposase Accessible Chromatin with high‐throughput sequencing; UMAP, uniform manifold approximation and projection; TAM, tumor‐associated macrophage; Inflam, inflamed; Angio, angiogenesis; Prolif, proliferating; RTM, resident tissue‐like macrophage; IFN, interferon; LA, lipid‐associated; BCR, B cell receptor; TLS, tertiary lymphoid structure; DEG, differentially expressed gene; Exh., exhausted.

References

    1. Schenk EL. Narrative review: immunotherapy in anaplastic lymphoma kinase (ALK)+ lung cancer—current status and future directions. Transl Lung Cancer Res. 2023;12(2):322. - PMC - PubMed
    1. Fares J, Fares MY, Khachfe HH, Salhab HA, Fares Y. Molecular principles of metastasis: a hallmark of cancer revisited. Signal Transduct Target Ther. 2020;5(1):28. - PMC - PubMed
    1. Network CGAR. Comprehensive molecular profiling of lung adenocarcinoma. Nature. 2014;511(7511):543. - PMC - PubMed
    1. Chang RB, Beatty GL. The interplay between innate and adaptive immunity in cancer shapes the productivity of cancer immunosurveillance. J Leukoc Biol. 2020;108(1):363‐376. - PMC - PubMed
    1. Waters LR, Ahsan FM, Wolf DM, Shirihai O, Teitell MA. Initial B cell activation induces metabolic reprogramming and mitochondrial remodeling. iScience. 2018;5:99‐109. - PMC - PubMed