. 2025 Jan 28;44(1):115122.
doi: 10.1016/j.celrep.2024.115122. Epub 2025 Jan 3.

Overcoming CD226-related immune evasion in acute myeloid leukemia with CD38 CAR-engineered NK cells

Affiliations

Overcoming CD226-related immune evasion in acute myeloid leukemia with CD38 CAR-engineered NK cells

Luciana Melo Garcia et al. Cell Rep. .

Abstract

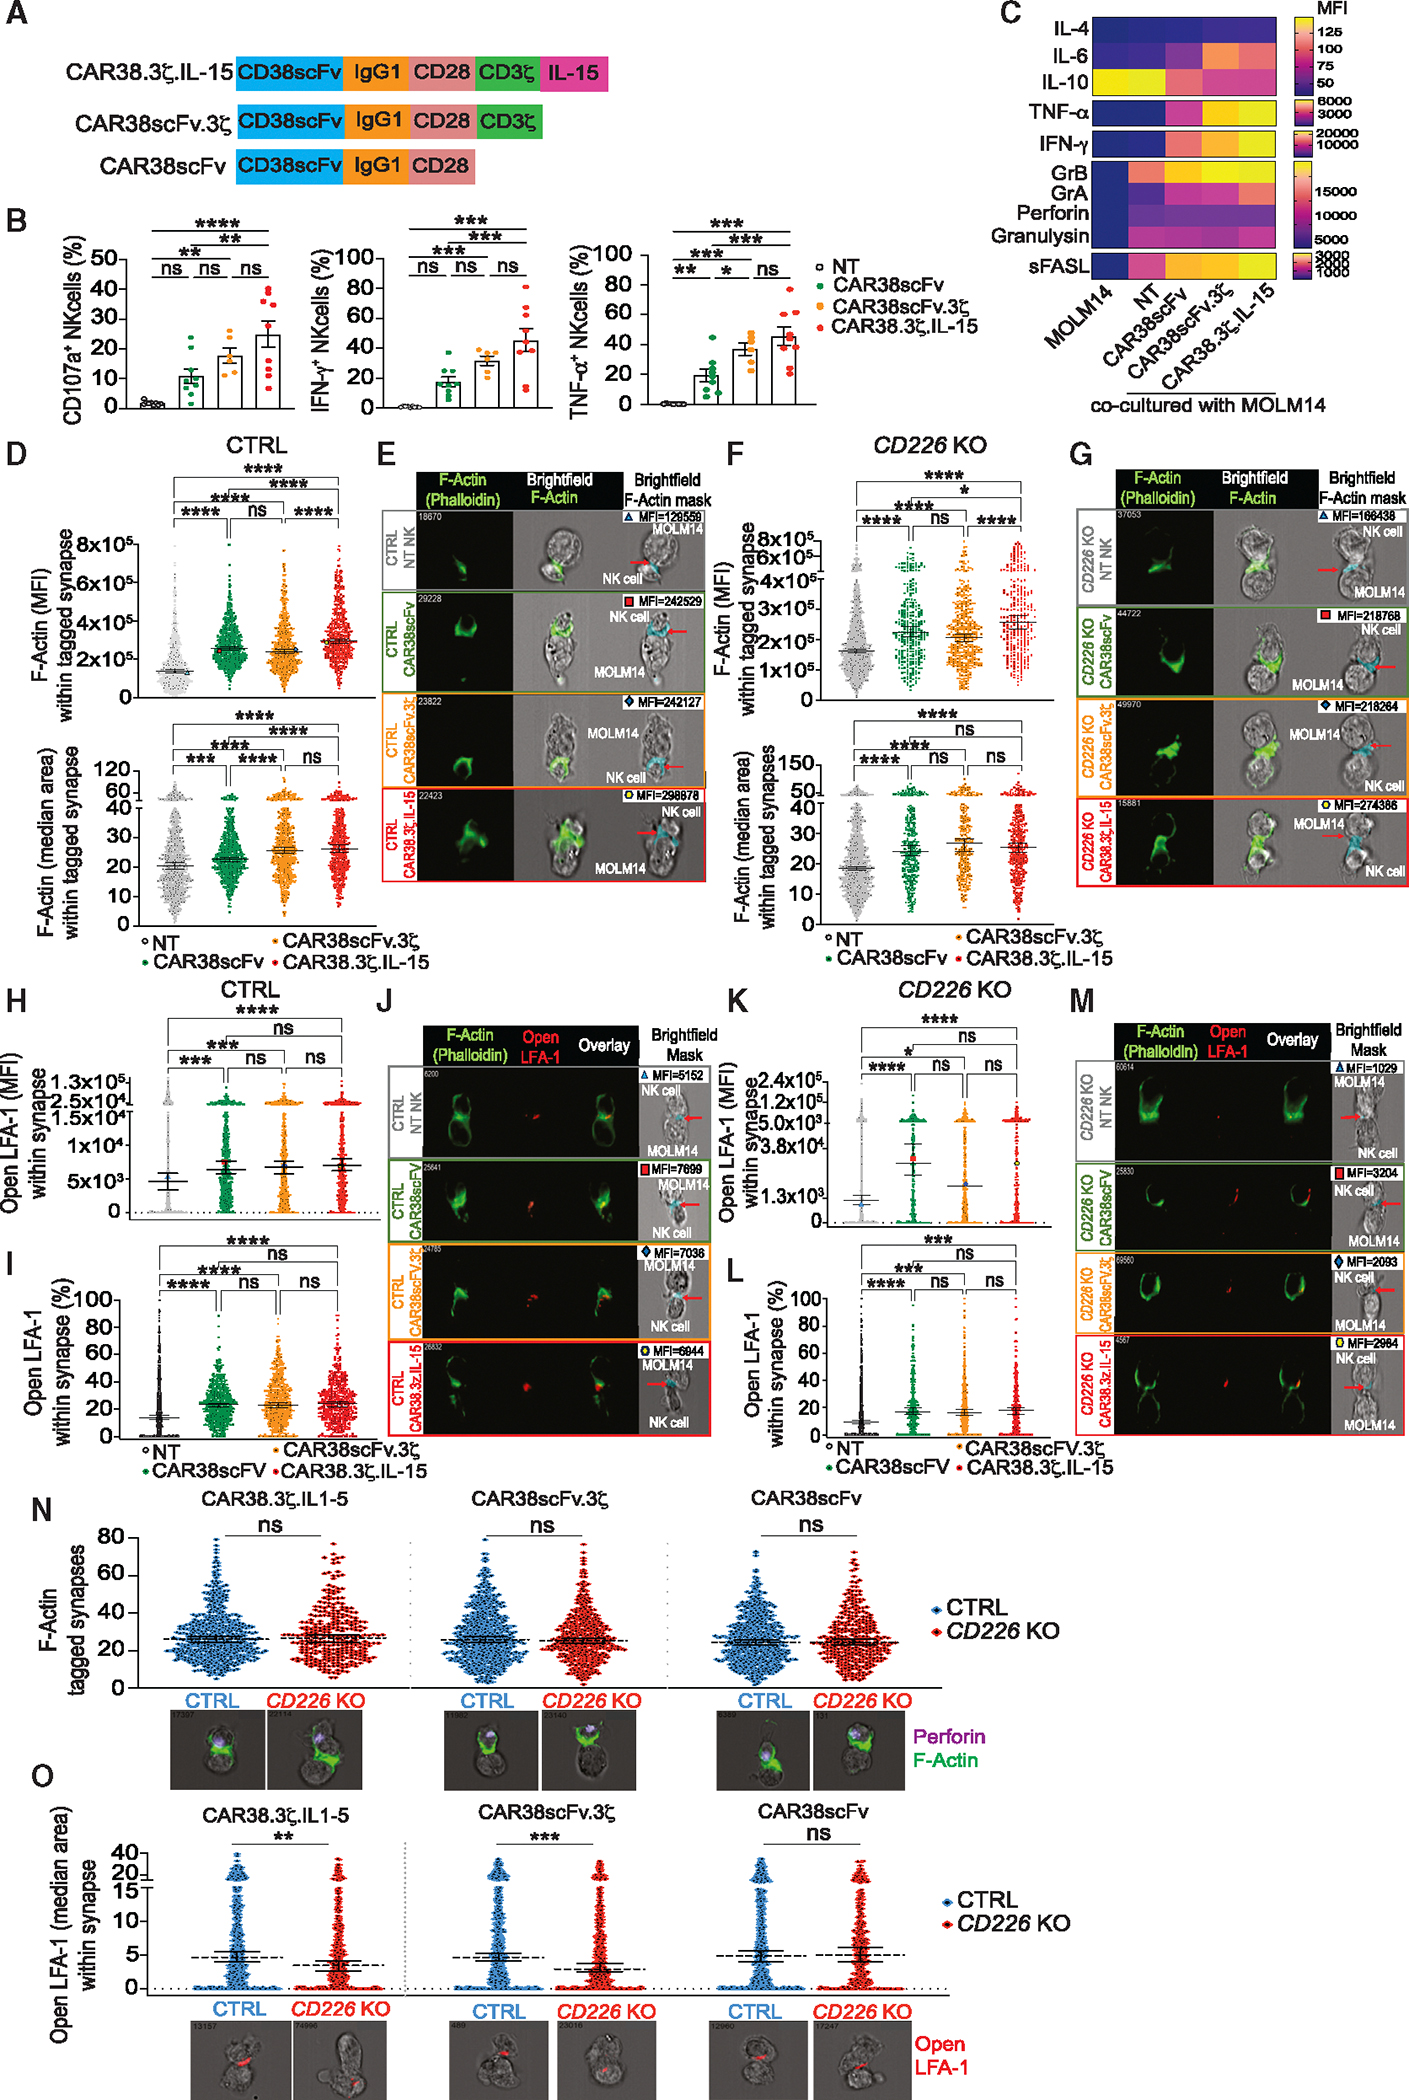
CD226 plays a vital role in natural killer (NK) cell cytotoxicity, interacting with its ligands CD112 and CD155 to initiate immune synapse formation, primarily through leukocyte function-associated-1 (LFA-1). Our study examined the role of CD226 in NK cell surveillance of acute myeloid leukemia (AML). NK cells in patients with AML had lower expression of CD226. CRISPR-Cas9 deletion of CD226 led to reduced LFA-1 recruitment, poor synapse formation, and decreased NK cell anti-leukemic activity. Engineering NK cells to express a chimeric antigen receptor targeting the AML antigen CD38 (CAR38) could overcome the need for CD226 to establish strong immune synapses. LFA-1 blockade reduced CAR38 NK cell activity, and this depended on the CD38 expression levels of AML cells. This suggests parallel but potentially cooperative roles for LFA-1 and CAR38 in synapse formation. Our findings suggest that CAR38 NK cells could be an effective therapeutic strategy to overcome CD226-mediated immune evasion in AML.

Keywords: CAR-NK cell; CD226; CP: Cancer; CP: Immunology; LFA-1; acute myeloid leukemia; immune synapse.


Conflict of interest statement

Declaration of interests P.B., Y.L., P.L., M.D., H.R., R.B., E.L., E.J.S., K.R., and The University of Texas MD Anderson Cancer Center have an institutional financial conflict of interest with Takeda Pharmaceutical. R.B., E.L., and K.R. have an institutional financial conflict of interest with Affimed GmbH. K.R. participates on the scientific advisory boards of Avenge Bio, Virogin Biotech, Navan Technologies, Caribou Biosciences, Bit Bio Limited, Replay Holdings, oNKo Innate, The Alliance for Cancer Gene Therapy ACGT, Innate Pharma, and Shinobi Therapeutics. K.R. is the scientific founder of Syena. E.J.S. has served on the scientific advisory boards of Adaptimmune, Axio, Celaid, FibroBiologics, Navan Technologies, New York Blood Center, and Novartis. M.D. participates on the scientific advisory board of Cellsbin.

Figures

Figure 1.
Figure 1.. AML cells differentially express CD226 ligands
(A) Strategy used for the single-cell RNA sequencing (scRNA-seq) analysis. (B) Distribution plots showing the spatial cluster organization (top left), cluster allocations according to their hierarchy subtype (top right), and their cohort of origin (bottom). (C) Heatmap showing the relative expression of NK cell ligands across the clusters. (D and E) Distribution plots displaying the allocation of CD226 ligands (D) and HLA-A/B/C/E/F/G (E) across NKL clusters and boxplots quantitatively comparing their expression among the clusters. (F) Distribution of AML genomic subgroups across NKL clusters. (G) Violin plots comparing the levels of CD226 ligands between leukemic stem cells (LSC+) and leukemic non-stem cells (LSC−) by scRNA-seq (n = 110 samples) and microarray (n = 227 samples). LSCs were categorized based on their transcriptomic profile (STAR Methods and Zeng et al. 2022). (H) Histograms showing the expression of CD155 and CD112 across genomic subgroups. The histograms display the genomic subgroups in the analysis of the AML cohort combined from BEAT-AML (n = 173), TCGA (n = 281), and Leucegene (n = 410). Each vertical line in the histograms represents an individual patient in this cohort. (I) Boxplots comparing the expression of CD226 ligands by bulk RNA-seq in 44 patients with AML at diagnosis (Dx) and relapse (Rel). Statistics: Wilcoxon rank-sum text (D–G and I).
Figure 2.
Figure 2.. CD226 downregulation on NK cells is dependent on CD155 expression in AML cells
(A) Bar graphs showing percentage of CD226+ and CD226 MMI in NK cells from healthy controls (HCs) (n = 4) and patients with AML (n = 17). (B) Dot plots comparing the percentage of positive cells for each NK cell marker gated on CD56+CD226high and CD56+CD226low/− subpopulations (n = 17 AML samples). (C) UMAP plots showing NK cell clusters based on their expression of NK cell markers by mass cytometry (18,850 NK cells from 13 AML samples). The percentage of NK cells per cluster is shown. (D) Heatmap displaying the expression level of NK cell markers across NK cell clusters. (E) Representative histogram showing the CD226 levels in clusters 1 and 2. (F and G) Violin plots comparing single-cell-level expression of NK cell markers between clusters 1 (n = 4,564 cells) and 2 (n = 4,492 cells). (H) Percentage of CD226+ NK cells after 24 h coculture with AML cells by flow cytometry. Baseline (gray dots): NK cells not exposed to AML cells (n = 10 donors; three independent experiments). (I) Fold reduction in CD226 expression in NK cells after 96 h coculture with AML cell lines by flow cytometry following rechallenge with tumor cells. Each symbol represents one cord blood donor (n = 3). (J) Representative images displaying the CD226 expression on the cell surface (blue) and the internalized CD226 (red). Yellow numbers denote median area of internalized CD226. Violin plots showing median area of internalized CD226 after coculture with AML cells by imaging flow cytometry. For gating strategy, see Figures S2I and S2J. Each circle represents one NK cell. NK cells alone (n = 324); NK cells in coculture (n = 482). (K) Dot plots depicting percentage of CD226+ NK cells and the fold change in MFI relative to the baseline after coculture with U937 (n = 11 donors; four independent experiments). Statistics: t test with Welch’s correction (A and B), two-tailed Student’s t test (F–H), two-way ANOVA (I), Wilcoxon test (J), and one-way ANOVA (K). **p < 0.01, ***p < 0.001, and ****p < 0.0001. Mean ± SD (A); means (B); mean ± SEM (K). MMI, median metal intensity; MFI, median fluorescence intensity; E:T ratio, effector-to-target ratio.
Figure 3.
Figure 3.. CD226 and LFA-1 are essential for cytotoxicity and immunological synapse formation against AML cells
(A) Dot plot showing the percentage of CD226+ NK cells (n = 17 donors). (B) Representative histograms depicting CD226 levels. (C) t-distributed stochastic neighbor embedding (tSNE)-cuda maps showing the distribution of the NK cell receptors in CD226 KO (n = 75,454 NK cells) and CTRL (Cas9 control) groups (n = 73,832 NK cells) (n = 3 donors). Scales represent the expression of NK cell receptors. Violin plots showing MMI of the specific receptors. (D–F) Flow cytometric quantification of CD107a (D), interferon (IFN)-γ (E), and tumor necrosis factor alpha (TNF-α) (F) expression by CD226 KO and CTRL NK cells in coculture with MOLM14 cells (n = 7–10 donors; three independent experiments). Representative zebra plots are shown. (G) Live-image assay showing the killing of CD226 KO and CTRL NK cells against MOLM14 cells (E:T ratio 1:4; n = 9 donors; four independent experiments). Areas under the curve are presented in the bar graph. (H) Percentage and fold change in tagged synapse number for CD226 KO and CTRL groups by imaging flow cytometry. Each colored symbol represents one donor (n = 5; three independent experiments). (I and J) Representative images of F-actin (I) and open LFA-1 (J) within immunological synapses. Bright-field images display the threshold mask (red arrow) used to measure F-actin and open LFA-1 within the synapses. Dot plots show F-actin and open LFA-1 median area and MFI within tagged immunological synapses in CD226 KO (n = 418 synapses) and CTRL (n = 1136 synapses) groups. The same experiments were used as in (H). Symbols represent selected images. For the gating strategy, see Figure S3B and S3C. (K) Percentage of open LFA-1 within the synapse in CD226 KO and CTRL. The same experiments were used as in (H). Statistics: one-way ANOVA with Dunnett’s correction for multiple comparisons (A), two-tailed Student’s t test (C–H), two-way ANOVA with Bonferroni’s correction for multiple comparisons (G), and Mann-Whitney test (I–K). Mean ± SD (A and H), mean ± SEM (G), and median with 95% confidence interval (CI) (I–K). *p < 0.05, **p < 0.01, ***p < 0.001, and ****p < 0.0001; ns, not significant.
Figure 4.
Figure 4.. CAR38 NK cells can mediate effective cytotoxicity against CD38+ AML targets in the absence of CD226
(A) Bar graph showing the CAR38 transduction efficiency (donors = 27). Representative flow cytometry plot showing CAR38 expression in NT and CAR38.3ζ.IL-15 NK cells. (B–D) Flow cytometric quantification of CD107a (B), IFN-γ (C), and TNF-α (D) expression by NT and CAR38 NK cells in coculture with primary AML cells. Each dot represents a combination of an NK cell donor with a CD38+ AML sample (n = 8; two independent experiments). (E) Fold change in Annexin V in NK-AML cocultures. Each dot represents a combination of NK donor:CD38+ AML sample (n = 11; two independent experiments). The patient and disease characteristics are detailed in Table S1. (F) Contour plot showing the expression of CD226 and CAR38 in NK cell groups. (G–I) Flow cytometric quantification of CD107a (G), IFN-γ (H), and TNF-α (I) expression comparing NT ± CD226 KO and CAR38 NK cells ± CD226 KO following coculture with THP-1 and MOLM14 cells. Each dot represents an NK cell donor (n = 6 donors; three independent experiments). (J) Live-image cytotoxicity assay comparing the percentage of killing between CAR38 NK cells ± CD226 KO against MOLM14 (E:T ratio 1:4; n = 4; two independent experiments). (K) Number of tumor cells per well (red count per image) over 16 days performed by real-time imaging analysis (n = 3 donors; three independent experiments). Rechallenges with 50,000 AML cells were performed every 48–72 h (arrows). (L) Representative images showing MOLM14 during the rechallenge assay cocultured with CTRL NT, CD226 KO NT, CTRL CAR38, and CD226 KO CAR38 NK cells. (M) Bioluminescence imaging (BLI) at days 0 and 21 was used to monitor the growth of firefly luciferase (FFluc)-labeled MOLM14 in NSG mice infused with NT, CTRL CAR38.3ζ.IL15, and CD226 KO CAR38.3ζ.IL15 NK cells (n = 5 mice per group). Mice engrafted with MOLM14 only were used as a control. (N) Individual BLI data for the four groups of mice shown in (M). (O) Kaplan-Meyer curves showing the percentage of survival of NSG mice from (M). Statistics: two-tailed Student’s t test (A–E and G–I), two-way ANOVA with Bonferroni’s correction for multiple comparisons (J and K), and log rank (Mantle-Cox) test (O). Mean ± SD (A, E, J, and K). *p < 0.05, **p < 0.01, ***p < 0.001, and ****p < 0.0001.
Figure 5.
Figure 5.. CAR38 NK cells build effective immune synapses in the absence of CD226 and reduced LFA-1 recruitment
(A) Schematic representation of CAR38 constructs. (B) Flow cytometric quantification of CD107a, IFN-γ, and TNF-α expression by NT and CD38 CAR-transduced NK cells cocultured with MOLM14 (E:T ratio 1:1) (n = 6–8 donors; three independent experiments). (C) Heatmap displaying cytokine profile in the supernatants of NK cell-MOLM14 cocultures (E:T ratio 1:1) after 16 h by multiplex bead assay for flow cytometry (n = 5 donors; two independent experiments). (D, H, and I) Dot plots showing the quantification of F-actin (D) and open LFA-1 (H and I) in the tagged synapses in CTRL subgroups. Groups: NT (1,014 synapses), CAR38scFv (1,654 synapses), CAR38scFv.3ζ (1,284 synapses), and CAR38.3ζ.IL-15 (1,320 synapses) (n = 3 donors; two independent experiments). (E and G) Representative images of F-actin accumulation within the synapses. Bright-field images display the threshold mask (red arrow) used to quantify F-actin. (F, K, and L) Dot plots showing the quantification of F-actin (F) and open LFA-1 (K and L) in the tagged synapses in CD226 KO subgroups. Groups: NT (1,401 synapses), CAR38scFv (427 synapses), CAR38scFv.3ζ (544 synapses), and CAR38.3ζ.IL-15 (456 synapses) (n = 2 donors). (J and M) Representative images of open LFA-1 accumulation within the synapses. Bright-field images display the phalloidin threshold mask intersection with open LFA-1 (red arrow) used to quantify LFA-1. (N and O) Dot plots comparing the levels of F-actin (N) and open LFA-1 (O) in the tagged synapses between CTRL and CD226 KO groups in the context of CD38 CAR transduction (n = 2 donors; two independent experiments). Analyzed synapses in CTRL groups: CAR38scFv (1,790 synapses), CAR38scFv.3ζ (1,178 synapses), and CAR38.3ζ.IL-15 (982 synapses). Analyzed synapses in CD226 KO groups: CAR38scFv (427 synapses), CAR38scFv.CD3ζ (544 synapses), and CAR38.3ζ.IL-15 (457 synapses). Below the plots are respective representative images. The top right number is the phalloidin (N) or perforin (O) area of the represented synapse. Statistics: ordinary two-way ANOVA with Bonferroni’s correction for multiple comparisons (B), Kruskal-Wallis test with Dunn’s multiple correction test (D, F, H, I, K, and L), and Mann-Whitney test (N and O). Mean ± SD (B), median fluorescence intensity (MFI) (C), and median with 95% CI (D, F, H, K, L, N, and O). *p < 0.05, **p < 0.01, ***p < 0.001, and ****p < 0.0001.
Figure 6.
Figure 6.. The levels of CD38 on AML cells determine LFA-1 independent of CD38 CAR-targeting NK cells for conjugate formation and effector function
(A) Open LFA-1 expression in NK cells cocultured with K562 (E:T ratio 1:1) ± BIRT 377 (20 μM) assessed by flow cytometry (n = 4 donors; two independent experiments). (B) Representative flow cytometry plots displaying conjugate formation between NK and K562 cells ± BIRT 377. (C) Bar plots showing the percentage of conjugates among live cells in NK cell-K562 cocultures in the presence or absence of BIRT 377. The same experiments were used as in (B). (D) Dot plots showing the frequencies of conjugates between MOLM14 and NK cells transduced with the different CD38-targeting CARs vs. CD5 CAR vs. NT NK cells in the presence or absence of BIRT 377 by flow cytometry. Each dot represents one donor (n = 5–6; three independent experiments). (E) Dot plots comparing MOLM14 killing by NT or NK cells expressing different CD38-targeting CARs in the presence and absence of BIRT 377 during a chromium-release assay (20:1 E:T ratio). Each dot represents one donor (n = 7; three independent experiments). (F) Representative flow cytometry plot showing the CD38 expression by AML cell lines. (G) Bar graph comparing the average number of CD38 molecules per AML cell line estimated by flow cytometry. (H–J) Dot plots showing AML killing by NT and CD38 CAR-transduced NK cells (20:1 E:T ratio) when treated with BIRT 377 during a chromium-release assay (n = 7 donors; three independent experiments). Bar graphs display the relative change in the killing of AML cell lines by NT and CD38-targeting NK cells in the presence or absence of BIRT 377. Statistics: ordinary two-way ANOVA with Bonferroni’s correction for multiple comparisons (A and C), two-tailed paired t Student’s test (D, E, and H–J). Mean ± SD are shown (A, C, D, H, I and J). *p < 0.05, **p < 0.01, ***p < 0.001, and ****p < 0.0001.

References

    1. Shallis RM, Wang R, Davidoff A, Ma X, and Zeidan AM (2019). Epidemiology of acute myeloid leukemia: Recent progress and enduring challenges. Blood Rev. 36, 70–87. 10.1016/j.blre.2019.04.005. - DOI - PubMed
    1. Breems DA, Van Putten WLJ, Huijgens PC, Ossenkoppele GJ, Verhoef GEG, Verdonck LF, Vellenga E, De Greef GE, Jacky E, Van der Lelie J, et al. (2005). Prognostic index for adult patients with acute myeloid leukemia in first relapse. J. Clin. Oncol. 23, 1969–1978. 10.1200/JCO.2005.06.027. - DOI - PubMed
    1. Herberman RB, Nunn ME, and Lavrin DH (1975). Natural cytotoxic reactivity of mouse lymphoid cells against syngeneic acid allogeneic tumors. I. Distribution of reactivity and specificity. Int. J. Cancer 16, 216–229. 10.1002/ijc.2910160204. - DOI - PubMed
    1. Morvan MG, and Lanier LL (2016). NK cells and cancer: you can teach innate cells new tricks. Nat. Rev. Cancer 16, 7–19. 10.1038/nrc.2015.5. - DOI - PubMed
    1. Shimasaki N, Jain A, and Campana D (2020). NK cells for cancer immunotherapy. Nat. Rev. Drug Discov. 19, 200–218. 10.1038/s41573-019-0052-1. - DOI - PubMed

Publication types

MeSH terms

Substances