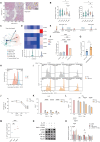
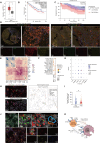
. 2025 Jan 4;13(1):e010183.
doi: 10.1136/jitc-2024-010183.

Spatial and single-cell transcriptomics reveal cellular heterogeneity and a novel cancer-promoting Treg cell subset in human clear-cell renal cell carcinoma

Affiliations

Spatial and single-cell transcriptomics reveal cellular heterogeneity and a novel cancer-promoting Treg cell subset in human clear-cell renal cell carcinoma

Xiyu Song et al. J Immunother Cancer. .

Abstract

Background: Clear cell renal cell carcinoma (ccRCC) is the most common histologic type of RCC. However, the spatial and functional heterogeneity of immunosuppressive cells and the mechanisms by which their interactions promote immunosuppression in the ccRCC have not been thoroughly investigated.

Methods: To further investigate the cellular and regional heterogeneity of ccRCC, we analyzed single-cell and spatial transcriptome RNA sequencing data from four patients, which were obtained from samples from multiple regions, including the tumor core, tumor-normal interface, and distal normal tissue. On the basis, the findings were investigated in vitro using tissue and blood samples from 15 patients with ccRCC and validated in the broader samples on tissue microarrays.

Results: In this study, we revealed previously unreported subsets of both stromal and immune cells, as well as mapped their spatial location at finer resolution. In addition, we validated the clusters of tumor cells after removing batch effects according to six characterized gene sets, including epithelial-mesenchymal transitionhigh clusters, metastatic clusters and proximal tubulehigh clusters. Importantly, we identified a special regulatory T (Treg) cell subpopulation that has the molecular characteristics of terminal effector Treg cells but expresses multiple cytokines, such as interleukin (IL)-1β and IL-18. This group of Treg cells has stronger immunosuppressive function and was associated with a worse prognosis in ccRCC cohorts. They were colocalized with MRC1 + FOLR2 + tumor-associated macrophages (TAMs) at the tumor-normal interface to form a positive feedback loop, maintaining a synergistic procarcinogenic effect. In addition, we traced the origin of IL-1β+ Treg cells and revealed that IL-18 can induce the expression of IL-1β in Treg cells via the ERK/NF-κB pathway.

Conclusions: We demonstrated a novel cancer-promoting Treg cell subset and its interactions with MRC1 + FOLR2 +TAMs, which provides new insight into Treg cell heterogeneity and potential therapeutic targets for ccRCC.

Keywords: Immunosuppression; Immunotherapy; Kidney Cancer; T regulatory cell - Treg; Tumor Microenvironment.


Conflict of interest statement

Competing interests: None declared.

Figures
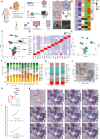
Figure 1
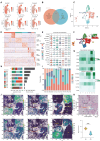
Figure 1. Global analysis of cell populations in ccRCC. (A) Study design and workflow of the ccRCC cohort. ‘‘n’’, sample number. (A, B) (including a and b), and (C) represent different regions for sampling; A: tumor core; B: tumor-normal interface; a: tumor rim, b: adjacent normal, C: distal normal kidney. (B) Heatmap illustrating the clinical features of the tumors sequenced. See online supplemental table S1 for detailed information. (C) Overall UMAP plot of all the single cells in our study. scRNA-seq libraries from a nine-to-one mixture of CD45+ immune cells and CD45 cells for each sample. (D) Heatmap showing the top marker genes of 11 major cell types. All the marker genes are listed in online supplemental table S2. (E) UMAP, (F) cell type, and (G) sampled region showing the tissue distributions of 11 major cell types. (H) Flow cytometry analysis of CD3+ T cells in renal tumor and normal regions in all patients. ****p<0.0001, one-way analysis of variance; error bars, SD. (I) Comparison of CD4+ and CD8+ T-cell percentages as determined by flow cytometry (percentage of CD3+ T cells) versus scRNA-seq (percentage of CD3+ T cells) and fit with linear regression models. (J) Annotated spatial map of P7. Lines denote different regions. (K) Spatial transcriptomic feature plots showing the spatial distribution of each cell type in P7. AN, adjacent normal; ccRCC, clear cell renal cell carcinoma; DC, dendritic cell; DN, distal normal; EC, endothelial cell; NK, natural killer; PBMC, peripheral blood mononuclear cell; scRNA-seq, single-cell RNA sequencing; stRNA-seq, spatial transcriptome RNA sequencing; TC, tumor core; TMA, tissue microarray; TR, tumor rim; UMAP, uniform manifold approximation and projection.
Figure 2
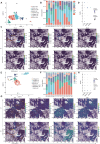
Figure 2. Abundance and heterogeneity of meta-programs in clear cell RCC cells. (A) UMAPs depicting the relative expression of each gene set for all RCC cells. (B) Venn diagram representing identical and differential genes between GeneSet1 and GeneSet5. (C) UMAP showing subclustering and annotations of RCC cell compartments. (D) Heatmap and (E) violin plots showing the expression of the top differentially expressed genes in RCC cell clusters. All the marker genes are listed in online supplemental table S2. (F) UMAP with superimposed RNA velocity analysis of the RCC cell subsets, with zoomed-in windows highlighting possible directional flows from RCC0 to RCC2. (G) Heatmap showing the expression of cell proliferation-related genes and cytokine receptor genes in RCC cell clusters. (H) Cell type and (I) sampled region showing the interpatient variability of the single-cell RNA sequencing results. (J) The spatial distribution of each RCC cell subset in patients. (K) Spatial mapping locations of RCC4 cells. Quantification of RCC4 cell numbers at different spatial locations (bottom). ***p<0.001, unpaired t-test. AN, adjacent normal; DN, distal normal; RCC, renal cell carcinoma; TC, tumor core; TR, tumor rim; UMAP, uniform manifold approximation and projection.
Figure 3
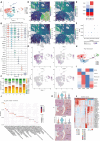
Figure 3. Regional characterization and heterogeneity of stromal cells in clear cell renal cell carcinoma. (A) UMAP showing subclustering and annotations of fibroblast compartments. (B) Distribution of fibroblasts across the eight clusters for each sample. (C) The spatial distribution of each fibroblast subset in P7. (D) Dot plot of IL1R1+ CAF and Collagen CAF markers. (E) UMAP showing subclustering and annotations of endothelial cell compartments. (F) Distribution of endothelial cells across the seven clusters for each sample. (G) The spatial distribution of each endothelial cell subset in P6 and P7. (H) Dot plot of collagen EC markers. AN, adjacent normal; CAF, cancer-associated fibroblast; DN, distal normal; EC, endothelial cell; TC, tumor core; TR, tumor rim; UMAP, uniform manifold approximation and projection.
Figure 4
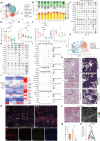
Figure 4. MRC1+FOLR2+ TAMs tend to exhibit a stronger procarcinogenic phenotype in clear cell renal cell carcinoma. (A) UMAP showing subclustering and annotations of myeloid cell compartments. (B) Violin plots displaying marker genes for myeloid cell clusters. All the marker genes are listed in online supplemental table S2. (C) Distribution of myeloid cells across clusters among different samples. (D) Spatial distribution of the four groups of macrophages in P6. (E) Heatmap showing the expression of tissue-resident marker genes in macrophage clusters. (G) UMAP plot showing marker gene expression in the four groups of macrophages. (F) Dot plots of markers for the four groups of macrophages. (H) UMAP with superimposed RNA velocity analysis of the macrophage subsets. (I) Heatmap of the distribution of immune checkpoints on macrophages. (J) Enriched pathways in TAM2 cells according to the KEGG pathway enrichment analysis. (K) Violin plots displaying signature genes for TAM2 cells and cell segmentation showing the spatial distribution of TAM2 cells. (L) Heatmap of the transcription factors estimated by SCENIC for myeloid cells. AN, adjacent normal; CAF, cancer-associated fibroblast; cDC, conventional dendritic cell; DC, dendritic cell; DE, differently expressed; DN, distal normal; EC, endothelial cell; KEGG, Kyoto Encyclopedia of Genes and Genomes; pDC, plasmacytoid dendritic cell; TAM, tumor-associated macrophage; TC, tumor core; TR, tumor rim; UMAP, uniform manifold approximation and projection.
Figure 5
Figure 5. Single-cell analysis reveals a group of IL1B-expressing Treg cells in clear cell renal cell carcinoma. (A) UMAP showing subclustering and annotations of CD4+ T-cell compartments. (B) Distribution of CD4+ T cells across clusters among different samples. (C) Violin plots showing marker genes for CD4+ T-cell clusters. All the marker genes are listed in online supplemental table S2. (D) Quantification of Treg cells (percentage of CD4+FoxP3+ cells pregated on CD3+ T cells) in all patients averaged across renal tumor and normal regions. *p<0.05, ****p<0.0001; one-way ANOVA. (E) Geometric mean fluorescence intensity (gMFI) of FoxP3 staining gated on CD4+FoxP3+ cells averaged across renal tumor and normal regions. *p<0.05, **p<0.01, ***p<0.001, ****p<0.0001; one-way ANOVA. (F) gMFI of CTLA-4 staining gated on CD4+FoxP3+ Treg cells and CD4+FoxP3 Th cells (n=8 subjects per group). ***p<0.001, ****p<0.0001, ns, no significance, one-way ANOVA test. (G) UMAP showing subclustering and annotations of Treg cell compartments. (H) Violin plots showing marker genes for Treg cell clusters. All the marker genes are listed in online supplemental table S2. (I) Dot plots and (J) heatmap of markers for Treg cells. (K) The spatial distribution of each Treg cell subset in patients (P3, P6 and P7). (L) Cell segmentation showing the spatial distribution of IL-1β+ Treg cells. (M) Flow cytometry analysis of IL-1β+ Treg cells in renal tumor and normal regions. *p<0.05, one-way ANOVA test. (N) Quantification of Treg cells (percentage of CD4+FoxP3+IL-1β+ cells pregated on CD4+FoxP3+ cells) by multiplex immunofluorescence. ***p<0.001, ****p<0.0001; one-way ANOVA test. (O) mIHC images of formalin-fixed paraffin-embedded sections from renal tumor and normal regions. Sections were stained with the indicated antibodies and counterstained with DAPI. The box represents the enlarged area shown in the center panel. The white arrows point to cells positive for CD4, FoxP3, and IL-1β. AN, adjacent normal; ANOVA, analysis of variance; CTLA-4, cytotoxic T-lymphocyte associated protein 4; DAPI, diamidino-2-phenylindole; DN, distal normal; IF, tumor-normal interface; IL, interleukin; TC, tumor core; TR, tumor rim; Treg, regulatory T cell.
Figure 6
Figure 6. IL-18 promotes the production of terminal effector Treg cells with stronger immunosuppressive function via the ERK/NF-κB pathway. (A) Schematic diagram indicating the 100 µm range around the mapping spots of Treg cells in cluster 5. (B) Quantification of activated CD4+ and CD8+ T cells within 100 µm around six groups of Treg cells from patients. *p<0.05, **p<0.01, ****p<0.0001; one-way ANOVA. (C) UMAP with superimposed RNA velocity analysis of the Treg cell subsets. (D) Heatmap and violin plot showing differentially expressed cytokine/chemokine receptor genes across Treg cell subclusters. (E) Flowchart for inducing IL-1β+ Treg cell in vitro experiments. (F) Reverse transcription-quantitative PCR analysis of IL1B expression in Treg cells from peripheral blood mononuclear cells of patients with clear cell renal cell carcinoma. ***p<0.001, ****p<0.0001; one-way ANOVA test. (G) Quantification of IL-1β+ Treg cells (percentage of IL-1β+ cells pre-gated on CD4+FoxP3+ Treg cells) with/without simulation with IL-18. *p<0.05, one-way ANOVA test. (H)(I) Proliferation of CD8+ Tresp cells co-cultured with Treg cells or IL-1β+ Treg cells in 1:0.25-1:1 ratio, assessed as CFSE dilution. (H) (J) Comparison of proliferation percentage of CD8+ Tresp cells co-cultured with Treg cells or IL-1β+ Treg cells in 1:0.25–1:1 ratio. ****p<0.0001; one-way ANOVA test. (K) The proportion of Ki-67-positive CD8+ Tresp cells co-cultured with Treg cells or IL-1β+ Treg cells in 1:0.25–1:1 ratio. ****p<0.0001; one-way ANOVA test. (L) IFN-γ production of CD8+ Tresp cells co-cultured with Treg cells or IL-1β+ Treg cells in 1:0.25–1:1 ratio. **p<0.01, ****p<0.0001; one-way ANOVA test. (M) Quantification of IL-1β+ Treg cells (percentage of IL-1β+ cells pre-gated on CD4+FoxP3+ Treg cells) with simulation of IL-18 and PMA/TBHQ (control is only stimulated with IL-18). **p<0.01, ***p<0.001; one-way ANOVA test. (N) (O) Western blot analysis results of the Treg cells treated with 50 ng/mL IL-18 with or without 5 µM U0126 or BAY 11–7082 were determined. U0126: an ERK inhibitor, BAY 11–7082: an NF-κB inhibitor (O) Quantification of the expression levels of the proteins in (N). *p<0.05, ***p<0.001, ****p<0.0001; one-way ANOVA test. ANOVA, analysis of variance; CFSE, carboxyfluorescein diacetate succinimidyl ester; IFN, interferon; IL, interleukin; NC, negative control, unstimulated CD8+ Tresp cells only; PC, positive control, stimulated CD8+ Tresp cells only; PMA, phorbol 12-myristate 13-acetate, an NF-κB activator; TBHQ, tert-butylhydroquinone, an ERK activator; Treg, regulatory T cell; Tresp, proliferation of responder T; UMAP, uniform manifold approximation and projection.
Figure 7
Figure 7. Terminal effector Treg cells are linked to decreased survival, increased immune evasion and tumor growth via interactions with MRC1+FOLR2+ TAMs. (A) Box plots of the different messenger RNA expression levels of Treg cells in cluster five signature genes (FOXP3, IL1B, and FCER1G) in paired tumor and adjacent normal tissues of kidney renal clear cell carcinoma (KIRC) based on the The Cancer Genome Atlas data set. (B) Kaplan-Meier overall survival curves grouped by terminal effector Treg signature genes in KIRC. (C) (D) TMAs was stained for CD4, FoxP3, IL-1β and FcRγ by mIHC to measure the relationship between terminal effector Treg cell infiltration and the prognosis of patients with ccRCC. (C) Kaplan-Meier curves showing overall survival for the percentage of IL-1β+FcRγ+ Treg cells within total Treg cells (n=81). (D) Representative dots showing high (left) and low (right) infiltrations of IL-1β+FcRγ+ Treg cells in ccRCC. The yellow boxes represent the enlarged areas. (E) Heatmap of the number of significant ligand-receptor interactions between major cell types and each Treg cell population. (F) CellPhoneDB analysis of ligand-receptor interactions between terminal effector Treg cells and macrophages. (G) Dot plot showing the expression of related ligands and receptors in macrophages. (H) Strategy for analyzing the proximity of IL-1β+ Treg cells to the nearest CD206+ TAMs and other macrophages by mIHC. Scale bars: 50 µm. (I) Quantification of the proximity of IL-1β+ Treg cells to the nearest CD206+ TAMs and other macrophages in mIHC. *p<0.05, unpaired t-test. Each point in the plot represents the average of five similar values. (J) Representative images showing the physical interactions between terminal effector Treg cells and TAM2 cells in spatial transcriptomes (above) and mIHC (below). Terminal effector Treg cells (orange), TAM2 cells (blue). (K) Schematic summarizing the interactions between terminal effector Treg cells and TAM2 cells. ccRCC, clear cell renal cell carcinoma; DAPI, diamidino-2-phenylindole; DC, dendritic cell; EC, endothelial cell; IL, interleukin; mIHC, multiplex immunohistochemistry; NK, natural killer; TAM, tumor-associated macrophage; TGF, transforming growth factor; TMA, tissue microarray; TPM, transcripts per million; Treg, regulatory T cell; UMAP, uniform manifold approximation and projection.

References

    1. Leibovich BC, Lohse CM, Crispen PL, et al. Histological subtype is an independent predictor of outcome for patients with renal cell carcinoma. J Urol. 2010;183:1309–15. doi: 10.1016/j.juro.2009.12.035. - DOI - PubMed
    1. Lipworth L, Morgans AK, Edwards TL, et al. Renal cell cancer histological subtype distribution differs by race and sex. BJU Int. 2016;117:260–5. doi: 10.1111/bju.12950. - DOI - PubMed
    1. Motzer RJ, Jonasch E, Agarwal N, et al. Kidney Cancer, Version 3.2022, NCCN Clinical Practice Guidelines in Oncology. J Natl Compr Canc Netw. 2022;20:71–90. doi: 10.6004/jnccn.2022.0001. - DOI - PMC - PubMed
    1. Braun DA, Bakouny Z, Hirsch L, et al. Beyond conventional immune-checkpoint inhibition - novel immunotherapies for renal cell carcinoma. Nat Rev Clin Oncol. 2021;18:199–214. doi: 10.1038/s41571-020-00455-z. - DOI - PMC - PubMed
    1. Li R, Ferdinand JR, Loudon KW, et al. Mapping single-cell transcriptomes in the intra-tumoral and associated territories of kidney cancer. Cancer Cell. 2022;40:1583–99. doi: 10.1016/j.ccell.2022.11.001. - DOI - PMC - PubMed

MeSH terms

LinkOut - more resources