. 2025 Jan 4;18(1):2.
doi: 10.1186/s13045-024-01655-1.

D-ribose-5-phosphate inactivates YAP and functions as a metabolic checkpoint

Affiliations

D-ribose-5-phosphate inactivates YAP and functions as a metabolic checkpoint

Cheng-E Tu et al. J Hematol Oncol. .

Abstract

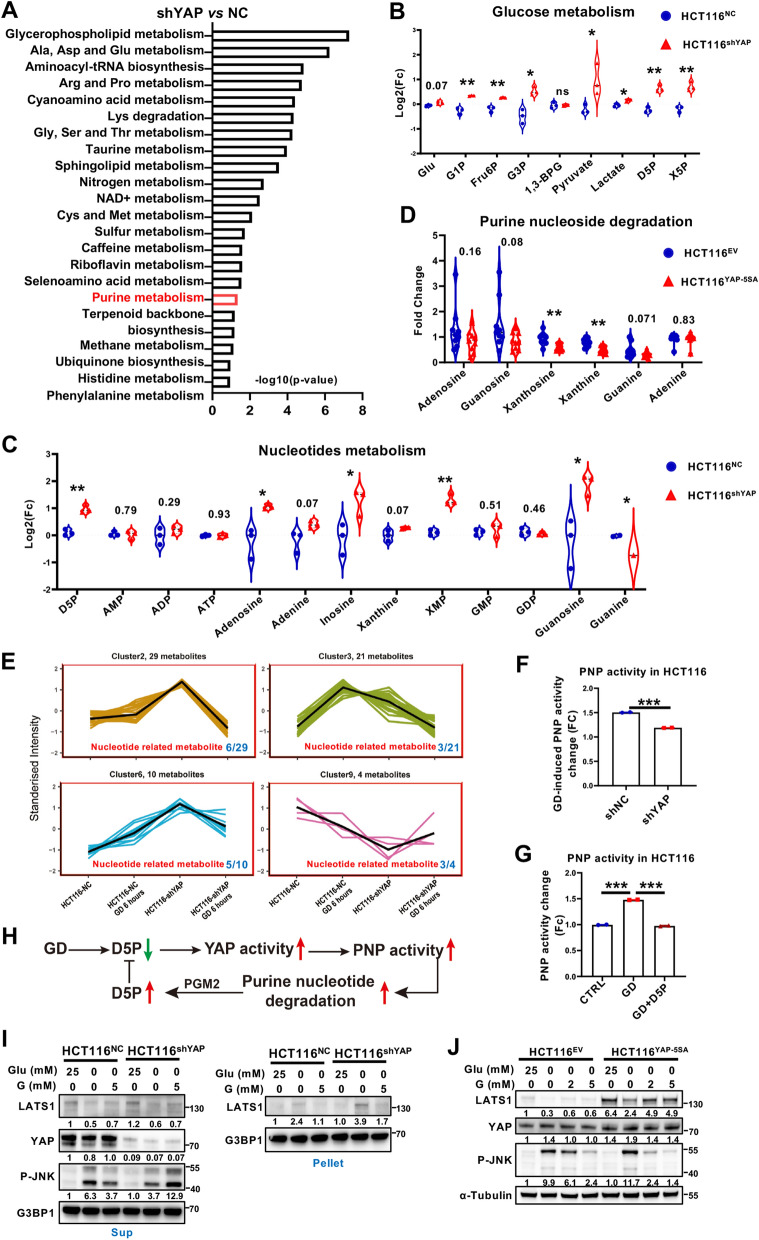
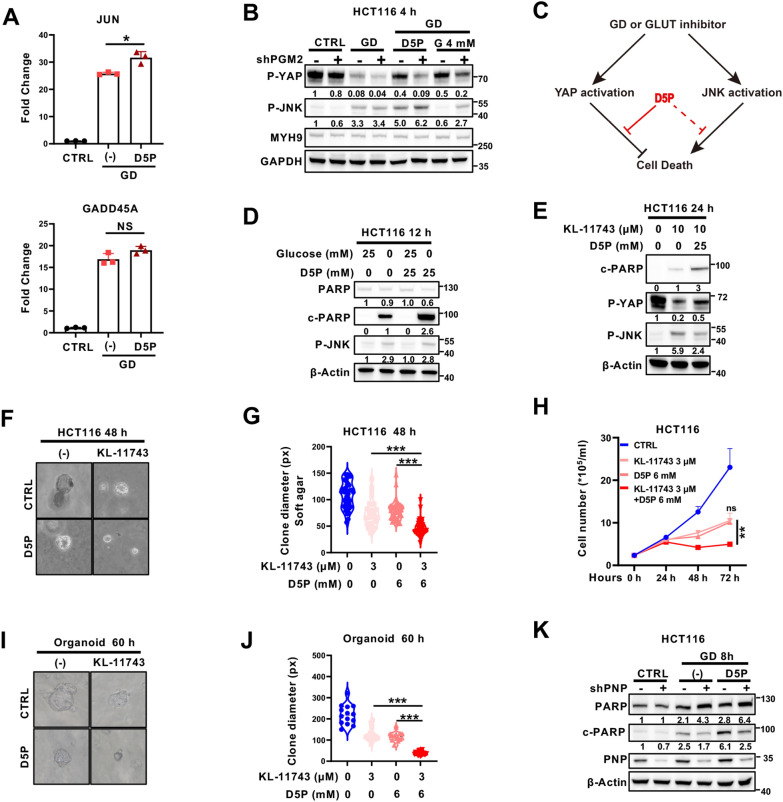
Background: Targeting glucose uptake by glucose transporter (GLUT) inhibitors is a therapeutic opportunity, but efforts on GLUT inhibitors have not been successful in the clinic and the underlying mechanism remains unclear. We aim to identify the key metabolic changes responsible for cancer cell survival from glucose limitation and elucidate its mechanism.

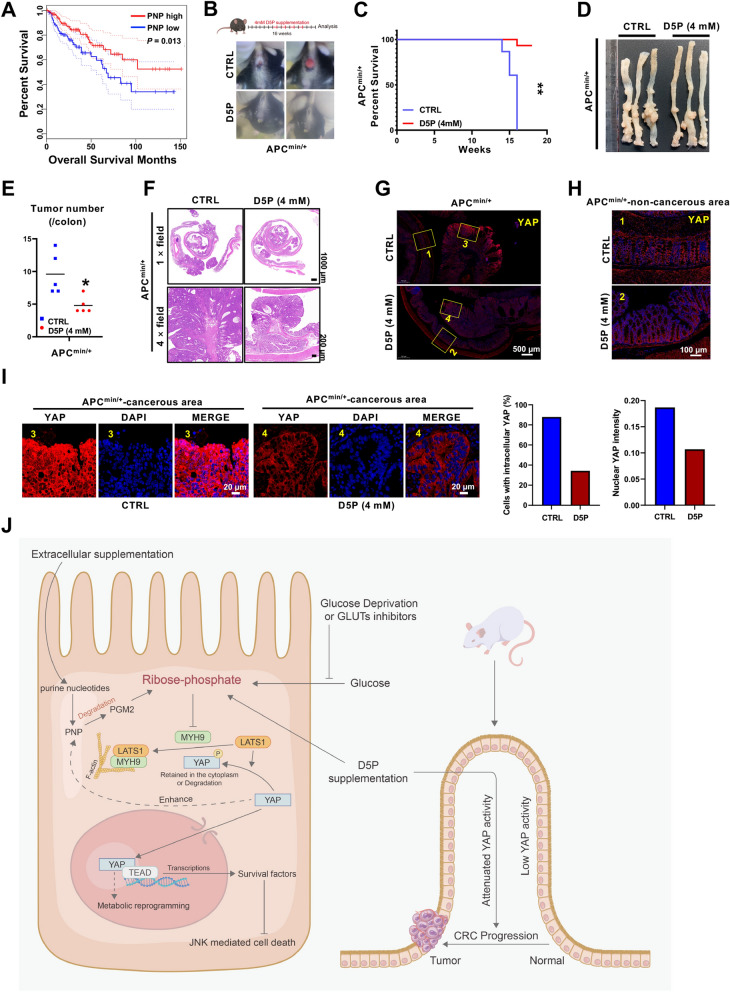
Methods: The level of phosphorylated YAP was analyzed with Western blotting and Phos-tag immunoblotting. Glucose limitation-induced metabolic changes were analyzed using targeted metabolomics (600MRM). The anti-cancer role of metabolite was examined using colony formation assay and APCmin/+ mice. Co-immunoprecipitation, LS-MS, qRT-PCR, and immunofluorescence were performed to explore the underlying mechanisms.

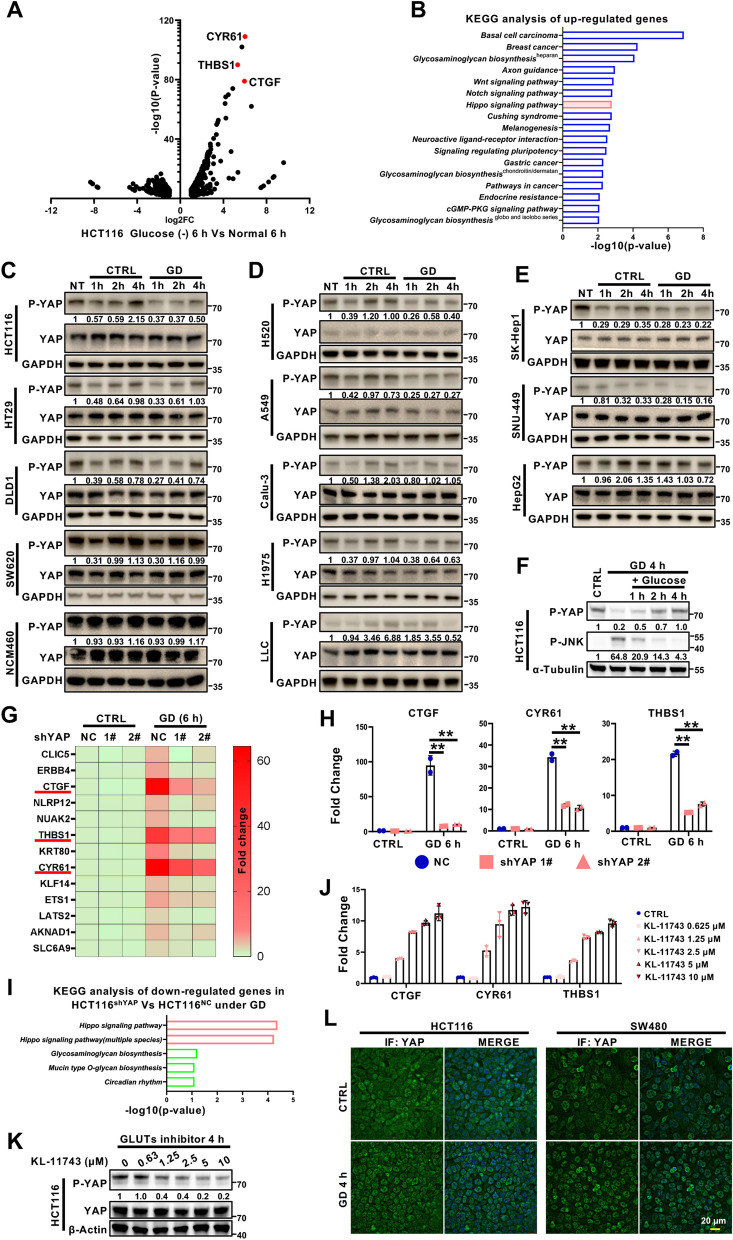
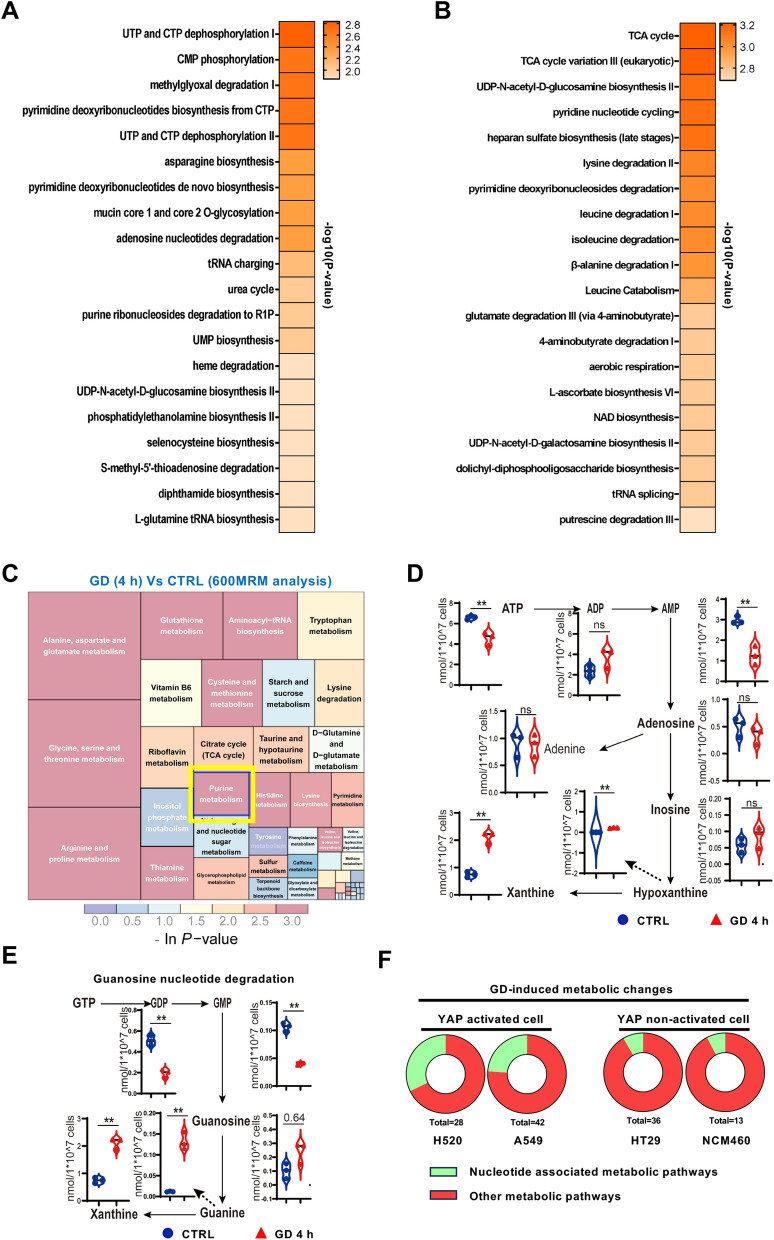
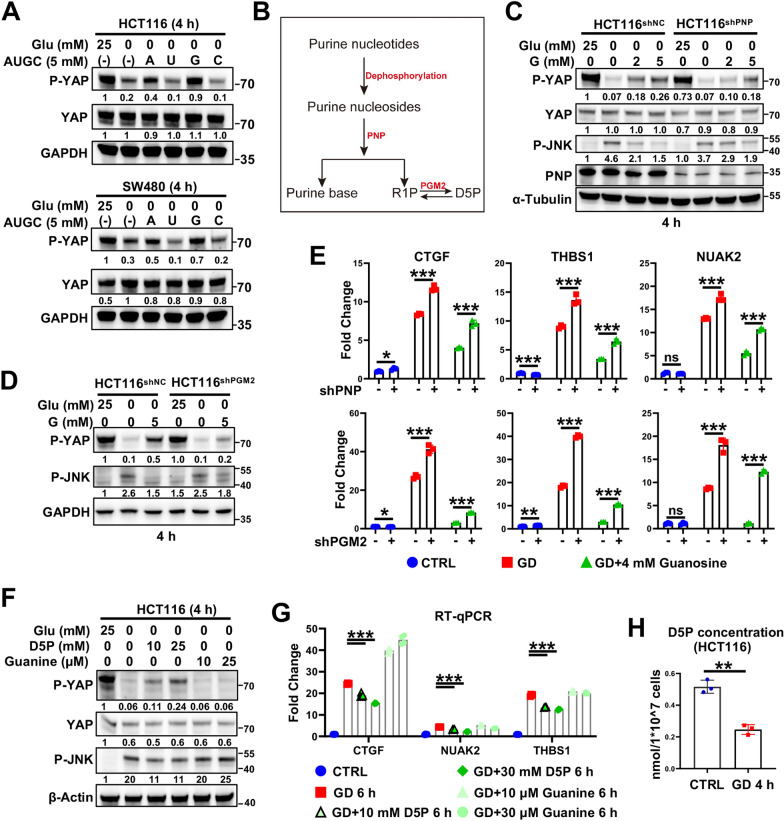
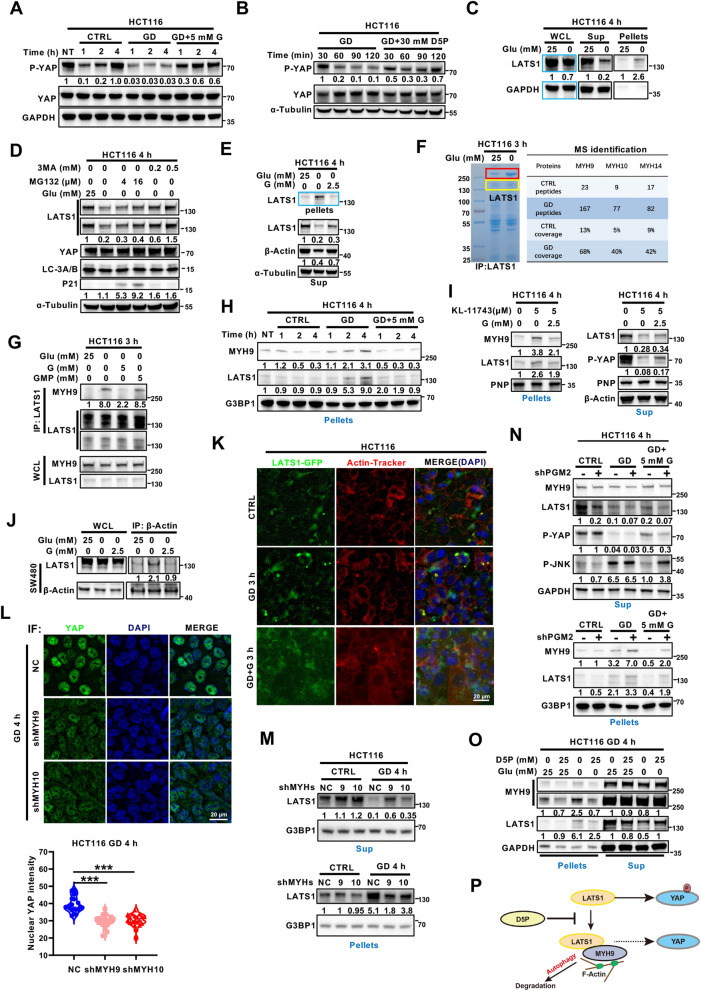
Results: We found that D-Ribose-5-phosphate (D5P), a product of the pentose phosphate pathway connecting glucose metabolism and nucleotide metabolism, functions as a metabolic checkpoint to activate YAP under glucose limitation to promote cancer cell survival. Mechanistically, in glucose-deprived cancer cells, D5P is decreased, which facilitates the interaction between MYH9 and LATS1, resulting in MYH9-mediated LATS1 aggregation, degradation, and further YAP activation. Interestingly, activated YAP further promotes purine nucleoside phosphorylase (PNP)-mediated breakdown of purine nucleoside to restore D5P in a feedback manner. Importantly, D5P synergistically enhances the tumor-suppressive effect of GLUT inhibitors and inhibits cancer progression in mice.

Conclusions: Our study identifies D5P as a metabolic checkpoint linking glucose limitation stress and YAP activation, indicating that D5P may be a potential anti-cancer metabolite by enhancing glucose limitation sensitivity.

Keywords: D-ribose-5-phosphate; Glucose deprivation; LATS1; Metabolic stress; Purine nucleoside phosphorylase; YAP.


Conflict of interest statement

Declarations. Ethics approval and consent to participate: All animal experiments were approved by the Institutional Animal Care and Use Committee of the Zhengzhou University. All animal experiments were performed in compliance with the Guide for the Care and Use of Laboratory Animals (National Academies Press, 2011) and according to the institutional ethical guidelines for animal experiments. Competing interests: The authors declare no competing interests.

Figures

Fig. 1
Fig. 1
Differential responses of YAP activation to glucose deprivation in different cancer cells. A Volcano plot of the genes differentially expressed under glucose deprivation (GD). The target genes of YAP (CTGF, CYR61 and THBS1) were shown in red. B KEGG pathway enrichment analysis of genes upregulated by GD (https://david.ncifcrf.gov/). C–E Immunoblotting analysis of YAP phosphorylation (serine 127) in GD-treated colorectal cancer cells (C), lung cancer cells (D), and hepatocellular carcinoma cells (E). GAPDH was used as a loading control. F Immunoblotting of YAP phosphorylation (serine 127) and JNK phosphorylation (Threonine183/Tyrosine185) in HCT116 cells treated under GD for 4 h, and then treated with glucose for the indicated times. Tubulin was used as a loading control. G RNA-seq analysis of HCT116-shNC and HCT116-shYAP cells treated with or without GD (0 mM, 6 h). H RT‒qPCR analysis of YAP target genes (CTGF, CYR61 and THBS1) in the samples from (G). I KEGG pathway enrichment analysis of genes downregulated by YAP knockdown under GD. J RT‒qPCR analysis of YAP target genes (CTGF, CYR61 and THBS1) in HCT116 cells treated with different doses of GLUT inhibitor KL-11743. K Immunoblotting analysis of YAP phosphorylation (serine 127) in HCT116 cells treated with different doses of GLUT inhibitor KL-11743 for 4 h. Actin was used as a loading control. L Immunofluorescence staining of YAP localization in HCT116 cells or SW480 cells treated with or without GD (0 mM, 4 h). DAPI served as the nuclear stain. The experiments in (C), (D), (E), (F) and (K) were repeated twice independently. In (H) and (J), data are the mean ± S.D.; P values were calculated using a two-tailed unpaired Student’s t-test. **, P < 0.01
Fig. 2
Fig. 2
GD induces purine nucleotide degradation. A Metabolite set enrichment of the polar metabolites from HCT116 cells with GD versus normal culture as determined by untargeted metabolomics analysis (XCMS). B Metabolite set enrichment of the polar metabolites from DLD1 cells with GD versus normal culture as determined by untargeted metabolomics analysis (XCMS). C Metabolic pathway enrichment analysis of changed metabolites from HCT116 cells under GD determined by targeted metabolomics analysis (quantitative 600MRM analysis). Purine metabolism was marked with a yellow box. D Levels of metabolites involved in adenine nucleotide degradation from HCT116 cells under normal conditions or GD (0 mM, 4 h). E Levels of metabolites involved in guanine nucleotide degradation from HCT116 cells under normal conditions or GD (0 mM, 4 h). F Pie chart of nucleotide associated metabolic pathways among GD-induced changed metabolic pathways in YAP activated or YAP non-activated cells. In (D), (E), data are the mean ± S.D.; P values were calculated using a two-tailed unpaired Student’s t-test. *, P < 0.05; **, P < 0.01; ns, no significance
Fig. 3
Fig. 3
GD-induced D5P downregulation is responsible for GD-induced YAP activation. A Immunoblotting analysis of YAP phosphorylation (serine 127) and YAP expression in glucose-deprived HCT116 (upper panel) and SW480 cells (lower panel) with or without supplementation with adenosine (A), uridine (U), guanosine (G), or cytidine (C). GAPDH was used as a loading control. B Schematic diagram of the purine nucleotide degradation pathway. D5P, D-ribose-5-phosphate; R1P, ribose-1-phosphate. C Immunoblotting of YAP phosphorylation (serine 127) and JNK phosphorylation in HCT116 NC and shPNP cells under normal conditions or GD (0 mM, 4 h) treated with or without G supplementation. D Immunoblotting of YAP phosphorylation (serine 127) and JNK phosphorylation (Threonine 183/Tyrosine 185) in HCT116 NC and shPGM2 cells under normal conditions or GD (0 mM, 6 h) treated with or without G supplementation. E RT‒qPCR analysis of YAP target genes (CTGF, THBS1 and NUAK2) in HCT116 NC and shPNP cells (upper panel) or shPGM2 cells (lower panel) under normal conditions or GD (0 mM, 6 h) treated with or without G supplementation. F Immunoblotting of YAP phosphorylation (serine 127) and JNK phosphorylation in HCT116 cells under normal conditions or GD (0 mM, 4 h) treated with or without D5P or guanine supplementation. G RT‒qPCR analysis of YAP target genes (CTGF, NUAK2 and THBS1) in HCT116 cells under normal conditions or GD (0 mM, 6 h) treated with or without D5P/guanine supplementation. H GD reduced D5P levels in HCT116 cells. The experiments in (A), (C), (D), (F) were repeated twice independently. In (E), (G), (H), data are the mean ± S.D.; P values were calculated using a two-tailed unpaired Student’s t-test. *, P < 0.05; **, P < 0.01; ***, P < 0.001
Fig. 4
Fig. 4
GD-induced D5P downregulation increases MYH9/LATS1 aggregation and LATS1 degradation to activate YAP. A, B Immunoblotting analysis of phosphorylated YAP (serine 127) and YAP in HCT116 cells cultured with normal medium, glucose-free medium or glucose-free medium supplemented with G (A) or D5P (B) for the indicated times. GAPDH or α-Tubulin was used as the loading control. C Immunoblotting analysis of LATS1 in the supernatants (Sup) and pellets of the HCT116 cell lysate treated with or without GD (0 mM, 4 h). GAPDH was used as a loading control. D Immunoblotting analysis of LATS1, YAP, LC3A/B and P21 expression in HCT116 cells under normal conditions or GD (0 mM, 4 h) with or without MG132 or 3MA. α-Tubulin was used as a loading control. E Guanosine supplementation diminished GD-induced LATS1 insolubilization. HCT116 cells were cultured with normal medium, glucose-free medium or glucose-free medium supplemented with G for 4 h. Tubulin was used as a loading control. F Coomassie blue staining and MS analysis of GD-induced LATS1-interacting proteins in HCT116 cells. The bands marked in the red boxes (left) were sent for MS analysis. G The effects of GD and G/GMP supplementation on the interaction between MYH9 and LATS1 in HCT116 cells were examined using Co-IP assay. H HCT116 cells were cultured with normal medium (CTRL), glucose-free medium or glucose-free medium supplemented with 5 mM G for indicated time before immunoblotting analysis of MYH9 and LATS1. G3BP1 was used as a loading control for the pellets. I Guanosine supplementation diminished KL-11743-induced LATS1 insolubilization. HCT116 cells were cultured under normal conditions, treated with or without KL-11743, or KL-11743 plus G supplementation for 4 h. PNP or actin was used as a loading control. J Immunoblotting analysis of the recruitment of LATS1 to actin in SW480 cells under normal conditions, GD (0 mM) or GD supplemented with G. K Representative fluorescence images of LATS1 aggregation and F-actin in LATS1-GFP overexpressing HCT116 cells under normal conditions, GD (0 mM) or GD supplemented with G for 3 h. DAPI served as the nuclear stain. L Representative immunofluorescence images and quantitative analysis of YAP nuclear localization in HCT116 NC, shMYH9 and shMYH10 cells treated with GD (0 mM) for 4 h. DAPI served as the nuclear stain. M Immunoblotting analysis of LATS1 in the supernatants (Sup) and pellets of HCT116 NC, shMYH9, and shMYH10 cells under normal conditions or GD (4 h). G3BP1 was used as a loading control. N Immunoblotting analysis of MYH9, LATS1, phosphorylated YAP (serine 127) and phosphorylated JNK in the supernatants (Sup) and pellets of HCT116 NC and shPGM2 cells treated under normal conditions, GD (4 h) or GD supplemented with G (4 h). GAPDH was used as a loading control. O Immunoblotting analysis of LATS1 and YAP in the supernatants (Sup) and pellets of HCT116 cells treated under normal conditions, GD (0 mM, 4 h) or GD supplemented with D5P. GAPDH was used as a loading control. P Schematic diagram depicting that D5P disrupts the interaction between LATS1 and MYH9/F-actin and recovers the inhibition of LATS1 on YAP. The experiments in (A–E), (G–J), and (M–O) were repeated twice independently. In (L), data are the mean ± S.D.; P values were calculated using a two-tailed unpaired Student’s t-test. ***, P < 0.001
Fig. 5
Fig. 5
Dysregulation of YAP activity reprograms purine nucleotide metabolism and cellular response to GD. A Set enrichment of polar metabolites from HCT116-shYAP and HCT116-NC cells as determined by 600MRM analysis. B Relative levels of metabolites involved in glucose metabolism in HCT116-NC and HCT116-shYAP cells. C Relative levels of metabolites involved in purine (adenine and guanine) nucleotide metabolism in HCT116-NC and HCT116-shYAP cells. D Relative levels of metabolites involved in purine (adenine and guanine) nucleotide metabolism in HCT116-EV- and HCT116-YAP-5SA-overexpressing cells. E Cluster analysis of polar metabolites of HCT116-NC and HCT116-shYAP cells under normal culture or GD conditions (0 mM, 6 h). F Analysis of PNP enzyme activity in HCT116-NC and HCT116-shYAP cells treated under GD. G Analysis of PNP enzyme activity in HCT116 cells treated under GD with or without D5P supplementation. H Schematic diagram depicting that GD-induced D5P downregulation triggers YAP activation, promoting PNP activity to recover D5P level. I Immunoblotting analysis of LATS1, YAP and phosphorylated JNK in the supernatants (Sup) or LATS1 in the pellets of HCT116-NC and HCT116-shYAP cells under the indicated treatment. G3BP1 was used as a loading control. J Immunoblotting analysis of LATS1, YAP and phosphorylated JNK in the supernatants of HCT116-EV- and YAP-5SA-overexpressing cells with the indicated treatment. Tubulin was used as a loading control. The experiments in (I), (J) were repeated twice independently. In (BD) and (FG), data are the mean ± S.D.; P values were calculated using a two-tailed unpaired Student’s t-test. *, P < 0.05; **, P < 0.01; ***, P < 0.001; ns, no significance
Fig. 6
Fig. 6
D5P sensitizes cancer cells to GLUT inhibitor by suppressing YAP. A RT‒qPCR of JNK downstream genes (JUN and GADD45A) in HCT116 cells treated under normal conditions, GD or GD supplemented with D5P. B Immunoblotting analysis of phosphorylated YAP (serine 127) and phosphorylated JNK in HCT116 NC and shPGM2 cells treated under normal conditions, GD (4 h) or GD supplemented with D5P or G (4 h). C Schematic diagram of signaling pathways stimulated by GD or GLUT inhibitor treatment. D Immunoblotting analysis of PARP, cleaved PARP (c-PARP) and phosphorylated JNK in HCT116 cells treated under normal conditions or GD with or without D5P supplementation (12 h). Actin was used as a loading control. E Immunoblotting analysis of cleaved PARP (c-PARP), phosphorylated YAP (serine 127), and phosphorylated JNK in HCT116 cells treated with GLUT inhibitor (KL-11743) supplemented with or without D5P (24 h). Actin was used as a loading control. F, G Representative images (F) and quantitative results (G) of soft agar colony formation assays in HCT116 cells treated with KL-11743 supplemented with or without D5P (48 h). H Cell growth curves of HCT116 cells treated with KL-11743, D5P, or both. I, J Representative images (I) and quantitative results (J) of organoid cultures treated with KL-11743 supplemented with or without D5P (60 h). K Immunoblotting analysis of PARP, cleaved PARP (c-PARP) and PNP in HCT116 NC and shPNP cells treated under normal conditions, GD or GD supplemented with D5P (8 h). Actin was used as a loading control. In (A), (G), (H), data are the mean ± S.D.; P values were calculated using Dunnett’s multiple comparison test or Student’s t-test. *, P < 0.05; **, P < 0.01; ***, P < 0.001; ns, no significance
Fig. 7
Fig. 7
Oral administration of D5P attenuates CRC development in APC mutant mice. A Kaplan–Meier survival analysis of colon adenocarcinoma patients stratified by PNP expression. Data from GEPIA database. B Rectal prolapse observation showing that the onset of CRC in APCmin/+ mice treated with D5P was delayed. C Survival probability analysis of APCmin/+ mice treated with or without D5P (4 mM) in drinking water. D Representative colon images of the APCmin/+ mice treated with or without D5P (4 mM). E The quantification of tumor number presented in (D). Colon tumor number of APCmin/+ mice treated with or without D5P (4 mM). F Representative H&E staining of colon tumor from mice treated with or without D5P (4 mM). G Large field view of YAP staining in colon sections of mice treated with or without D5P (4 mM). The numeric labeled regions were zoom in and showed in (H) and (I). H A representative image of non-cancerous area in (G). YAP staining of the non-cancerous area of colon from mice treated with or without D5P (4 mM). I A representative image of cancerous area in (G) and quantitative results of YAP staining in the cancerous area of colon from mice treated with or without D5P (4 mM). J Schematic diagram showing the anti-cancer function of D5P via the MYH9/LATS1-YAP-PNP-D5P negative feedback loop. *, P < 0.05; **, P < 0.01

Similar articles

References

    1. Ohshima K, Morii E. Metabolic reprogramming of cancer cells during tumor progression and metastasis. Metabolites. 2021;11(1):28. - PMC - PubMed
    1. Ward PS, Thompson CB. Metabolic reprogramming: a cancer hallmark even Warburg did not anticipate. Cancer Cell. 2012;21(3):297–308. - PMC - PubMed
    1. Sokolov D, Sullivan LB. A metabolic signaling role for arginine in liver cancer. Life Metab. 2023; 3(1): load046. - PMC - PubMed
    1. Chen X, Zhao Y, He C, Gao G, Li J, Qiu L, et al. Identification of a novel GLUT1 inhibitor with in vitro and in vivo anti-tumor activity. Int J Biol Macromol. 2022;216:768–78. - PubMed
    1. Katt WP, Lukey MJ, Cerione RA. Starving the devourer: cutting cancer off from its favorite foods. Cell Chem Biol. 2019;26(9):1197–9. - PubMed

MeSH terms

LinkOut - more resources