. 2025 Jan 4;22(1):2.
doi: 10.1186/s12974-024-03331-0.

Therapeutic reduction of neurocan in murine intracerebral hemorrhage lesions promotes oligodendrogenesis and functional recovery

Affiliations

Therapeutic reduction of neurocan in murine intracerebral hemorrhage lesions promotes oligodendrogenesis and functional recovery

Hongmin Li et al. J Neuroinflammation. .

Abstract

Background: Intracerebral hemorrhage (ICH) causes prominent deposition of extracellular matrix molecules, particularly the chondroitin sulphate proteoglycan (CSPG) member neurocan. In tissue culture, neurocan impedes the properties of oligodendrocytes. Whether therapeutic reduction of neurocan promotes oligodendrogenesis and functional recovery in ICH is unknown.

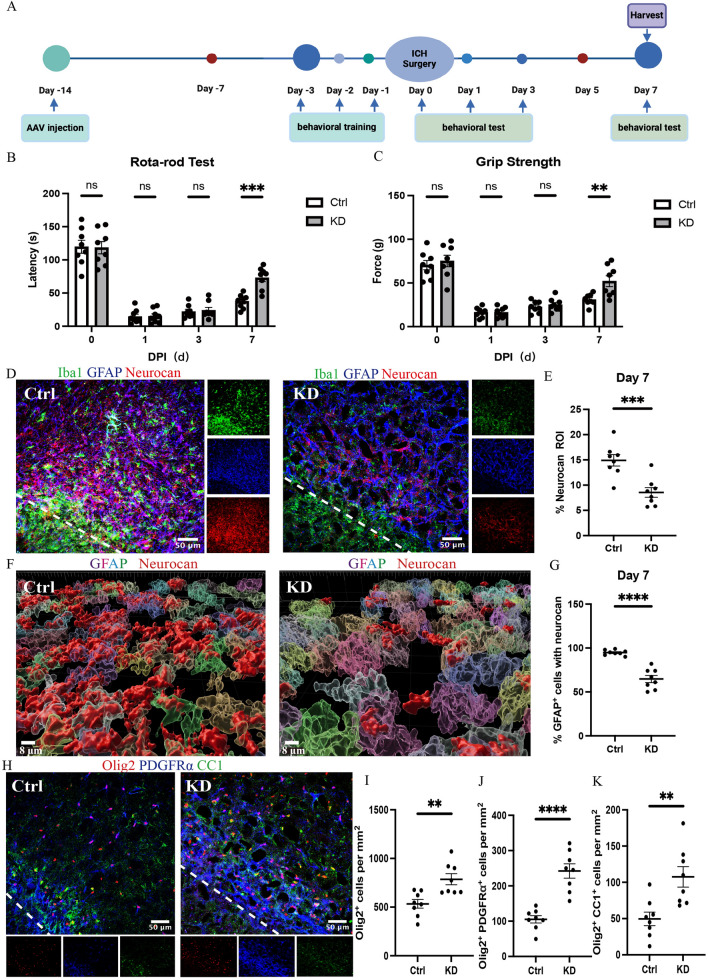
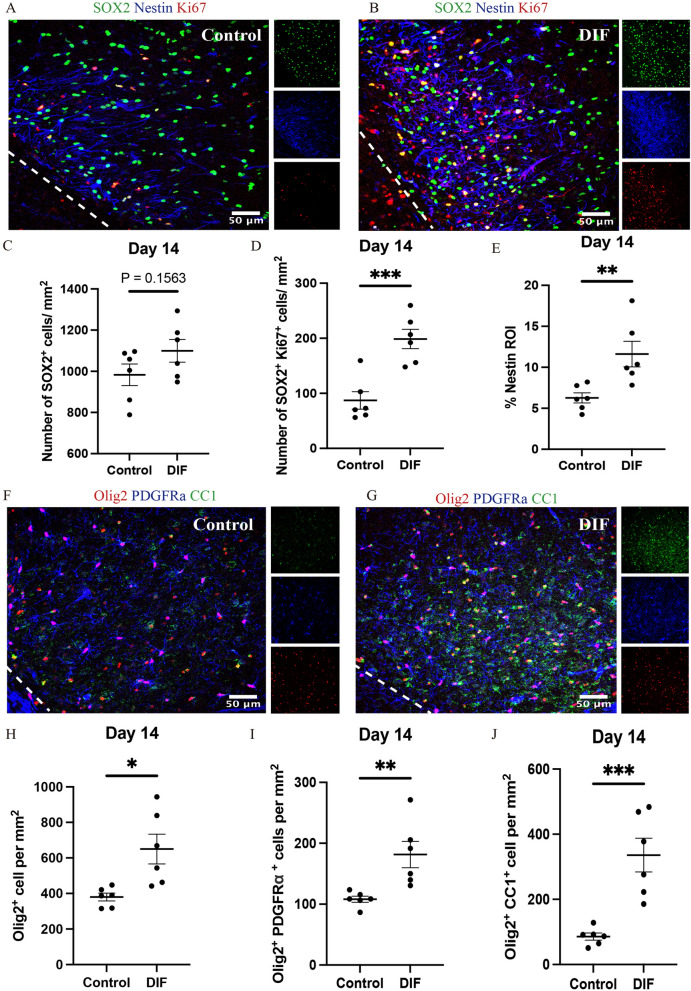
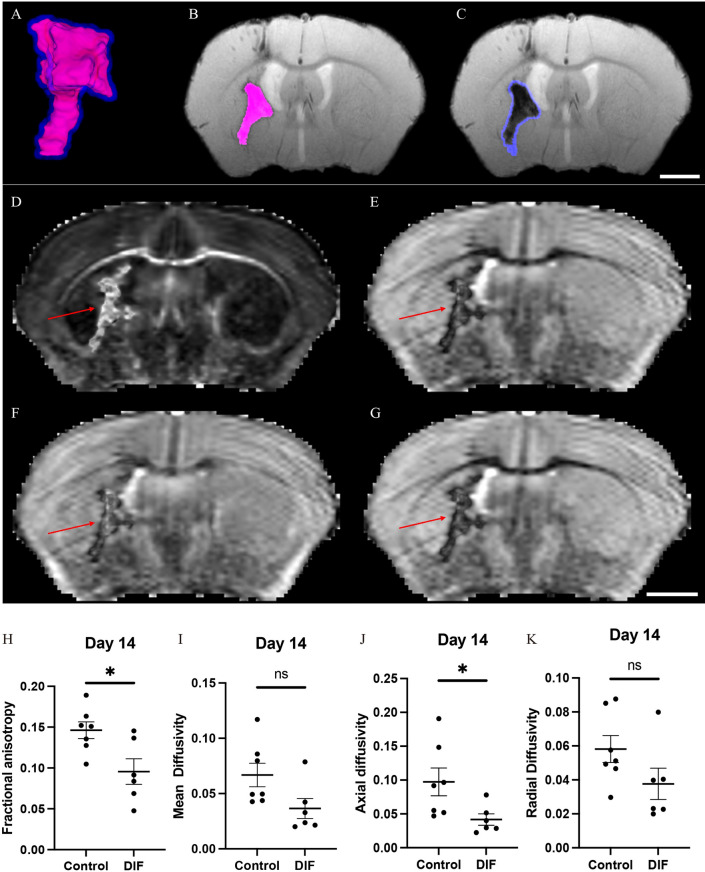
Methods: Mice were retro-orbitally injected with adeno-associated virus (AAV-CRISPR/Cas9) to reduce neurocan deposition after ICH induction by collagenase. Other groups of ICH mice were treated with vehicle or a drug that reduces CSPG synthesis, 4-4-difluoro-N-acetylglucosamine (difluorosamine). Rota-rod and grip strength behavioral tests were conducted over 7 or 14 days. Brain tissues were investigated for expression of neurocan by immunofluorescence microscopy and western blot analysis. Brain cryosections were also stained for microglia/macrophage phenotype, oligodendrocyte lineage cells and neuroblasts by immunofluorescence microscopy. Tissue structural changes were assessed using brain magnetic resonance imaging (MRI).

Results: The adeno-associated virus (AAV)-reduction of neurocan increased oligodendrocyte numbers and functional recovery in ICH. The small molecule inhibitor of CSPG synthesis, difluorosamine, lowered neurocan levels in lesions and elevated numbers of oligodendrocyte precursor cells, mature oligodendrocytes, and SOX2+ nestin+ neuroblasts in the perihematomal area. Difluorosamine shifted the degeneration-associated functional state of microglia/macrophages in ICH towards a regulatory phenotype. MRI analyses showed better fiber tract integrity in the penumbra of difluorosamine mice. These beneficial difluorosamine results were achieved with delayed (2 or 3 days) treatment after ICH.

Conclusion: Reducing neurocan deposition following ICH injury is a therapeutic approach to promote histological and behavioral recovery from the devastating stroke.

Keywords: Chondroitin sulphate proteoglycans; Extracellular matrix; Functional recovery; Intracerebral hemorrhage; Neurocan; Oligodendrogenesis.


Conflict of interest statement

Declarations. Ethics approval and consent to participate: All animal experiments were performed with ethics approval (protocol number AC21-0073) from the Animal Care Committee at the University of Calgary under regulations of the Canadian Council of Animal Care. Consent for publication: Not applicable. Competing interests: PZ, CCL and VWY are co-inventors in a US Provisional Patent application (US 63/720,938) titled: Fluorinated glucosamine analogs to reduce injury and promote recovery in neurological disorders.

Figures

Fig. 1
Fig. 1
AAV-mediated reduction of neurocan improves oligodendrogenesis and functional recovery in ICH mice. A The paradigm of AAV injection and subsequent experimental protocol. B, C Graphs comparing the latency of rota-rod test (B) or forelimb force of grip strength test (C) between control (Ctrl) and knockdown (KD) groups. D Representative confocal images from 7-day Ctrl (left) and KD (right) mice in perihematomal area, where the lower left corner inside the dotted lines in D is the lesion core. Scale bar = 50 μm. E Quantifications for neurocan percent area of the lesion region of interest (ROI), where each ROI is a region defined by area occupied by Iba1+ cells (n = 8 mice). F Representative 3D reconstruction images of perihematomal area at day 7 in Ctrl (left) and KD (right) mice, and internal accumulation of neurocan (red) within individually labelled GFAP+ cells. Scale bar = 8 μm. G Quantification showing the percentage of GFAP+ cells containing neurocan molecules. H Representative confocal images of day 7 perihematomal areas. Scale bar = 50 μm. IK Number of Olig2+ cells (I), OPCs (olig2+ PDGFRα+) (J) or mature oligodendrocytes (K) per mm2 of lesion ROI (mean ± SEM of 8 mice). Each dot represents mean of 4 locations per mouse. There were 8 mice per group, and this experiment was completed in one series. Unpaired two-tailed Student’s t-test; ns: not significant. **p < 0.01, ***p < 0.001, ****p < 0.0001
Fig. 2
Fig. 2
Daily difluorosamine treatment for 5 days reduces neurocan and promotes functional recovery in ICH. A Chemical structure of difluorosamine. B Experimental paradigm. C, D Graphs comparing the latency of rota-rod (C) or forelimb force of grip strength (D) tests between control and DIF mice; each black circle is a different mouse across 3 separate experiments (n of 6, 6 or 8 in each of the experiment per group; N = 20 total). E Representative confocal images of perihematomal area (left) and lesion core (right) at day 7 in control and DIF mice stained for neurocan (red), Iba1(green), GFAP (blue). The lower left corner inside the dotted lines is the lesion core. Scale bar = 50 μm. F Bar graphs comparing the levels of neurocan in perihematomal area, lesion core and contralateral area at day 7 (N = 6). Data are mean ± SEM and analyzed by two-way ANOVA-Tukey’s post hoc test. Western blot analysis (N of 4) of neurocan (G) and quantification (H) comparing the signal ratio of neurocan to β-actin among sham, control, and DIF mice; mean ± SEM, one-way ANOVA-Tukey’s post hoc test; ns: not significant. Significance indicated as **p < 0.01, ***p < 0.001
Fig. 3
Fig. 3
Difluorosamine reduces neurocan within microglia/macrophages and shifts their functional state towards a regulatory phenotype. A Representative confocal images of perihematomal area at day 7 in control (left) and DIF (right) mice stained for DAPI for cell nuclei (blue) and Iba1 (green). Scale bar = 50 μm. B Quantification comparing the number of Iba1+ cells per mm2 of lesion ROI between control and DIF mice. C Representative 3D reconstruction images of perihematomal area at day 7 in control (left) and DIF (right) mice using Imaris rendition, and internal accumulation of neurocan within Iba1+ cells. Scale bar = 5 μm. D Bar graphs comparing the percentage of Iba1+ cells containing neurocan molecules between control and DIF mice. E, G, I Representative confocal images of perihematomal area at day 7 in control (left) and DIF (right) mice stained for the indicated markers. Scale bar = 25 μm or 50 μm. (F, H, J) Quantification showing the percentage of IL-1β (F), Clec7a (H), Arg1 (J) in lesion ROI between control and DIF mice. Data are presented as the mean ± SEM of 6 mice. Each dot represents mean of 4 locations per mouse. Unpaired two-tailed Student’s t-test; ns: not significant. *p < 0.05, **p < 0.01
Fig. 4
Fig. 4
Difluorosamine improves neurogenesis and oligodendrogenesis over 7 days of ICH. A, B Representative confocal images of day 7 perihematomal areas labelled with SOX2 (green), Ki67 (red), nestin (blue) in control (A) and DIF (B) mice. CE Bar graphs comparing number of SOX2+ cells (C), SOX2+ Ki67+ (D), the percentage of nestin + cells in lesion ROI (E). F, G Representative confocal images of day 7 perihematomal areas labelled with Olig2 (red), PDGFRα (blue), CC1 (green) in control (F) and DIF (G) mice. The lower left corner inside the dotted lines is the lesion core. Scale bar = 50 μm. HJ Quantifications comparing number of Olig2+ cells (H), OPCs (I) or mature oligodendrocytes (J) per mm2 of lesion ROI between control and DIF mice. Data are presented as the mean ± SEM of 6 mice. Each dot represents mean of 4 locations analyzed per mouse. Unpaired two-tailed Student’s t-test; Significance indicated as *p < 0.05, **p < 0.01, ***p < 0.001
Fig. 5
Fig. 5
Alternate day difluorosamine treatment after ICH promotes functional recovery, reduces neurocan expression and shifts the functional state of microglia/macrophages towards homeostasis over 14 days. A Treatment paradigm of difluorosamine in ICH: 14-day experiment. B, C Bar graphs comparing the latency of rota-rod test (B) or forelimb force of grip strength test (C) between control and DIF mice. D, E Representative confocal images of perihematomal area at day 14 in control (D) and DIF (E) mice stained for neurocan (red), Iba1 (green), GFAP (blue). Scale bar = 50 μm. F Bar graphs comparing neurocan percent area of the lesion region of interest (ROI). GI Quantification showing the percentage of IL-1β (G), Clec7a (H), Arg1 (I) in lesion ROI between control and DIF mice. Data are presented as the mean ± SEM of 6 mice. Unpaired two-tailed Student’s t-test; Significance indicated as *p < 0.05, **p < 0.01, ***p < 0.001
Fig. 6
Fig. 6
Difluorosamine improves neurogenesis and oligodendrogenesis over 14 days of ICH. A, B Representative confocal images of day 14 perihematomal areas labelled with SOX2 (green), Ki67 (red), nestin (blue) in control (A) and DIF (B) mice. CE Bar graphs comparing number of SOX2+ cells (C), SOX2+ Ki67+ (D), the percentage of nestin + cells in lesion ROI (E). F, G Representative confocal images of day 14 perihematomal areas labelled with Olig2 (red), PDGFRα (blue), CC1 (green) in control (F) and DIF (G) mice. The lower left corner inside the dotted lines is the lesion core. Scale bar = 50 μm. HJ Quantifications comparing number of Olig2+ cells (H), OPCs (I) or mature oligodendrocytes (J) per mm2 of lesion ROI between control and DIF mice. Data are presented as the mean ± SEM of 6 mice. Each dot represents mean of 4 locations analyzed per mouse. Unpaired two-tailed Student’s t-test; ns: not significant. Significance indicated as *p < 0.05, **p < 0.01, ***p < 0.001
Fig. 7
Fig. 7
MRI shows that difluorosamine alleviates brain tissue loss over 14 days of ICH. A A 3D representative of segmented perihematomal area and lesion core. B, C Representative segmented lesion core (B) and perihematomal area (blue) (C) of FLASH sequences at day 14 after ICH. Scale bar = 3 mm. DG Representative images of fractional anisotropy (D), mean diffusivity (E), axial diffusivity (F) and radial diffusivity (G) from mice at day 14 after injury. Scale bar = 3 mm. HK Bar graphs comparing data from DTI of the perihematomal area between control and DIF mice: fractional anisotropy (H), mean diffusivity (I), axial diffusivity (J) and radial diffusivity (K). N = 7 in control group and n = 6 in DIF group. Data are presented as the mean ± SEM. Unpaired two-tailed Student’s t-test; ns: not significant. Significance indicated as *p < 0.05

References

    1. Puy L, Parry-Jones AR, Sandset EC, Dowlatshahi D, Ziai W, Cordonnier C. Intracerebral haemorrhage. Nat Rev Dis Primers. 2023;9(1):14. - PubMed
    1. Qureshi AI, Mendelow AD, Hanley DF. Intracerebral haemorrhage. Lancet. 2009;373(9675):1632–44. - PMC - PubMed
    1. Sheth KN. Spontaneous intracerebral hemorrhage. N Engl J Med. 2022;387(17):1589–96. - PubMed
    1. Xue M, Yong VW. Neuroinflammation in intracerebral haemorrhage: immunotherapies with potential for translation. Lancet Neurol. 2020;19(12):1023–32. - PubMed
    1. Fu X, Zhou G, Zhuang J, Xu C, Zhou H, Peng Y, et al. White matter injury after intracerebral hemorrhage. Front Neurol. 2021;12: 562090. - PMC - PubMed

LinkOut - more resources