

Analysis of full length transcriptome and resistance characteristics of Atraphaxis bracteata under drought
- PMID: 39755718
- PMCID: PMC11700114
- DOI: 10.1038/s41598-024-80831-2
Analysis of full length transcriptome and resistance characteristics of Atraphaxis bracteata under drought
Abstract
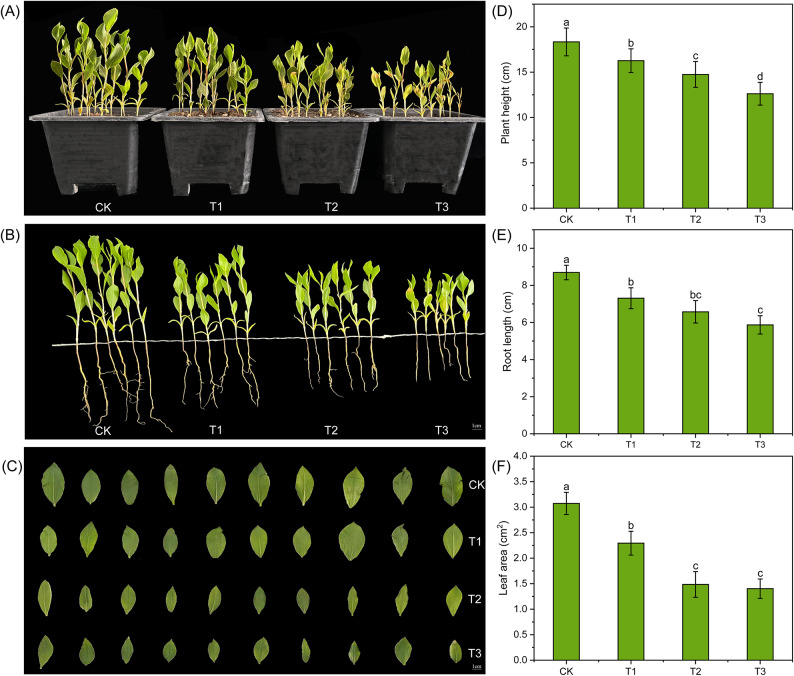
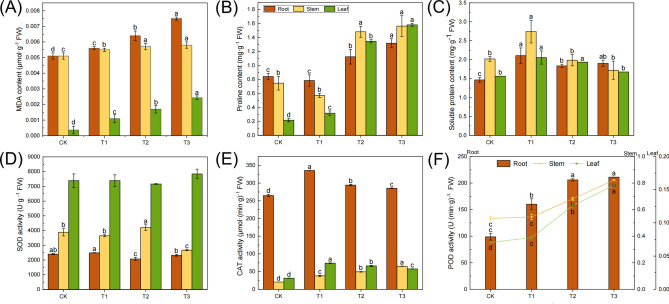
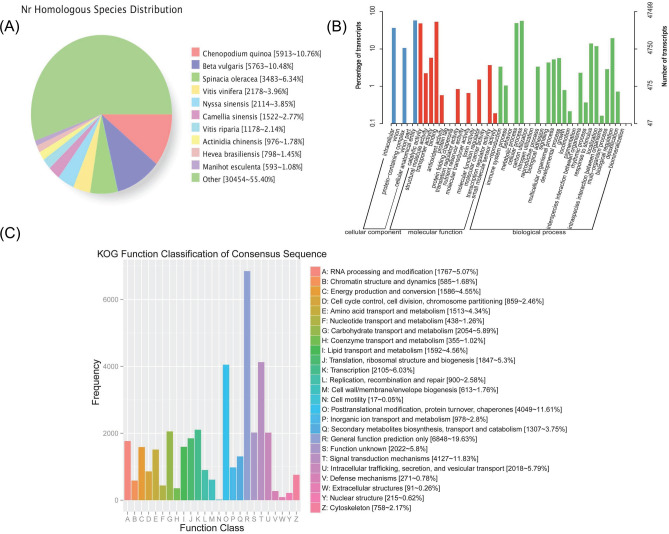
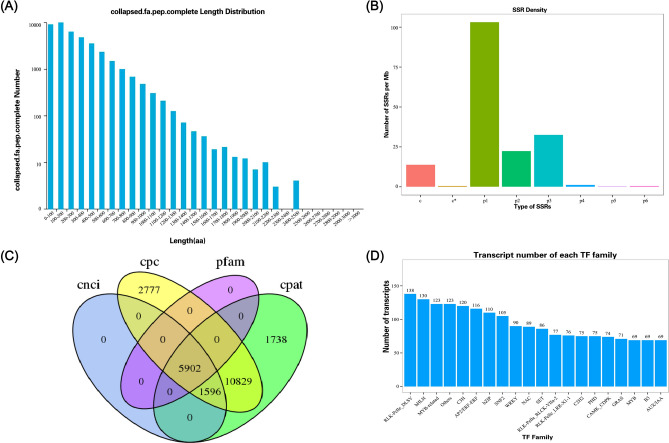
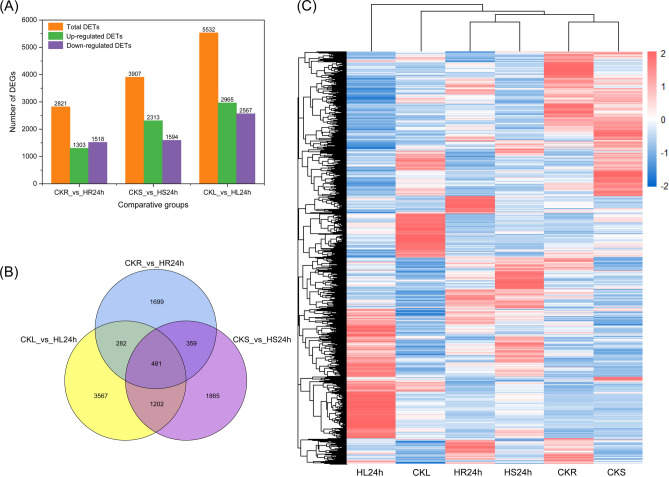
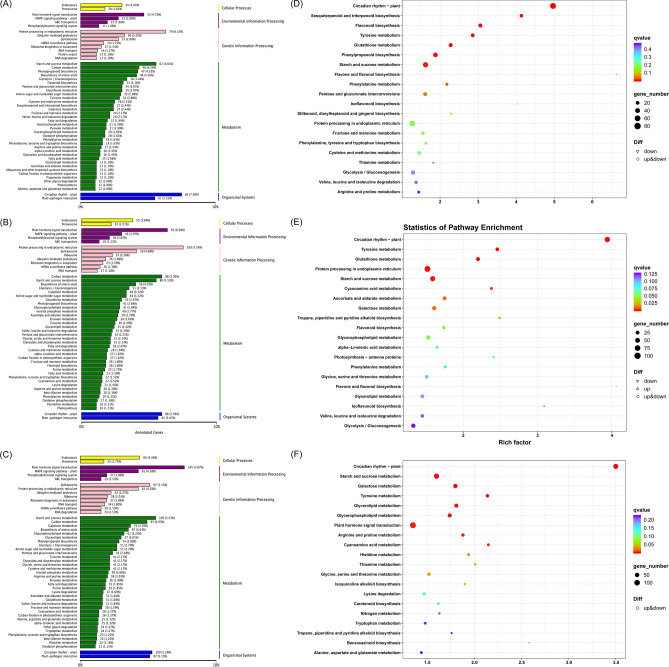
Drought is one of the main environmental factors affecting plant survival and growth. Atraphaxis bracteata is a common desert plant mainly utilized in afforestation and desertification control. This study analyzed the morphological, physiological and molecular regulatory characteristics of different organs of A. bracteata under drought stress. The results showed that with the intensification of drought stress, the height, root length and leaf area of A. bracteata seedlings decreased, while the content of osmotic substances and antioxidant enzyme activity increased. Furthermore, a total of 63 907 non-redundant transcript sequences, of which 55 574 transcripts were annotated, 248 178 FLNC sequences, 107 112 high-quality consistent sequences and 291 314 CCSs were obtained from Iso-Seq. Meanwhile, a total of 2 039 AS events, 22 919 SSR, 40 404 CDS and 5 902 lncRNA were also obtained. The RNA-Seq analysis results revealed that a total of 2 821, 3 907 and 5 532 DETs were identified from roots, stems and leaves, respectively, and which had significantly enrichment in "circadian rhythm-plant" and "starch and sucrose metabolism" pathway. These results would be great significance for further research on the stress resistance of A. bracteata and these DETs function.
Keywords: Atraphaxis bracteata; Circadian rhythm-plant; Differentially expressed transcript; Drought stress; Full-length transcripts.
© 2025. The Author(s).
Conflict of interest statement
Declarations. Competing interests: The authors declare no competing interests.
Figures
Similar articles
-
Comparative RNA-seq analysis of the drought-sensitive lentil (Lens culinaris) root and leaf under short- and long-term water deficits.Funct Integr Genomics. 2019 Sep;19(5):715-727. doi: 10.1007/s10142-019-00675-2. Epub 2019 Apr 18. Funct Integr Genomics. 2019. PMID: 31001704
-
Transcriptome Analysis Reveals Genes and Pathways Associated with Drought Tolerance of Early Stages in Sweet Potato (Ipomoea batatas (L.) Lam.).Genes (Basel). 2024 Jul 19;15(7):948. doi: 10.3390/genes15070948. Genes (Basel). 2024. PMID: 39062727 Free PMC article.
-
Coordinated mechanisms of leaves and roots in response to drought stress underlying full-length transcriptome profiling in Vicia sativa L.BMC Plant Biol. 2020 Apr 15;20(1):165. doi: 10.1186/s12870-020-02358-8. BMC Plant Biol. 2020. PMID: 32293274 Free PMC article.
-
Physiological and transcriptome analyses reveal tissue-specific responses of Leucaena plants to drought stress.Plant Physiol Biochem. 2024 Sep;214:108926. doi: 10.1016/j.plaphy.2024.108926. Epub 2024 Jul 9. Plant Physiol Biochem. 2024. PMID: 38996715
-
Transcriptome analysis of antioxidant system response in Styrax tonkinensis seedlings under flood-drought abrupt alternation.BMC Plant Biol. 2024 May 17;24(1):413. doi: 10.1186/s12870-024-05130-4. BMC Plant Biol. 2024. PMID: 38760721 Free PMC article.
References
-
- He, C. Y., Zhang, G. Y., Zhang, J. G., Duan, A. G. & Luo, H. M. Physiological, biochemical, and proteome profiling reveals key pathways underlying the drought stress responses of Hippophae rhamnoides. Proteomics.16(20), 2688–2697. 10.1002/pmic.201600160 (2016). - PubMed
-
- Lei, Y., Yin, C. & Li, C. Differences in some morphological, physiological, and biochemical responses to drought stress in two contrasting populations of Populus przewalskii. Physiol. Plant.127(2), 182–191. 10.1111/j.1399-3054.2006.00638.x (2010).
-
- Hõrak, H. Learning from the experts: drought resistance in desert plants. New Phytol.216(1), 5–7. 10.1111/nph.14753 (2017). - PubMed
Publication types
MeSH terms
Grants and funding
- 21JR7RH893/Natural Science Foundation of Gansu Province
- 24YFFH002/Gansu Province Key Research and Development Programme
- 22YF7FA117/Gansu Province Key Research and Development Programme
- 23YFFA0065/Gansu Province Key Research and Development Programme
- 2022kj013/Plan Project of Gansu Forestry Science and Technology
LinkOut - more resources
Full Text Sources
Research Materials
