

Development and validation of a new nomogram for self-reported OA based on machine learning: a cross-sectional study
- PMID: 39755736
- PMCID: PMC11700110
- DOI: 10.1038/s41598-024-83524-y
Development and validation of a new nomogram for self-reported OA based on machine learning: a cross-sectional study
Abstract
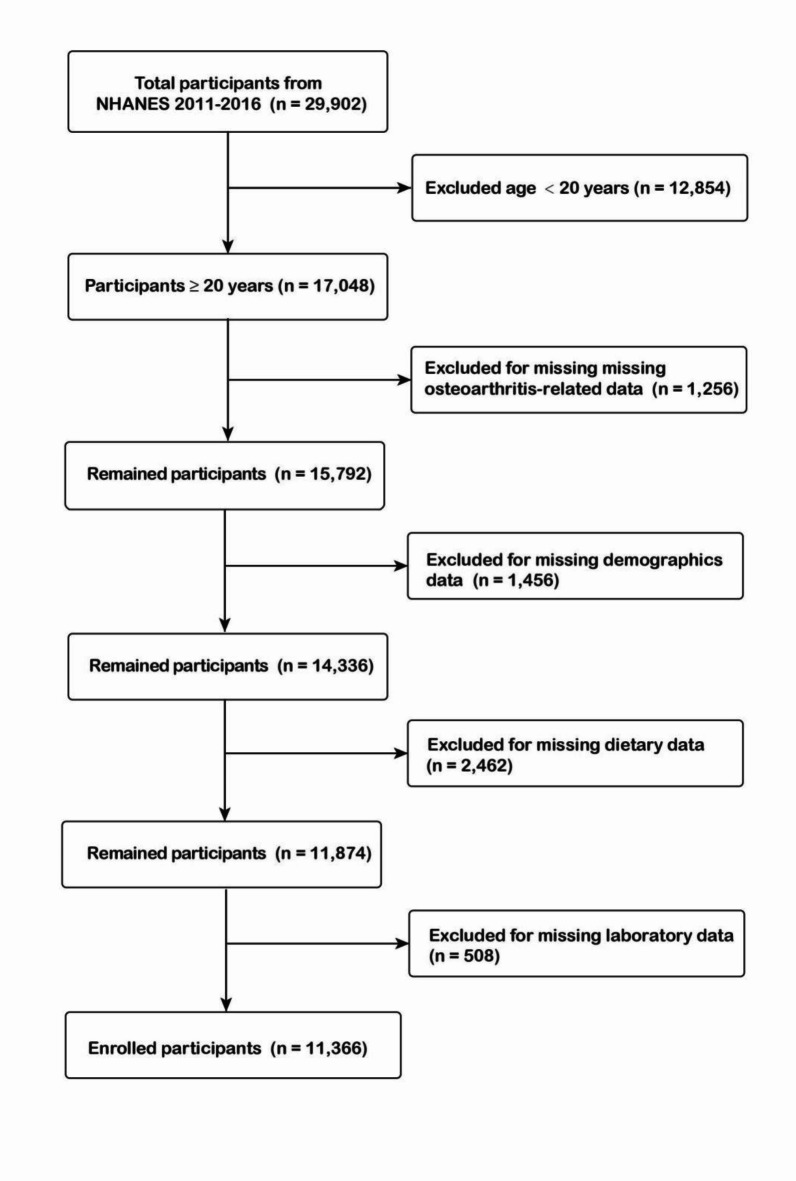
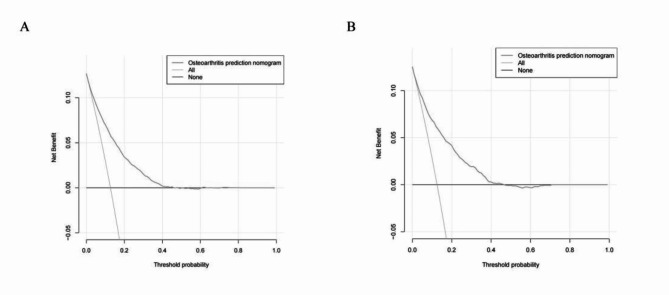
Developing a new diagnostic prediction model for osteoarthritis (OA) to assess the likelihood of individuals developing OA is crucial for the timely identification of potential populations of OA. This allows for further diagnosis and intervention, which is significant for improving patient prognosis. Based on the NHANES for the periods of 2011-2012, 2013-2014, and 2015-2016, the study involved 11,366 participants, of whom 1,434 reported a diagnosis of OA. LASSO regression, XGBoost algorithm, and RF algorithm were used to identify significant indicators, and a OA prediction nomogram was developed. The nomogram was evaluated by measuring the AUC, calibration curve, and DCA curve of training and validation sets. In this study, we identified 5 predictors from 19 variables, including age, gender, hypertension, BMI and caffeine intake, and developed an OA nomogram. In both the training and validation cohorts, the OA nomogram exhibited good diagnostic predictive performance (with AUCs of 0.804 and 0.814, respectively), good consistency and stability in calibration curve and high net benefit in DCA. The nomogram based on 5 variables demonstrates a high accuracy in predicting the diagnosis of OA, indicating that it is a convenient tool for clinicians to identify potential populations of OA.
Keywords: Machine learning; NHANES; Nomogram; Osteoarthritis.
© 2025. The Author(s).
Conflict of interest statement
Declarations. Ethics approval and consent to participate: The NHANES survey protocol was approved by the NCHS Research Ethics Review Committee (Protocol #2011-17), and all study participants provided informed written consent. All studies were conducted in accordance with the Declaration of Helsinki and the Transparent Reporting of a Multivariable Prediction Model for Individual Prognosis or Diagnosis (TRIPOD) checklist for evaluation.
Figures


References
-
- Yue, L. & Berman, J. What Is Osteoarthritis? JAMA327(13):1300. (2022). - PubMed
-
- Disease, G. B. D., Injury, I. & Prevalence, C. Global, regional, and national incidence, prevalence, and years lived with disability for 354 diseases and injuries for 195 countries and territories, 1990–2017: A systematic analysis for the global burden of Disease Study 2017. Lancet392 (10159), 1789–1858 (2018). - DOI - PMC - PubMed
Publication types
MeSH terms
Grants and funding
LinkOut - more resources
Full Text Sources
Medical
