. 2025 Jan 4;16(1):6.
doi: 10.1007/s12672-025-01745-7.

Identification of fatty acid anabolism patterns to predict prognosis and immunotherapy response in gastric cancer

Affiliations

Identification of fatty acid anabolism patterns to predict prognosis and immunotherapy response in gastric cancer

Weijie Sun et al. Discov Oncol. .

Abstract

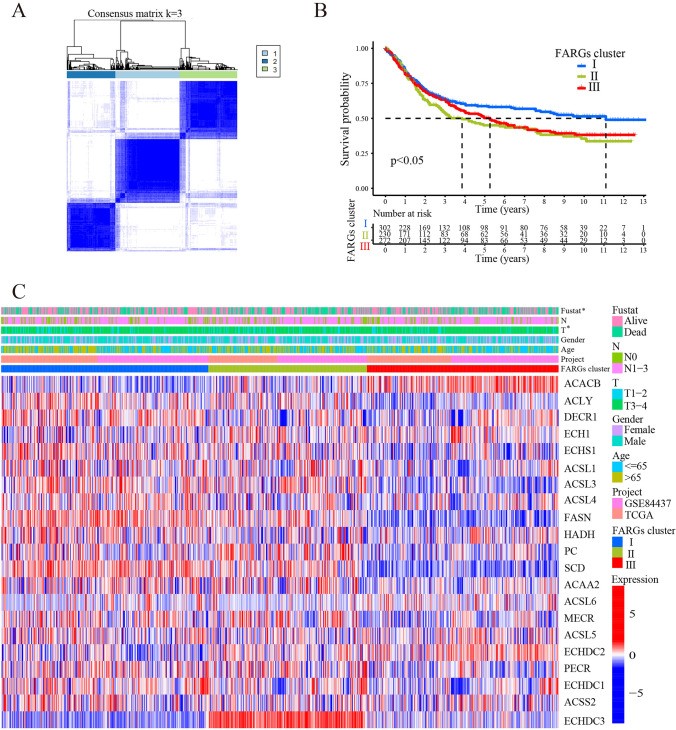
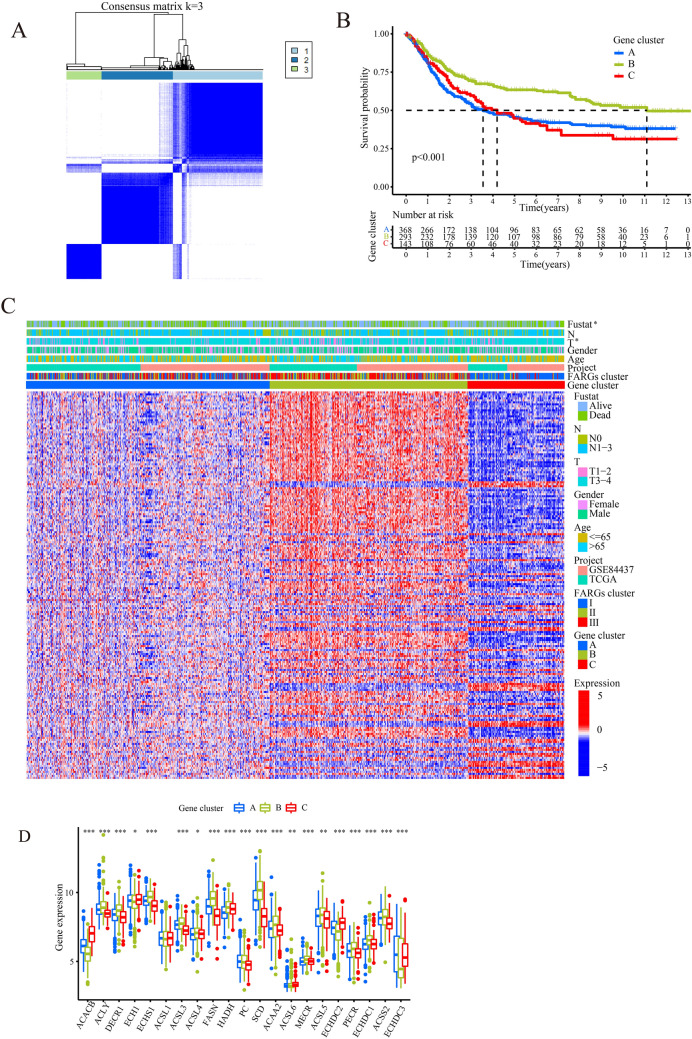
Gastric cancer (GC), one of the most common and heterogeneous malignancies, is the second leading cause of cancer death worldwide and is closely related to dietary habits. Fatty acid is one of the main nutrients of human beings, which is closely related to diabetes, hypertension and other diseases. However, the correlation between fatty acid metabolism and the development and progression of GC remains largely unknown. Here, we profiled the genetic alterations of fatty acid anabolism-related genes (FARGs) in gastric cancer samples from the TCGA cohort and GEO database to evaluate the possible relationships and their internal regulatory mechanism. Through consistent clustering and functional enrichment analysis, three distinct fatty acid anabolism clusters and three gene subtypes were identified to participate in different biological pathways, and correlated with the characteristics of immune cell infiltration and clinical prognosis. Importantly, a distinctive FA-score was constructed through the principal component analysis to quantify the characteristics of fatty acid anabolism in each GC patient. Further analysis showed patients grouped in the high FA-score group were characterized with greater tumor mutational burden (TMB) and higher microsatellite stability (MSI-H), which may be more aeschynomenous to immunotherapy and had a favorable prognosis. Altogether, our bioinformatics analysis based on FARGs uncovered the potential roles of fatty acid metabolism in GC, and may provide newly prognostic information and novel approaches for promoting individualized immunotherapy in patients with GC.

Keywords: Clinical prognosis; Fatty acid anabolism; Gastric cancer; Immunotherapy; Tumor microenvironment.


Conflict of interest statement

Declarations. Competing interests: The authors declare no competing interests.

Figures

Fig. 1
Fig. 1
Genetic and transcriptional alterations of FARGs in GC. A Waterfall diagram of FARGs mutation frequency in TCGA-STAD cohort. The right bar plot displayed the proportion of different mutation types. B Histogram plot showing the CNV frequency of each gene based on statistical analysis among copy number of FARGs. Red dots indicate an increase in copy number, blue dots represent a reduction in copy number. C Circle diagram of the CNV sites for FARGs on 23 chromosomes. D Box plot displaying the expression distributions of FARGs between normal and tumor samples. The *represents p-value < 0.05, **represents p-value < 0.01, ***represents p-value < 0.001. CNV copy number variation
Fig. 2
Fig. 2
Identification of FARGs clusters and their clinical characteristics in GC. A The matrix heatmap of consensus clustering analysis for FARGs when k = 3; B The Kaplan–Meier curves for the survival probability in three FARGs clusters; clusters I vs clusters II, p < 0.05, clusters I vs clusters III, p < 0.05; C Clinicopathologic characteristics and the expression levels of FARGs in three distinct FARGs clusters
Fig. 3
Fig. 3
GSVA of the differences in biological pathways among three distinct FARGs clusters. A The top 20 different biological pathways between FARGs cluster I and cluster III; B The top 20 different biological pathways between FARGs cluster II and cluster III; C The top 20 different biological pathways between FARGs cluster I and cluster II
Fig. 4
Fig. 4
Characteristics of immune infiltration and functional enrichment analysis. A Immune infiltration level of 23 types of immune cells among three distinct FARGs clusters; B Scatter plot of PCA analysis; C Venn plots showing the overlapping genes in three distinct FARGs clusters; D GO enrichment analysis of the overlapping genes. E KEGG enrichment analysis of the overlapping genes; *p < 0.05, **p < 0.01, ***p < 0.001, ns no significance. PCA principal component analysis
Fig. 5
Fig. 5
Identification of the FARGs gene subtypes and their clinical characteristics in GC. A The matrix heatmap of consensus clustering analysis for the prognostic overlapping genes when k = 3; B The Kaplan–Meier curves for survival analysis in the three gene clusters, cluster B vs cluster A, p < 0.001, cluster B vs cluster C, p < 0.001; C Clinicopathologic characteristics and the expression heatmap of the prognostic overlapping genes in three gene clusters; D Box plot showing the expression levels of FARGs in different gene clusters
Fig. 6
Fig. 6
Identification of the FA-score group and its prediction on the prognosis of GC patients. A Sankey diagrams showing the associations among FARGs cluster, gene clusters, FA-score and survival outcomes; B The heatmap of correlation between FA-score and multiple immune infiltrating cells, red and blue represent positive or negative correlations, respectively, and * was represented statistically significant; C The differences of FA-score among three different FARGs clusters; D The differences of FA-score among three different gene clusters; E The difference of FA-score in GC patients with different survival status; F Box plot showing the percentage weight of survival status in high and low FA-score group; G Kaplan-Meier analysis of survival probability of GC patients in low and high FA-score group (Log-rank tests, p-value < 0.001)
Fig. 7
Fig. 7
Characteristics of tumor mutation burden (TMB) and its impact on prognosis. A Dot plot showing the correlations between FA-score and gene clusters, tumor mutation burden; B Box plot showing the difference of tumor mutation burden in high and low FA-score groups; C, D Waterfall plot displaying the mutation features in high FA-score group or low FA-score group, respectively; the upper or right bar plot showing the proportion of TMB or mutation types, respectively; E Kaplan-Meier curves of survival probability of GC patients in low or high TMB group (Log-rank tests, p-value < 0.001); F Survival analysis of GC patients according to the levels of TMB and FA-score (Log-rank tests, between multiple groups p-value < 0.001). TMB: tumor mutation burden
Fig. 8
Fig. 8
Immune cell infiltration and PD-L1 expression in high and low FA-score groups. A Bar plot showing the infiltration abundance of immune cells in high and low FA-score groups; B The relative percentage of immune cells in each sample; C Bar plot showing the score of immune-related functions in high and low FA-score groups; D The correlation analysis between PD-L1 expression and FA-score; E The difference of PD-L1 expression in two distinct FA-score groups
Fig. 9
Fig. 9
Identification of ACSL4 as a key regulator of FARGs. A The PPI network of FARGs from Cytoscape; B Differential expression analysis of ACSL4 among the three FARGs clusters; C Lipid peroxides levels of indicated cells with or without the treatment of Erastin assessed by BODIPY staining and flow cytometry; D The cellular ROS levels of indicated cells with or without the treatment of Erastin. Control, the BGC823 cells; shACSL4, the BGC823 cells with ACSL4 silence

References

    1. Russi S, et al. Gene regulatory network characterization of gastric cancer’s histological subtypes: distinctive biological and clinically relevant master regulators. Cancers (Basel). 2022;14(19):4961. - PMC - PubMed
    1. Ogando DG, et al. Ammonia sensitive SLC4A11 mitochondrial uncoupling reduces glutamine induced oxidative stress. Redox Biol. 2019;26: 101260. - PMC - PubMed
    1. Torresano L, et al. Metabolic reprogramming and disease progression in cancer patients. Biochim Biophys Acta Mol Basis Dis. 2020;1866(5): 165721. - PubMed
    1. Shin E, Koo J. Glucose metabolism and glucose transporters in breast cancer. Front Cell Dev Biol. 2021;9: 728759. - PMC - PubMed
    1. Li Y, et al. CISD3 inhibition drives cystine-deprivation induced ferroptosis. Cell Death Dis. 2021;12(9):839. - PMC - PubMed

LinkOut - more resources