. 2025 Mar 21;6(1):103540.
doi: 10.1016/j.xpro.2024.103540. Epub 2025 Jan 4.

Protocol for capturing a full transcriptome from single preimplantation embryos using So-Smart-seq

Affiliations

Protocol for capturing a full transcriptome from single preimplantation embryos using So-Smart-seq

Chunyao Wei et al. STAR Protoc. .

Abstract

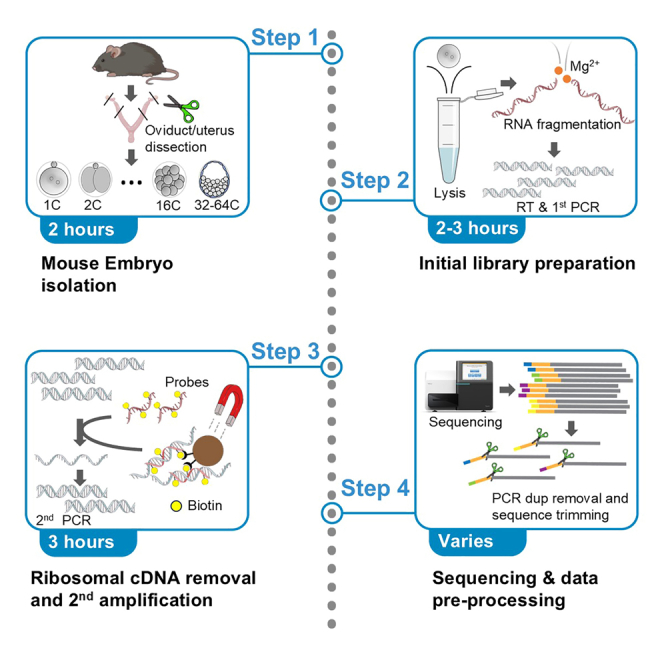
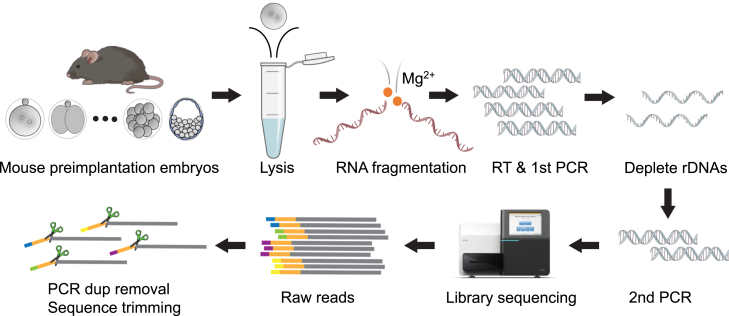
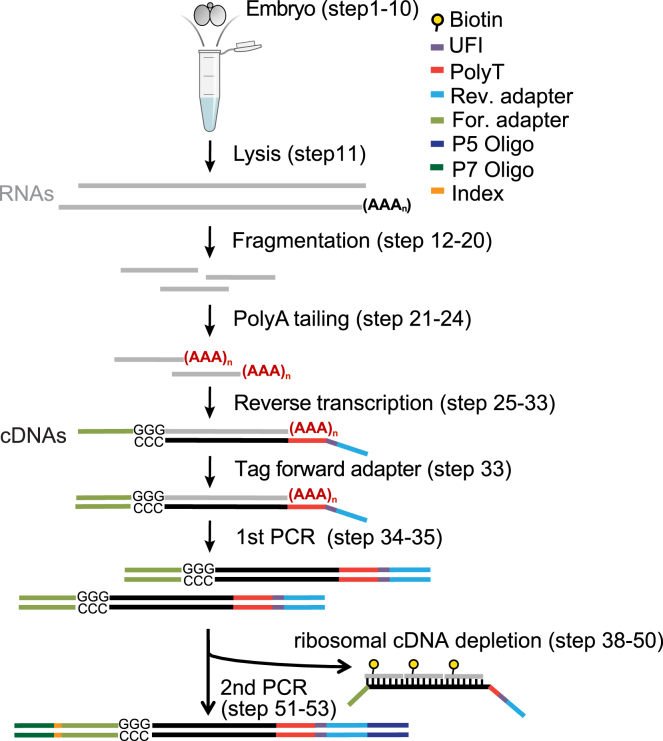
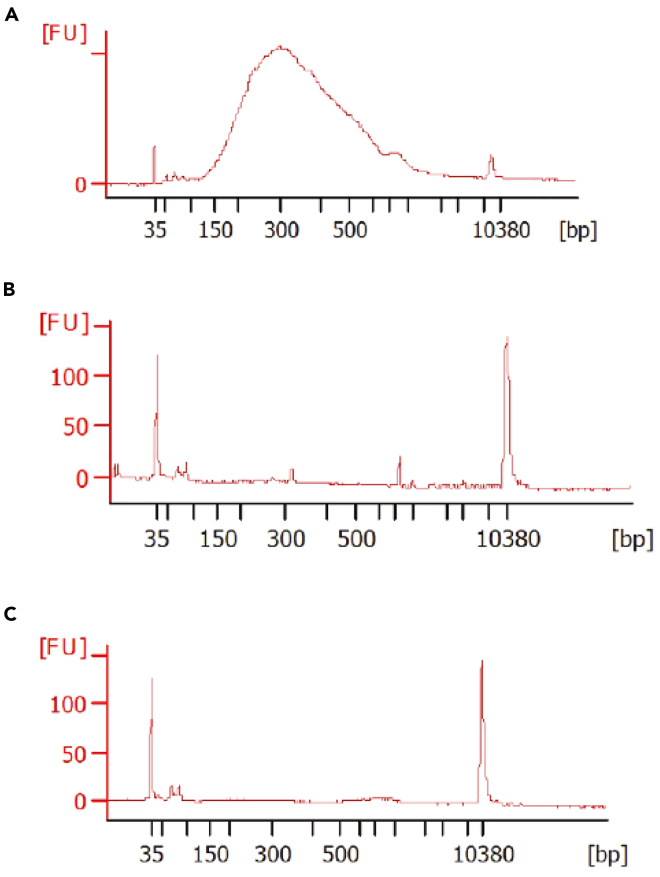
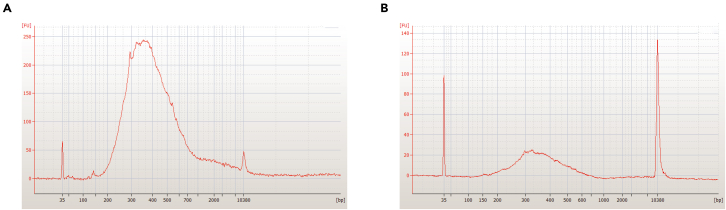
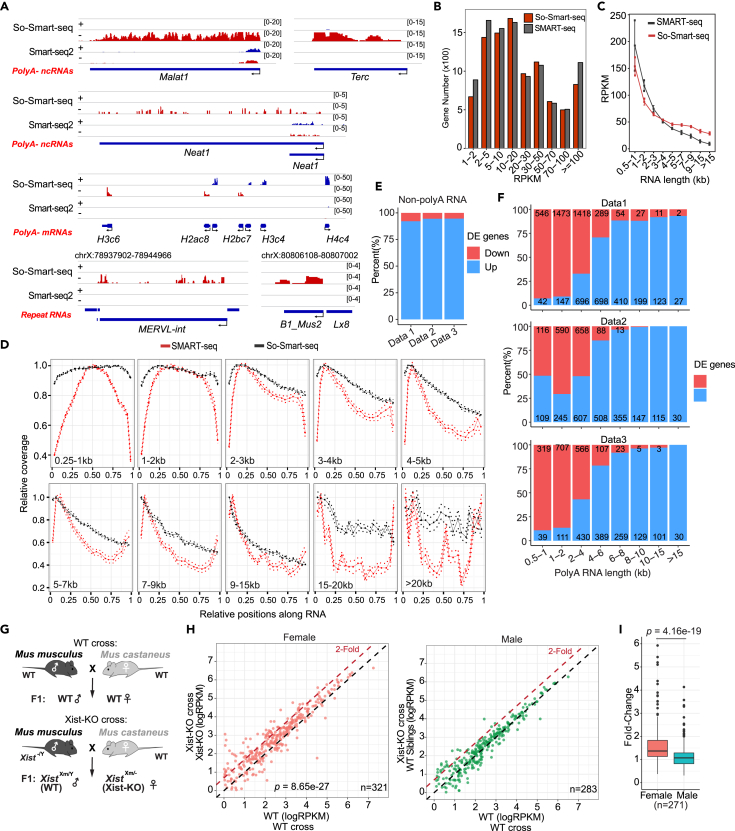
Strand-optimized Smart-seq (So-Smart-seq) can capture a comprehensive transcriptome from low-input samples. This technique detects both polyadenylated and non-polyadenylated RNAs, inclusive of repetitive RNAs, while excluding highly abundant ribosomal RNAs. So-Smart-seq preserves strand information and minimizes 5' to 3' coverage bias. We describe steps for the analysis of single mouse preimplantation embryos, including embryo isolation, library preparation, ribosomal cDNA depletion, and initial data processing. The protocol may be adapted for other low-input samples and the detection of small RNAs of <200 nt. For complete details on the use and execution of this protocol, please refer to Wei et al.1.

Keywords: Bioinformatics; Developmental biology; Genetics; Genomics; Molecular Biology; Systems biology.


Conflict of interest statement

Declaration of interests J.T.L. is a cofounder of Fulcrum Therapeutics, an advisor to Skyhawk Therapeutics, and a Non-Executive Director of the GSK.

Figures

None
Graphical abstract
Figure 1
Figure 1
Cartoon describing the So-Smart-seq protocol
Figure 2
Figure 2
Schematic diagram of So-smart-seq library preparation using a single preimplantation embryo Purple: hexamer unique fragment identifier (UFI); Red: PolyT; Light blue: Reverse adapter; Light green: Forward adapter; Dark blue: P5 Oligo; Dark green: P7 Oligo; Orange: 6-mer Index; Gray: RNAs; black: DNAs.
Figure 3
Figure 3
PCR tube adapter and mouth pipette (A) Schematic diagram of a PCR tube adapter. (B) A mouth pipette and its components.
Figure 4
Figure 4
Example of library bioanalyzer results after 1st PCR amplification in a sample and two controls (A) Library prepared from a late 2-cell embryo. (B) Control library prepared from a late 2-cell embryo, without using PAP mix. (C) Control library prepared from PBS-BSA, without any embryo.
Figure 5
Figure 5
Example of library bioanalyzer results after 2nd PCR amplification (A) Expected result of a good library (in 1: 5 dilution) from an 8-cell mouse embryo. (B) The result of a bad library from a 4-cell mouse embryo.
Figure 6
Figure 6
Validation of So-Smart-seq Panels are reproduced and adapted from a previous research article. Permission is obtained. (A) Comparing coverage profiles of representative PolyA- (Malat1, Neat1, Terc and Histones) and repeat (MERVL, B2) RNAs at 8C stage using So-Smart-seq method versus a published method (Smart-seq2). (B) Comparison showing the number of genes at different expression levels detected by So-Smart-seq versus SMART-seq. (C) Comparison on detection sensitivity as a function of RNA length using the two methods. Mean expression (RPKM) of all RNAs in each size group from one embryo was calculated. Error bars are standard deviations from 33 4-cell embryo replicates (16 embryos for So-Smart-seq, and 17 embryos for SMART-seq7). (D) Comparison of read coverage along the length of transcripts using the two methods. All non-overlapping transcripts are divided into groups on the basis of their length, and the coverage is calculated in 100-nt bins. The highest bin coverage within each group is scaled to 1, and the position of each bin is shown as a ratio relative to the total length of RNAs. The dotted lines indicate a 95% confidence interval. (E) The percent of change (up or down-regulation) in differentially expressed (DE) non-polyA RNAs in our study versus published datasets from 4C, 8C and 2C stage (Data1, Data2, and Data3, respectively). (F) The percent of change (up or down-regulation) in all differentially expressed (DE) polyA RNAs in our study versus published datasets 1 to 3, per above. RNAs were grouped by length, and the number of DE genes in each category is indicated. Given that prior methods required PCR of full-length cDNAs before library preparation, higher representation of short RNAs in published datasets could have resulted from amplification bias. (G) Diagram depicting the crosses used for the analyses in panels H-I to validate the sensitivity of So-Smart-seq. (H) The scatter plots showing expression difference of X-linked genes between Xist-KO crosses and WT crosses, in female F1 embryo (left panel, red) and male F1 (right panel, green) embryos, respectively. Each dot represents one X-linked gene. Gene expression was determined using the mean value from all embryo replicates, and our analysis included only those genes with RPKM >=1. p = 8.65 × 10–27, between Xist-KO and WT female embryos, by Wilcoxon Signed-Rank test. (I) Boxplot showing the fold-change of X-linked genes in Xist-KO crosses relative to WT crosses, for male and female embryos, respectively, as showed in (H). p = 4.16 × 10–19, between female and male embryos, by Wilcoxon ranked sum test.

Similar articles

References

    1. Wei C., Kesner B., Yin H., Lee J.T. Imprinted X chromosome inactivation at the gamete-to-embryo transition. Mol. Cell. 2024;84:1442–1459.e7. doi: 10.1016/j.molcel.2024.02.013. - DOI - PMC - PubMed
    1. Picelli S., Björklund Å.K., Faridani O.R., Sagasser S., Winberg G., Sandberg R. Smart-seq2 for sensitive full-length transcriptome profiling in single cells. Nat. Methods. 2013;10:1096–1098. doi: 10.1038/nmeth.2639. - DOI - PubMed
    1. Behringer R. Cold Spring Harbor Laboratory Press; 2014. Manipulating the Mouse Embryo : A Laboratory Manual, Fourth Edition; pp. 137–148.
    1. Tang F., Barbacioru C., Nordman E., Li B., Xu N., Bashkirov V.I., Lao K., Surani M.A. RNA-Seq analysis to capture the transcriptome landscape of a single cell. Nat. Protoc. 2010;5:516–535. doi: 10.1038/nprot.2009.236. - DOI - PMC - PubMed
    1. Ramskold D., Luo S., Wang Y.C., Li R., Deng Q., Faridani O.R., Daniels G.A., Khrebtukova I., Loring J.F., Laurent L.C., et al. Full-length mRNA-Seq from single-cell levels of RNA and individual circulating tumor cells. Nat. Biotechnol. 2012;30:777–782. doi: 10.1038/nbt.2282. - DOI - PMC - PubMed

LinkOut - more resources