. 2025 Jan 6;24(1):3.
doi: 10.1186/s12943-024-02191-9.

Single cell and spatial analysis of immune-hot and immune-cold tumours identifies fibroblast subtypes associated with distinct immunological niches and positive immunotherapy response

Affiliations

Single cell and spatial analysis of immune-hot and immune-cold tumours identifies fibroblast subtypes associated with distinct immunological niches and positive immunotherapy response

Benjamin H Jenkins et al. Mol Cancer. .

Abstract

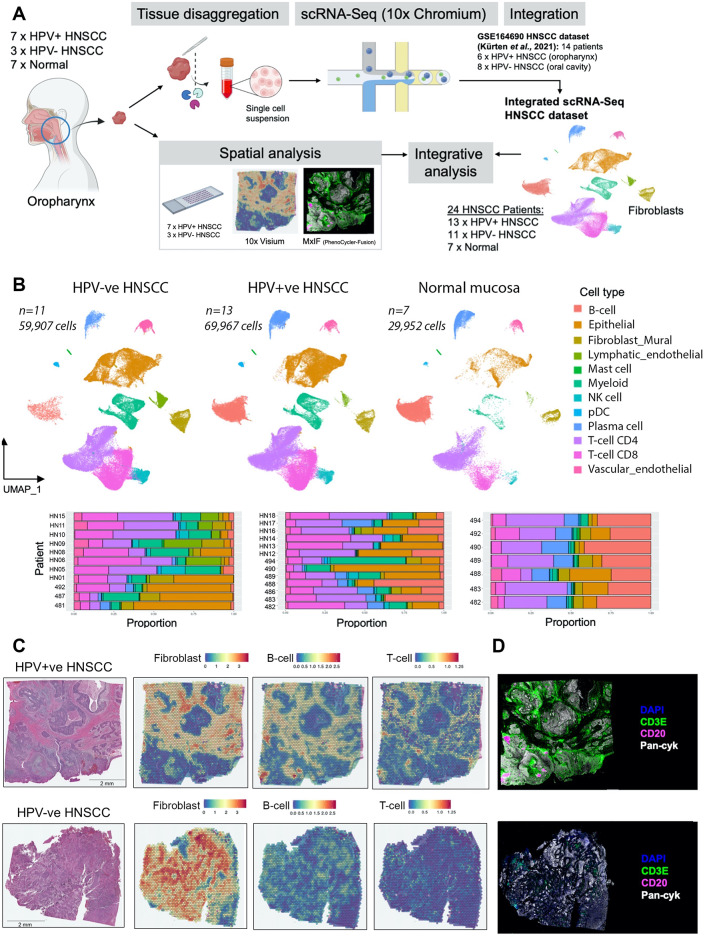
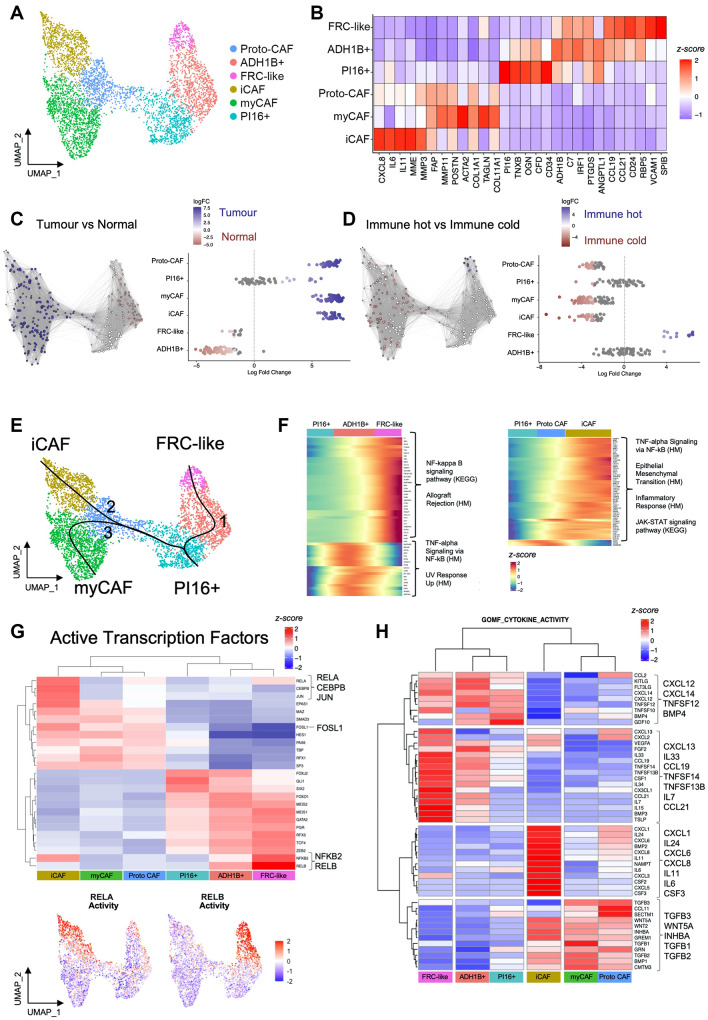
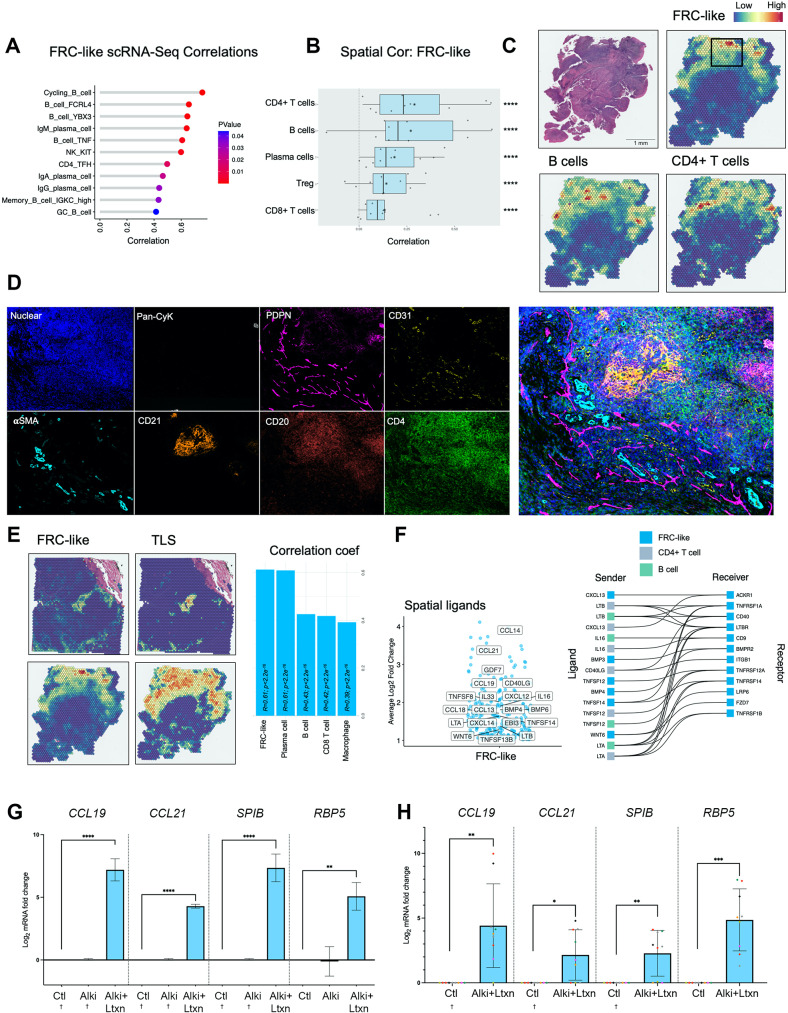
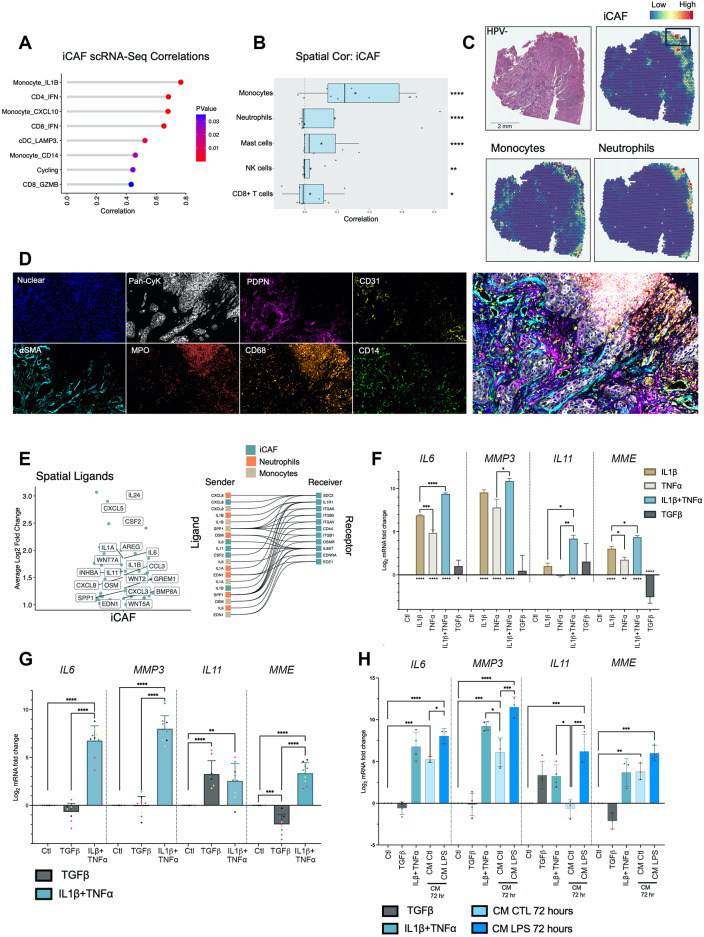
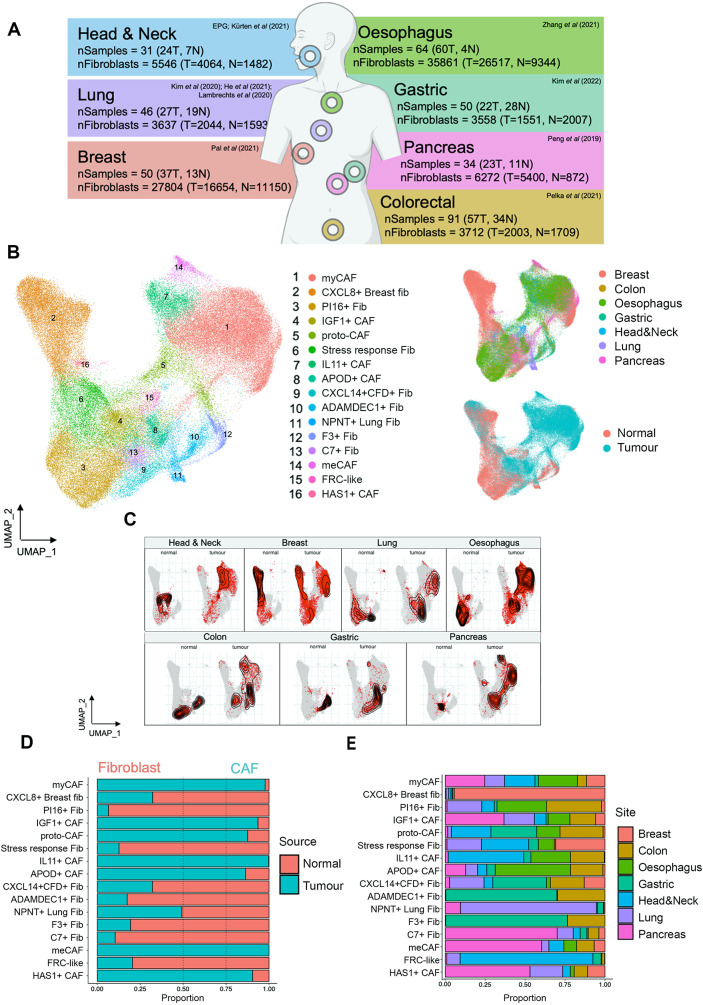
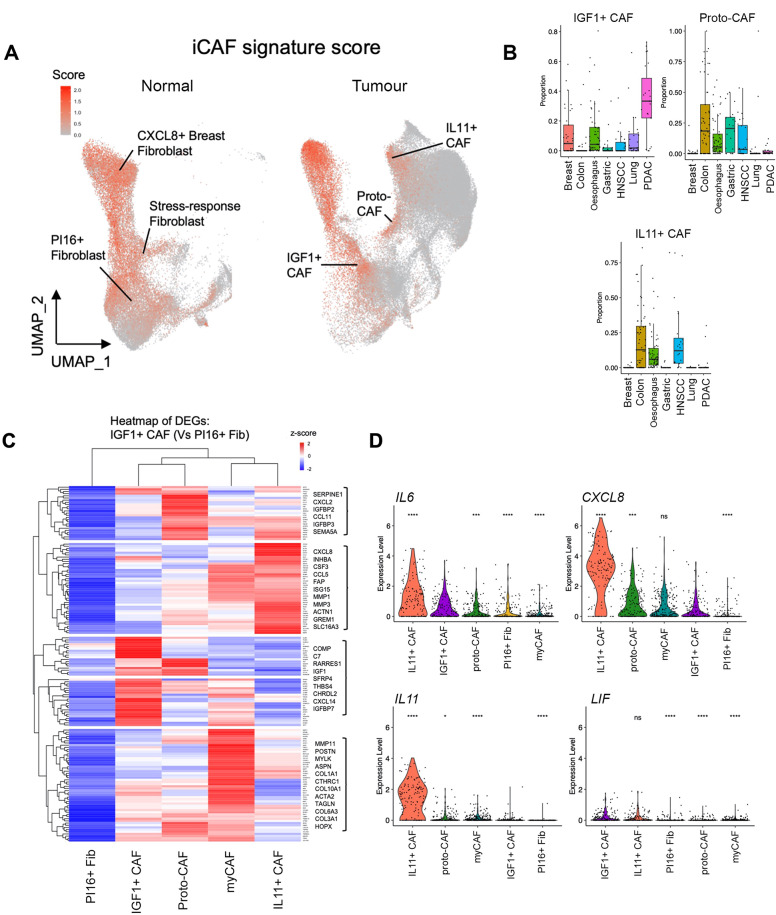
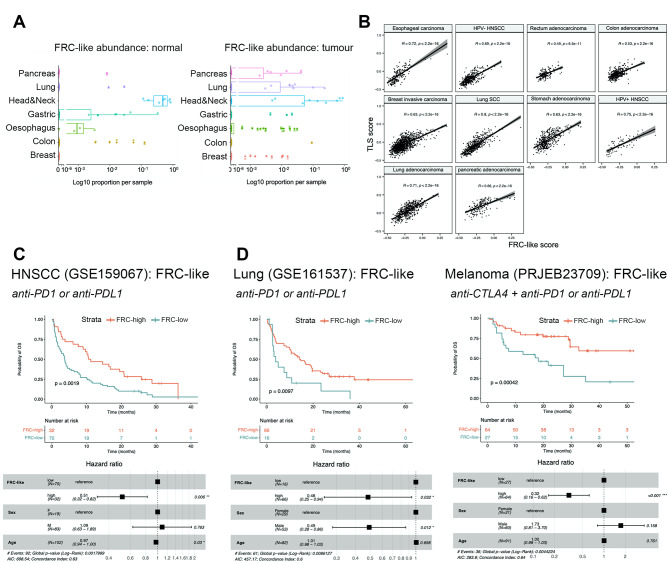
Cancer-associated Fibroblasts (CAFs) have emerged as critical regulators of anti-tumour immunity, with both beneficial and detrimental properties that remain poorly characterised. To investigate this, we performed single-cell and spatial transcriptomic analysis, comparing head & neck squamous cell carcinoma (HNSCC) subgroups, which although heterogenous, can be considered broadly immune-hot and immune-cold (human papillomavirus [HPV]+ve and HPV-ve tumours respectively). This identified six fibroblast subpopulations, including two with immunomodulatory gene expression profiles (IL-11 + inflammatory [i]CAF and CCL19 + fibroblastic reticular cell [FRC]-like). IL-11 + iCAF were spatially associated with inflammatory monocytes and regulated in vitro through synergistic activation of canonical NF-κB signalling by IL-1β and TNF-α. FRC-like were enriched in immune-hot HPV+ve tumours, associated with CD4 + T-cells and B-cells in tertiary lymphoid structures and regulated through non-canonical NF-κB signalling via lymphotoxin. Pan-cancer analysis revealed several 'iCAF' subgroups present in both normal and cancer tissues; IL11 + iCAF were found in cancers from the gastrointestinal (GI) tract and transcriptomically distinct from iCAFs previously described in pancreatic and breast cancers with greater inflammatory properties; FRC-like fibroblasts were present at low frequencies in all tumour types, and were associated with significantly better survival in patients receiving checkpoint immunotherapy. This work clarifies and expands current literature on immunomodulatory CAFs, highlighting links with important immunological niches.


Conflict of interest statement

Declarations. Ethical approval: Ethical approval for the study was obtained through the UK National Research Ethics Service (South Central - Hampshire B Research Ethics Committee) and written informed consent was obtained from all subjects (REC No. 09/H0501/90). Competing interests: The authors declare no competing interests.

Figures

Fig. 1
Fig. 1
HPV+ve HNSCC frequently has an immune-hot tumour microenvironment. (A) Schematic of workflow for integrative single cell and spatial analysis. (B) Plot showing UMAP embeddings for integrated (Seurat RPCA) HNSCC scRNA-Seq dataset comprising HPV-ve HNSCC (n = 11; 59,907 cells), HPV+ve HNSCC (n = 13; 69,967 cells) and normal oropharyngeal tissue (n = 7; 29,952 cells). UMAP plots displaying 12 clusters are accompanied with bar plots showing relative proportions of broad cell types per patient sample. Clusters are annotated based on expression of marker genes as shown in Supplementary Fig. 1E. (C) H&E images with spatial feature plots showing spatial transcriptomics MCP-counter deconvoluted abundance for B-cells, T-cells and CAF in representative examples of HPV+ve and HPV-ve patients. Cell type abundance within each Visium (10x) spot estimated by MCP-counter is displayed. (D) MxIF (Phenocycler-Fusion) examples of DAPI, CD3E, CD20 and Pan-Cytokeratin staining in representative HPV+ve and HPV-ve patients
Fig. 2
Fig. 2
scRNA-Seq of HNSCC reveals distinct subsets of immunomodulatory fibroblasts. (A) UMAP of fibroblasts from integrated HNSCC dataset showing six clusters (4,894 cells; n = 24 HNSCC; n = 7 normal). (B) Heatmap showing the average expression of selected differentially expressed genes for each fibroblast cluster. (C) Differential abundance testing between HNSCC and normal samples. Highlighting differentially abundant neighbourhoods. (D) Differential abundance testing between immune-hot (n = 8) and immune-cold (n = 8) HNSCC. Samples classified based on lymphocyte content (see methods). (E) Trajectory analysis showing fibroblast lineages arising from universal (PI16+) fibroblasts. Lineage reconstruction and pseudotime inference using Slingshot package. (F) Examination of potential signalling pathways regulating iCAF and FRC-like inflammatory subsets by assessing pathway enrichment in genes that change as a function of pseudotime in the KEGG and Hallmarks gene sets (determined using Monocle 3 trajectory; q_value < 0.05 & morans_I > 0.25). Over-representation analysis showing selected enriched pathways of pseudotime-dependent genes. (G) Heatmap of activity of the top 25 transcription factors using DoRothEA regulons (wmean). Clustered scaled activity scores are shown. Below the heatmap shows scaled activity of RELA and RELB. (H) Average expression of genes with cytokine activity across fibroblast clusters. Differentially expressed genes filtered for GOMF_CYTOKINE ACTIVITY MSigDB gene set
Fig. 3
Fig. 3
FRC-like fibroblasts colocalise with B-cells and CD4 + T-cells, found within TLS and are regulated via LTβR signalling. (A) FRC-like fibroblast and immune cell sample-level scRNA-Seq correlations (spearman; p < 0.05). For HNSCC samples only, fibroblast proportions (relative to total fibroblasts) per sample were correlated against immune cell cluster proportions (relative to total immune cells). Only significant positive associations are shown. (B) Spatial transcriptomics cell type correlations (spearman) using RCTD imputed abundance (normalised weights ≥ 0.05). Visium (10x) spots were deconvoluted using RCTD. Spearman correlation of normalised weights was carried out on each patient separately. Correlation coefficients are plotted for each of 10 patients, median displayed as vertical line in boxplot and mean as star symbol. Weighted Fisher’s method was used to combine p values. (C) Spatial feature plot of deconvoluted values of FRC-like fibroblasts, B-cells and CD4 + T-cells in a HPV + ve HNSCC sample. (D) MxIF (Phenocycler-Fusion) showing staining (DAPI, Pan-cytokeratin, PDPN, CD31, αSMA, CD21, CD20, CD4) in FRC-like containing region of interest identified by RCTD deconvolution. MxIF markers are shown separately and accompanied by composite image of all markers. PDPN + CD31- cells marking fibroblasts. (E) FRC-like abundance (RCTD) and TLS signature [33] enrichment (AddModuleScore) spatial feature plot with spearman correlation of RCTD normalised weights. Correlations for each Visium (10x) spot across all 10 patients. Top 5 correlations shown, including FRC-like fibroblasts with highest correlation coefficient. (F) Volcano and ligand-receptor interaction plots showing spatially differentially expressed ligands (Log2FC ≥ 1; padj < 0.0001). Differentially expressed ligands in FRC-like containing spots (normalised weight ≥ 0.05). Ligands displayed are those found within the GOMF_CYTOKINE_ACTIVITY MSigDB gene set; expressed in FRC-like fibroblasts, B-cells or CD4 + T-cells; and have expression of corresponding receptor in FRC-like fibroblasts. (G) qPCR analysis of FRC-like fibroblast markers (CCL19, CCL21, SPIB and RBP5) in primary NOF treated with a TGFBR1 inhibitor (ALKi; 1µM) and 50ng/ml LTa1β2 for 7 days. Results show mean ± SD of 3 independent experiments in n = 1 primary NOF cell line. One-way ANOVA with Bonferroni correction. (H) qPCR analysis of FRC-like fibroblast markers (CCL19, CCL21, SPIB and RBP5) in n = 7 primary NOF lines treated with 100ng/ml LTa1β2 + ALKi (1µM) for 48 h. Results show mean ± SD of 9 independent experiments, colours of points correspond to primary NOF line. Paired Student t test (two-tailed). † = Ct undetermined, assumed Ct = 40. *p < 0.05; **p < 0.01; ***p < 0.001. ****p < 0.0001
Fig. 4
Fig. 4
iCAF colocalise with inflammatory monocytes and neutrophils and are regulated via IL-1β and TNF-α signalling. (A) iCAF and immune cell sample-level scRNA-Seq correlations (spearman; p < 0.05). For HNSCC samples only, fibroblast proportions (relative to total fibroblasts) per sample were correlated against immune cell cluster proportions (relative to total immune cells). Only significant positive associations are shown. (B) Spatial transcriptomics cell type correlations (spearman) using RCTD imputed abundance (normalised weights ≥ 0.05). Visium (10x) spots were deconvoluted using RCTD. Spearman correlation of normalised weights was carried out on each patient separately. Correlation coefficients are plotted for each of 10 patients, median displayed as vertical line in boxplot and mean as star symbol. Weighted Fisher’s method was used to combine p values. (C) Spatial feature plot of deconvoluted values of iCAF, monocytes and neutrophils in a HPV-ve HNSCC sample. (D) MxIF (Phenocycler-Fusion) showing staining (DAPI, Pan-cytokeratin, PDPN, CD31, αSMA, MPO, CD68, CD14) in iCAF containing region of interest identified by RCTD deconvolution. MxIF markers are shown separately and accompanied by composite image of all markers. (E) Volcano and ligand-receptor interaction plots showing spatially differentially expressed ligands (Log2FC ≥ 1; padj < 0.0001). Differentially expressed ligands identified using FindMarkers on iCAF containing spots (normalised weight ≥ 0.05) filtered for ligands. Ligands displayed are those found within the GOMF_CYTOKINE_ACTIVITY MSigDB gene set; expressed in iCAF, monocytes or neutrophils; and have expression of corresponding receptor in iCAF. (F) qPCR analysis of iCAF markers (IL6, MMP3, IL11 and MME) in primary NOF treated with IL1β (1ng/mL), TNF𝛼 (1ng/mL), IL1β (1ng/mL) + TNF𝛼 (1ng/mL) and TGFβ (4ng/mL) for 48 h. Results show mean ± SD of 3 biological replicates in n = 1 primary NOF cell line. One-way ANOVA with Bonferroni correction. P values marked by asterisk under bars reflect comparisons with CTL. (G) qPCR analysis of iCAF markers (IL6, MMP3, IL11 and MME) in n = 5 primary NOF lines treated with TGFβ (4ng/mL) or IL1β (1ng/mL) + TNF𝛼 (1ng/mL) for 72 h. Results show mean ± SD of n = 9 independent experiments, colours of points correspond to primary NOF line. One-way ANOVA with Bonferroni correction. (H) qPCR analysis of iCAF markers (IL6, MMP3, IL11 and MME) in n = 3/4 primary NOF lines treated with TGFβ (4ng/mL), IL1β (1ng/mL) + TNF𝛼 (1ng/mL), monocyte conditioned media (CM) or LPS-activated monocyte conditioned media for 72 h. Results show mean ± SD of n ≥ 3 independent experiments, colours of points correspond to primary NOF line. One-way ANOVA with Bonferroni correction. *p < 0.05; **p < 0.01; ***p < 0.001. ****p < 0.0001
Fig. 5
Fig. 5
Pan-Cancer fibroblast analysis identifies conserved and semiconserved inflammatory fibroblast phenotypes. (A) Schematic of Pan-Cancer Fibroblast Atlas (PCFA) including anatomical sites, sample/fibroblast numbers and original publications. This integrated PCFA contained 86,414 fibroblasts from 376 samples. (B) UMAP plot of PCFA displaying 16 clusters, and to the right, UMAPs coloured by anatomical site and source of sample (tumour or normal). Samples were integrated using harmony via Seurat v5 sketch-based integration. (C) PCFA UMAP split by anatomical site and tumour/normal samples with density of fibroblasts highlighted on UMAP. (D) Relative proportion of each cluster in down-sampled (to same number of cells from each anatomical site and same number of cells from tumour/normal samples) normal and tumour samples. (E) Relative proportion of each cluster in down-sampled (to same number) anatomical sites (including normal and tumour samples)
Fig. 6
Fig. 6
‘iCAF’ gene signature highlights different normal fibroblast and CAF populations. (A) Feature plot (UMAP) showing expression of iCAF signature enrichment in PCFA, split by tumour or normal samples. AddModuleScore using the 12-gene iCAF signature from Elyada et al., (2019) [5]. (B) Proportion of IL11 + CAF, proto-CAF and IGF1 + CAF in tumour samples across cancer types. (C) Heatmap showing average expression of DEGs upregulated in IGF1 + iCAF compared to universal (PI16+) fibroblasts. Clustering of rows form gene modules. (D) Selected iCAF gene (IL6, CXCL8, IL11, LIF) expression across clusters (sample-level). Wilcoxon rank-sum test (two-sided) compared to IGF1 + CAF. ns p ≥ 0.05, *p < 0.05; **p < 0.01; ***p < 0.001. ****p < 0.0001
Fig. 7
Fig. 7
FRC-like fibroblasts are present across cancers at low frequency and are associated with positive response to immunotherapy. (A) Abundance of FRC-like fibroblasts across anatomical sites (normal only) and cancer types (tumour only). Log10 scale used due to extremely low abundance of FRC-like fibroblasts in non-head & neck tissue/tumours. (B) Correlation of FRC-like fibroblast signature and TLS signature [33] enrichment across selected cancer types in TCGA Bulk RNA-Seq data. ssGSEA run using batch effects normalized mRNA data from the Pan-Cancer Atlas Hub (UCSCXena). Spearman correlation coefficients and p-values displayed. (C) Kaplan-Meier (overall) survival plot showing anti-PD-1/PD-L1 treated HNSCC cohort (GSE159067; n = 102), stratified by FRC-like fibroblast (ssGSEA) scores. Below, forest plot for multivariate cox regression model using FRC-like level (high or low), patient sex and patient age. Hazard ratio estimates along with confidence intervals (95%) and p-values are plotted for each variable. (D) Kaplan-Meier (overall) survival plot showing anti-PD-1/PD-L1 treated NSCLC cohort (GSE161537; n = 82) and anti-CTLA-4 + anti-PD-1 or anti-PD-1 treated melanoma cohort (PRJEB23709; n = 91) stratified by FRC-like fibroblast (ssGSEA) scores. Below, forest plot for multivariate cox regression model using FRC-like level (high or low), patient sex and patient age. Hazard ratio estimates along with confidence intervals (95%) and p-values are plotted for each variable. Statistical significance shown on Kaplan-Meier plot assessed using a log-rank test

References

    1. Buechler MB, Pradhan RN, Krishnamurty AT, Cox C, Calviello AK, Wang AW, et al. Cross-tissue organization of the fibroblast lineage. Nature. 2021;593:575–9. - PubMed
    1. Davidson S, Coles M, Thomas T, Kollias G, Ludewig B, Turley S, et al. Fibroblasts as immune regulators in infection, inflammation and cancer. Nat Rev Immunol. 2021;21:704–17. - PubMed
    1. Hanley CJ, Waise S, Ellis MJ, Lopez MA, Pun WY, Taylor J, et al. Single-cell analysis reveals prognostic fibroblast subpopulations linked to molecular and immunological subtypes of lung cancer. Nat Commun. 2023;14:387. - PMC - PubMed
    1. Biffi G, Oni TE, Spielman B, Hao Y, Elyada E, Park Y, et al. IL1-Induced JAK/STAT signaling is antagonized by TGFβ to shape CAF heterogeneity in pancreatic ductal adenocarcinoma. Cancer Discov. 2019;9:282–301. - PMC - PubMed
    1. Elyada E, Bolisetty M, Laise P, Flynn WF, Courtois ET, Burkhart RA, et al. Cross-species single-cell analysis of pancreatic ductal adenocarcinoma reveals Antigen-Presenting Cancer-Associated fibroblasts. Cancer Discov. 2019;9:1102–23. - PMC - PubMed

MeSH terms

LinkOut - more resources