. 2025 Mar;58(3):140-145.
doi: 10.5483/BMBRep.2024-0062.

Celecoxib is the only nonsteroidal anti-inflammatory drug to inhibit bone progression in spondyloarthritis

Affiliations

Celecoxib is the only nonsteroidal anti-inflammatory drug to inhibit bone progression in spondyloarthritis

Jin Sun Choi et al. BMB Rep. 2025 Mar.

Erratum in

Abstract

Spondyloarthritis (SpA) is a chronic inflammatory disease that leads to ankylosis of the axial skeleton. Celecoxib (cyclooxygenase-2 inhibitor, COX-2i) inhibited radiographic progression in a clinical study of SpA, but in the following study, diclofenac (COX-2 non-selective) failed to show that inhibition. Our study aimed to investigate whether nonsteroidal anti-inflammatory drugs (NSAIDs) inhibited bone progression in SpA, and whether celecoxib had a unique function (independent of the COX-inhibitor), compared with the other NSAIDs. We investigated the efficacy of various NSAIDs in curdlan-injected SKG mice (SKGc), an animal model of SpA, analyzed by bone micro-CT and immunohistochemistry. We also tested the effect of NSAIDs on osteoblast (OB) differentiation and bone mineralization in primary bone-derived cells (BdCs) from mice, and in ankylosing spondylitis (AS) patients and human osteosarcoma cell line (SaOS2). Celecoxib significantly inhibited clinical arthritis and bone progression in the joints of SKGc, but not etoricoxib (another COX-2i), nor naproxen (COX-2 nonselective). Both DM-celecoxib, not inhibiting COX-2, and celecoxib, inhibited OB differentiation and bone mineralization in the BdCs of mice and AS patients, and in SaOS2, but etoricoxib or naproxen did not. The in silico study indicated that celecoxib and 2,5-dimethyl-celecoxib (DM-celecoxib) would bind to cadherin-11 (CDH11) with higher affinity than etoricoxib and naproxen. Celecoxib suppressed CDH11-mediated β-catenin signaling in the joints of SKGc, primary mice cells, and SaOS2 cells. Of the NSAIDs, only celecoxib inhibited bone progression in SKGc and OB differentiation and bone mineralization in the BdCs of mice and AS patients via CDH11/WNT signaling, independent of the COX-2 inhibition. [BMB Reports 2025; 58(3): 140-145].


Conflict of interest statement

CONFLICTS OF INTEREST

The authors have no conflicting interests.

Figures
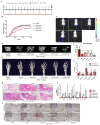
Fig. 1
Fig. 1
Celecoxib inhibits the development of arthritis and bone formation in SKGc mice. (A) NSAIDs were administered to SKG mice for 8 weeks after the injection of curdlan (3 mg/kg), and the MS was measured twice per week for up to 8 weeks. (B) The MSs of mice treated with various NSAIDs and etanercept. (C) MPO activity, measured using in vivo imaging system (IVIS) at the end of 8 weeks. (D) Representative images of the micro-CT of trabecular bones in the femur of mice at the end of 8 weeks. (E) The BMD findings of mice treated with various NSAIDs and etanercept. (F) Representative images of ankle joints in SKG mice obtained with micro-CT at the end of 8 weeks. The red circles indicate abnormal bone formation. (G) Analysis of CT scores for bone erosion and formation (n = 5 for each group). (H) Representative ankle joint tissues stained with H&E at the end of 8 weeks. (I) The mRNA expression levels of ALP, OCN, OPN, and osterix relative to 18S rRNA in the ankle joint tissues of mice (n = 5 for each group). (J) Representative images of ankle joint tissues stained with antibodies against OCN and OPN. Values are presented as the mean ± SD; *P < 0.05 and **P < 0.01, based on the Mann–Whitney U test.
Fig. 2
Fig. 2
Celecoxib and DM–celecoxib decrease osteogenic differentiation and bone mineralization. Various concentrations of NSAIDs were administered to mice primary osteoprogenitor cell culture system: celecoxib at (20 and 50) μM (C20 and C50, respectively), DM–celecoxib at 20 μM (DM20), etoricoxib at (10 and 20) μM (E10 and E20, respectively), and naproxen at (100 and 200) μM (N100 and N200, respectively). (A) ALP and ARS staining results on d (7 and 21), and (B) the analysis of ALP and ARS activity. (C) The mRNA levels of OCN on d (7 and 21). (D) The same concentrations and types of NSAIDs were applied to SaOS2 cells for (3 or 14) d. ALP and ARS staining results on d (3 and 14), and (E) the analysis of ALP and ARS activity. (F, G) NSAIDs were applied to mouse OBs from d (8 to 21). (F) OBs stained with ALP and ARS on d 21, and (G) the ALP and ARS staining activity findings. (H) Various concentrations of NSAIDs were administered to BdCs from SpA patients. ALP and ARS staining findings on d (3 and 14). (I) Analysis of the activity of ALP. Values are presented as the mean ± SD; *P < 0.05 and **P < 0.01, based on the Mann–Whitney U test.
Fig. 3
Fig. 3
Structural modeling of celecoxib and DM–celecoxib binding to CDH11. (A) The EC1 homodimer interface of CDH11 (PDB: 2A4C). Patch–A is a hydrogen-bonding concave surface that binds two W residues from the partner EC1 monomer. Patch–B is a hydrophobic interaction pocket. (B) The structure and binding affinity prediction for CDH11-NSAID complexes. The top four binding models are represented. ns, not significant. Values are presented as the mean ± SD; **P < 0.01 and ***P < 0.001, based on the Mann–Whitney U test.
Fig. 4
Fig. 4
Celecoxib suppresses CDH11-mediated β–catenin signaling. (A) Immunohistochemical staining of CDH11 in the ankle joints of SKGc mice treated with various NSAIDs. Scale bar = 100 μm. Relative expression of the CDH11 mRNA level: (B) in the ankle joints of SKGc mice, and (C) in primary mice OBs. (D) Immunoblot analysis of CDH11, β–catenin, TCF−4, and GAPDH in mouse OBs during OB differentiation and mineralization. (E) Quantitation of the result from (D) (n = 3 for each group). Values are presented as the mean ± SD; *P < 0.05, and **P < 0.01, based on the Mann–Whitney U test. Confocal images of immunocytochemical staining: (F) for CDH11 (top left, green) and F–actin (top right, red), and (G) for β–catenin (top left, green) and CDH11 (top right, red) in SaOS2 cells (n = 3 for each group). Scale bar = 50 μm (F), and 20 μm (G). The nuclei were counterstained with DAPI (blue). Arrows in E indicate colocalization on the cell surface.

References

    1. Tseng HW, Pitt ME, Glant TT, et al. Inflammation-driven bone formation in a mouse model of ankylosing spondylitis: sequential not parallel processes. Arthritis Res Ther. 2016;18:35. doi: 10.1186/s13075-015-0805-0. - DOI - PMC - PubMed
    1. Emond B, Ellis LA, Chakravarty SD, Ladouceur M, Lefebvre P. Real-world incidence of inflammatory bowel disease among patients with other chronic inflammatory diseases treated with interleukin-17a or phosphodiesterase 4 inhibitors. Curr Med Res Opin. 2019;35:1751–1759. doi: 10.1080/03007995.2019.1620713. - DOI - PubMed
    1. Chai W, Lian Z, Chen C, Liu J, Shi LL, Wang Y. JARID1A, JMY, and PTGER4 polymorphisms are related to ankylosing spondylitis in Chinese Han patients: a case-control study. PLoS One. 2013;8:e74794. doi: 10.1371/journal.pone.0074794.0b2a0f89e2004eb4bf86ea0b712002b5 - DOI - PMC - PubMed
    1. Evans DM, Spencer CC, Pointon JJ, et al. Interaction between ERAP1 and HLA-B27 in ankylosing spondylitis implicates peptide handling in the mechanism for HLA-B27 in disease susceptibility. Nat Genet. 2011;43:761–767. doi: 10.1038/ng.873. - DOI - PMC - PubMed
    1. Mano M, Arakawa T, Mano H, et al. Prostaglandin E2 directly inhibits bone-resorbing activity of isolated mature osteoclasts mainly through the EP4 receptor. Calcif Tissue Int. 2000;67:85–92. doi: 10.1007/s00223001102. - DOI - PubMed

MeSH terms