. 2025 Jan 6;10(1):5.
doi: 10.1038/s41392-024-02093-8.

A pan-immune panorama of bacterial pneumonia revealed by a large-scale single-cell transcriptome atlas

Affiliations

A pan-immune panorama of bacterial pneumonia revealed by a large-scale single-cell transcriptome atlas

Kun Xiao et al. Signal Transduct Target Ther. .

Abstract

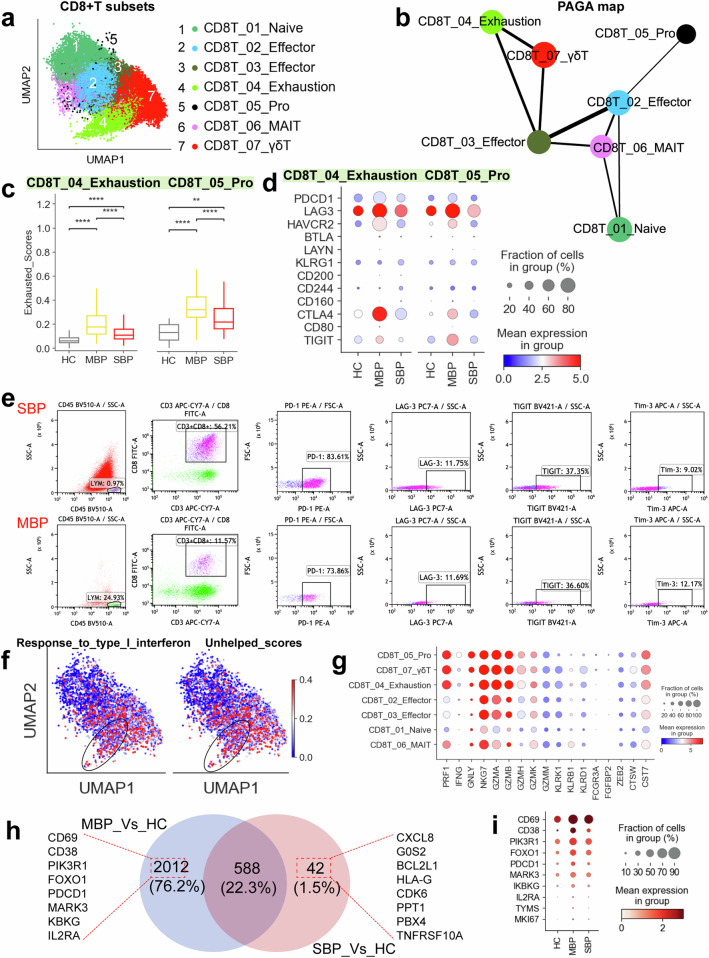
Bacterial pneumonia is a significant public health burden, contributing to substantial morbidity, mortality, and healthcare costs. Current therapeutic strategies beyond antibiotics and adjuvant therapies are limited, highlighting the need for a deeper understanding of the disease pathogenesis. Here, we employed single-cell RNA sequencing of 444,146 bronchoalveolar lavage fluid cells (BALFs) from a large cohort of 74 individuals, including 58 patients with mild (n = 22) and severe (n = 36) diseases as well as 16 healthy donors. Enzyme-linked immunosorbent and histological assays were applied for validation within this cohort. The heterogeneity of immune responses in bacterial pneumonia was observed, with distinct immune cell profiles related to disease severity. Severe bacterial pneumonia was marked by an inflammatory cytokine storm resulting from systemic upregulation of S100A8/A9 and CXCL8, primarily due to specific macrophage and neutrophil subsets. In contrast, mild bacterial pneumonia exhibits an effective humoral immune response characterized by the expansion of T follicular helper and T helper 2 cells, facilitating B cell activation and antibody production. Although both disease groups display T cell exhaustion, mild cases maintained robust cytotoxic CD8+T cell function, potentially reflecting a compensatory mechanism. Dysregulated neutrophil and macrophage responses contributed significantly to the pathogenesis of severe disease. Immature neutrophils promote excessive inflammation and suppress T cell activation, while a specific macrophage subset (Macro_03_M1) displaying features akin to myeloid-derived suppressor cells (M-MDSCs) suppress T cells and promote inflammation. Together, these findings highlight potential therapeutic targets for modulating immune responses and improving clinical outcomes in bacterial pneumonia.


Conflict of interest statement

Competing interests: The authors declare no competing interests.

Figures

Fig. 1
Fig. 1
An overview of the study design and results for the BALF single-cell transcriptomic study. a Diagram outlining the overall study design, which included 74 individuals, including 58 patients (22 patients with mild disease and 36 patients with severe disease) and 16 healthy donors. b The clustering result (Left row) of 65 cell subtypes (right row) from 74 samples. Each point represents one single cell, colored according to cell type. c UMAP projection of the healthy donors, mild and severe. d Disease preference of major cell clusters as estimated using RO/E. e Representative images of hematoxylin and eosin staining of lung sections from patients with severe bacterial pneumonia (MSP01). Scale bars, 20 μm (main image; Left) and 20 μm (Magnified images, Right)
Fig. 2
Fig. 2
Myeloid cells are the primary contributors to the production of pro-inflammatory cytokines in severe patients. a UMAP projections of BALFs. Colored based on the eight major cell types (top left), eight hyper-inflammatory cell subtypes (top right), cytokine score (Middle), and inflammatory score (Bottom). b Pie charts depicting the relative contribution of each inflammatory cell subtype to the cytokine and inflammatory scores in severe patients. c Heatmap depicting the expression of cytokines within each hyper-inflammatory cell subtype identified. d Lollipop chart depicting the relative contribution of the top ten cytokines in patients with severe disease. e Box plots of cytokine expression based on scRNA-seq and plasma profiling for healthy controls, mild patients, and severe patients. Significance was evaluated using the Kruskal–Wallis test with Bonferroni correction significance was evaluated using the Kruskal–Wallis test with Bonferroni correction (*p < 0.05, **p < 0.01, ***p < 0.001, ****p < 0.0001, nsp > 0.05). f Heatmap plots of the sum of significant interaction among the eight hyper-inflammatory cell subtypes. g Dot plot of the interactions among inflammatory macrophages in severe patients. P values are indicated by the circle sizes, as shown in the scale on the right
Fig. 3
Fig. 3
Immunological features of CD4+ T cell subsets. a The clustering result (Left row) of 15 CD4+ T cell types (right row) from 74 samples. Each point represents one single cell, colored according to the CD4+ T cell subtype. b Correlation between plasmablast with Tfh cells in mild patients. c Dot plots showing the expression of selected genes in Th2 cells across disease conditions. d UMAPs illustrating IFN-I response and unhelped signature scores for each CD4+ T cell. The red circle highlights the CD4T_14_Exhaustion cluster, which is characterized by high expression of interferon-I (IFN-I) response genes and an unhelped T cell signature. e Flow cytometry plots showing gating strategy and typical exhausted molecules in CD8+T cells from bacterial pneumonia (Top row: severe bacterial pneumonia; Bottom row: mild bacterial pneumonia). f Dot plots showing the cell exhaustion-related markers in CD4_13_Pro and CD4T_14_Exhaustion across disease conditions. g Venn diagram illustrating the number of upregulated genes in CD4+ T cells. h Enriched GO biological process terms for upregulated genes in CD4+ T cells from mild (Left) and severe (Right) disease. Only select terms are shown. i Dot plots showing CD4+ T cells related genes across disease conditions
Fig. 4
Fig. 4
Immunological features of CD8+ T cell subsets. a The clustering result (Left row) of seven CD8+ T cell types (right row) from 37 samples. Each point represents one single cell, colored according to cell type. b PAGA analysis of CD8+ T cell pseudo-time: the associated cell type and the corresponding status are listed. c Box plots showing the exhausted scores in CD8_04_Exhaustion and CD8_05_Pro subsets across disease conditions. Significance was evaluated using the Kruskal–Wallis test with Bonferroni correction (*p < 0.05, **p < 0.01, ***p < 0.001, ****p < 0.0001, nsp > 0.05). d Dot plots showing the cell exhaustion-related markers in CD8_04_Exhaustion and CD8_05_Pro subsets across disease conditions. e Flow cytometry plots showing gating strategy and typical exhausted molecules in CD8+ T cells from patients with severe (top row) and mild (below row) bacterial pneumonia. f UMAPs illustrating IFN-I response and unhelped signature scores for each CD8+ T cell. g Dot plots showing the cytotoxicity-related genes in CD8+ T cell subsets in patients with bacterial pneumonia. h Venn diagram illustrating the number of upregulated genes in CD8+ T cells. i Dot plots showing the activation-related genes in CD8+ T cell across disease conditions
Fig. 5
Fig. 5
Immunological features of neutrophils. a The clustering result (Left row) of neutrophil subtypes (right row) from 74 samples. Each point represents one single cell, colored according to the neutrophil subtype. b UMAP plot of neutrophil clusters showing disease distribution. c PAGA analysis of neutrophil pseudo-time: the associated cell type and the corresponding status are listed. d Heatmap plots of selected genes in immature neutrophil subset across disease conditions. e Violin plots of S100A8, S100A9, and S100A12 in immature neutrophil subset across disease conditions. f Heatmap plots of the sum of significant interaction between immature neutrophil clusters (Neu_01/02_Immature) and T cell subtypes in severe patients. g Venn diagram illustrating the number of upregulated genes in neutrophils. h Enriched GO biological process terms for upregulated genes in neutrophils from severe disease. Only select terms are shown. i Box plots showing the functional scores in neutrophils across disease conditions. Significance was evaluated using the Kruskal–Wallis test with Bonferroni correction (*p < 0.05, **p < 0.01, ***p < 0.001, ****p < 0.0001, nsp > 0.05)
Fig. 6
Fig. 6
Immunological features of macrophages. a The clustering result (Left row) of macrophage subtypes (right row) from 74 samples. Each point represents one single cell, colored according to the macrophage subtype. b Pie charts depicting the relative percentage of macrophage subtype in mild (Left row) and severe (Right row) patients. c Box plots showing the expression scores of PD-L1 and IDO1 in macrophage subtypes. d Dot plots showing the inflammation-related genes in macrophage subtypes. e Venn diagram illustrating the number of upregulated genes in Macro_03_M1. f Enriched GO biological process terms for upregulated genes in Macro_03_M1 from severe disease. Only select terms are shown. g Heatmap plots of the sum of significant interaction between Macro_03_M1 and T cell subsets. h A representative multicolor immunohistochemical (IHC) stained lung section from the SBP group is shown. Macrophages, CD8+ T cells, and CD8+PD1+ T cells are indicated by green, red, and yellow solid arrows, respectively. Interactions between macrophages and CD8+ T cell subsets are highlighted with white dotted arrows. Scale bars, 2000 μm (main image; Left) and 20 μm (Magnified images, Middle and Right)

References

    1. Liu, Y. N. et al. Infection and co-infection patterns of community-acquired pneumonia in patients of different ages in China from 2009 to 2020: a national surveillance study. Lancet Microbe4, e330–e339 (2023). - PubMed
    1. Jia, L. et al. Targeting complement hyperactivation: a novel therapeutic approach for severe pneumonia induced by influenza virus/staphylococcus aureus coinfection. Signal Transduct. Target Ther.8, 467 (2023). - PMC - PubMed
    1. Fan, G. et al. The mortality and years of life lost for community-acquired pneumonia before and during COVID-19 pandemic in China. Lancet Reg. Health West Pac.42, 100968 (2024). - PMC - PubMed
    1. Martin-Loeches, I. et al. ERS/ESICM/ESCMID/ALAT guidelines for the management of severe community-acquired pneumonia. Eur. Respir. J.61, 615–632 (2023). - PubMed
    1. Roquilly, A. et al. Interferon gamma-1b for the prevention of hospital-acquired pneumonia in critically ill patients: a phase 2, placebo-controlled randomized clinical trial. Intensive Care Med.49, 530–544 (2023). - PMC - PubMed

MeSH terms

LinkOut - more resources