. 2025 Feb;35(2):97-116.
doi: 10.1038/s41422-024-01060-w. Epub 2025 Jan 6.

Nonenzymatic lysine D-lactylation induced by glyoxalase II substrate SLG dampens inflammatory immune responses

Affiliations

Nonenzymatic lysine D-lactylation induced by glyoxalase II substrate SLG dampens inflammatory immune responses

Qihang Zhao et al. Cell Res. 2025 Feb.

Abstract

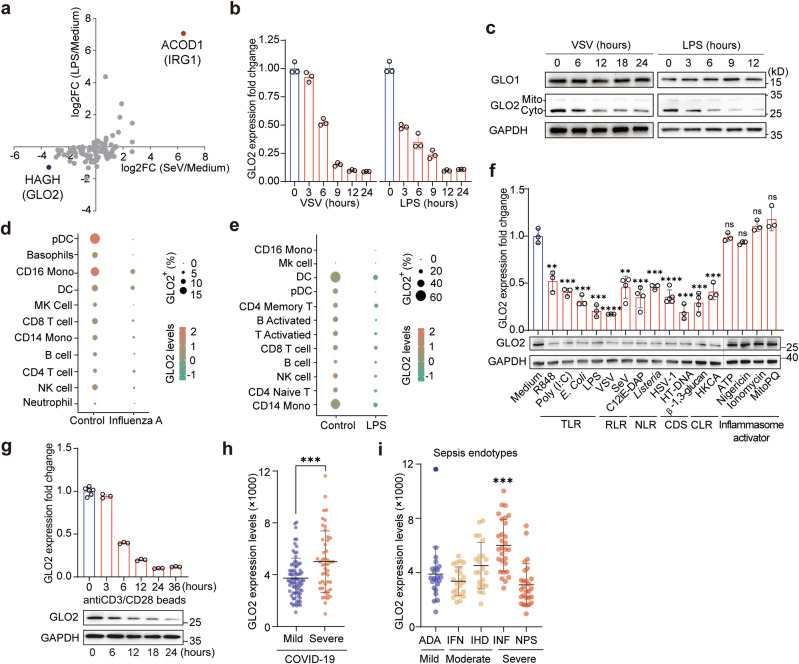
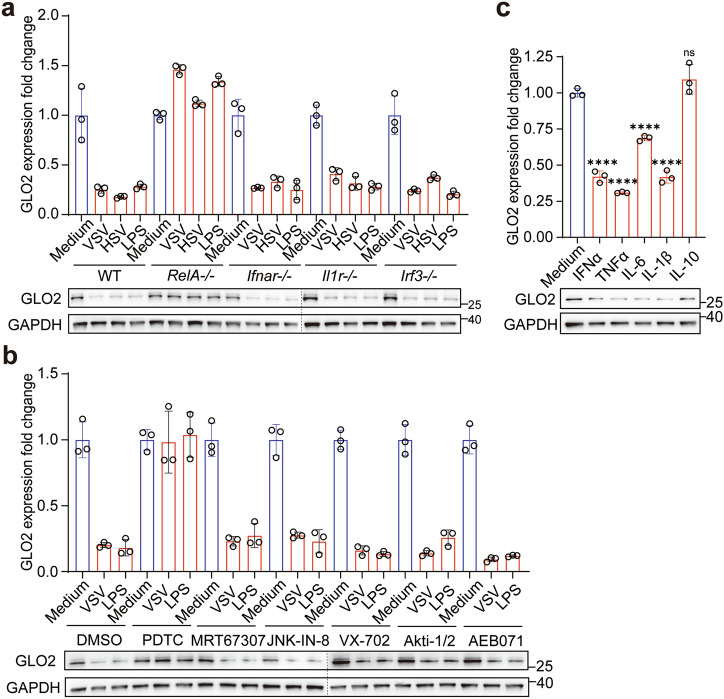
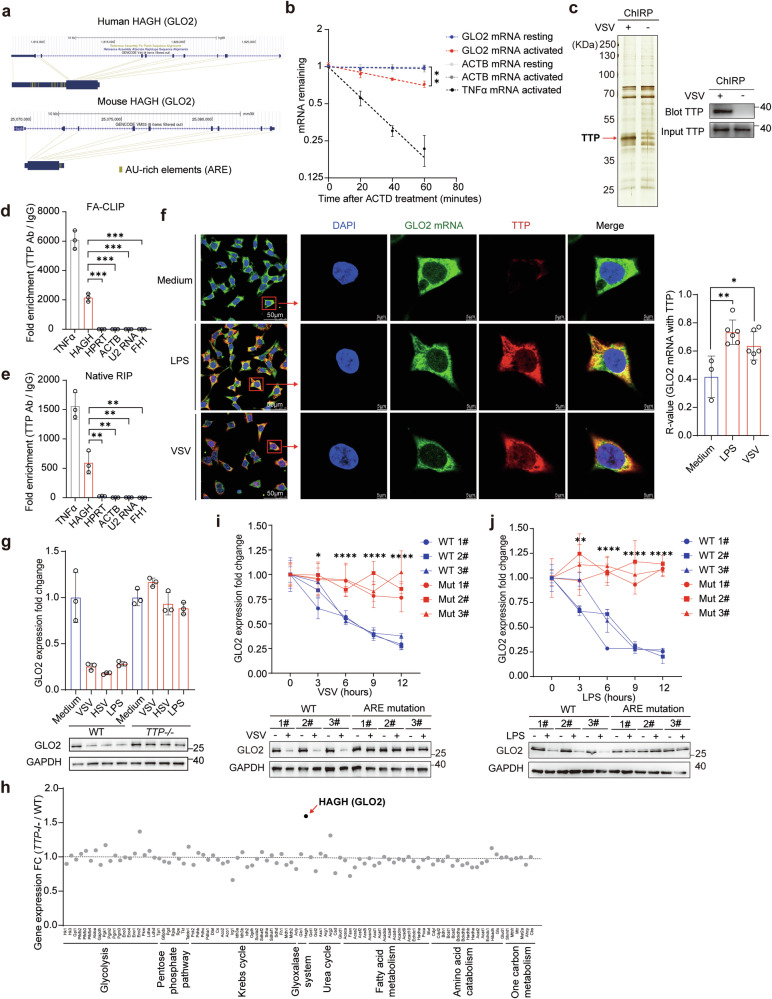
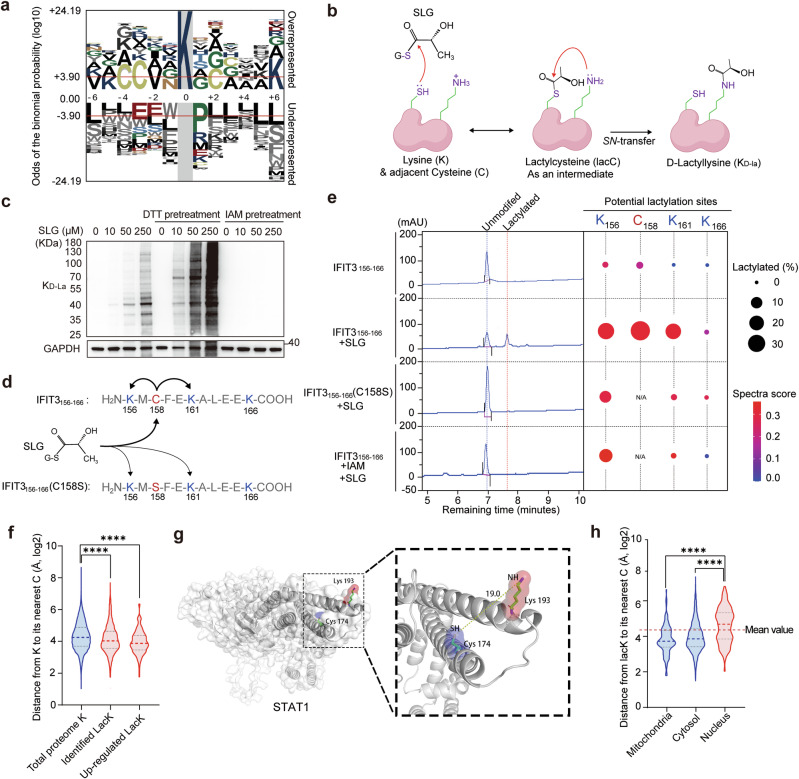
Immunometabolism is critical in the regulation of immunity and inflammation; however, the mechanism of preventing aberrant activation-induced immunopathology remains largely unclear. Here, we report that glyoxalase II (GLO2) in the glycolysis branching pathway is specifically downregulated by NF-κB signaling during innate immune activation via tristetraprolin (TTP)-mediated mRNA decay. As a result, its substrate S-D-lactoylglutathione (SLG) accumulates in the cytosol and directly induces D-lactyllysine modification of proteins. This nonenzymatic lactylation by SLG is greatly facilitated by a nearby cysteine residue, as it initially reacts with SLG to form a reversible S-lactylated thiol intermediate, followed by SN-transfer of the lactyl moiety to a proximal lysine. Lactylome profiling identifies 2255 lactylation sites mostly in cytosolic proteins of activated macrophages, and global protein structure analysis suggests that proximity to a cysteine residue determines the susceptibility of lysine to SLG-mediated D-lactylation. Furthermore, lactylation is preferentially enriched in proteins involved in immune activation and inflammatory pathways, and D-lactylation at lysine 310 (K310) of RelA attenuates inflammatory signaling and NF-κB transcriptional activity to restore immune homeostasis. Accordingly, TTP-binding site mutation or overexpression of GLO2 in vivo blocks this feedback lactylation in innate immune cells and promotes inflammation, whereas genetic deficiency or pharmacological inhibition of GLO2 restricts immune activation and attenuates inflammatory immunopathology both in vitro and in vivo. Importantly, dysregulation of the GLO2/SLG/D-lactylation regulatory axis is closely associated with human inflammatory phenotypes. Overall, our findings uncover an immunometabolic feedback loop of SLG-induced nonenzymatic D-lactylation and implicate GLO2 as a promising target for combating clinical inflammatory disorders.


Conflict of interest statement

Competing interests: The authors declare no competing interests.

Figures

Fig. 1
Fig. 1. GLO2 is downregulated after immune activation in immune cells.
a RNA-seq data profiling of metabolic enzymes in mouse macrophages stimulated by Sendai virus (SeV) (12 h, MOI = 1) or LPS (6 h, 100 ng/mL). The untreated control group (Medium) is set to a value of 1. b, c Q-PCR (b) and Immunoblotting (c) analysis of indicated gene expression in BMDMs infected by VSV (MOI = 1) or LPS for indicated time points. Unless noted otherwise, all results in this and other figures were representative of at least three independent experiments. Q-PCR data are normalized to hypoxanthine-guanine phosphoribosyltransferase (HPRT) levels, and the medium group is set to a value of 1. Unless noted otherwise, the error bars in this and all other panels denote SD. d, e scRNA-seq analysis of GLO2 levels in different immune cells from human PBMCs infected by influenza A virus (GSE243629) (d) or stimulated by LPS (GSE226488) (e). f Q-PCR and immunoblot analysis of indicated gene expression in BMDMs stimulated as indicated. HKCA heat-killed preparation of Candida albicans, MitoPQ MitoParaquat. g Q-PCR and immunoblot analysis of indicated gene expression in CD3+ T cells separated from human PBMCs and then stimulated by anti-CD3/CD28 beads for indicated time points. h GLO2 levels in the expression profiling data of leukocytes from 124 patients with mild or severe COVID-19 (GSE221234). i GLO2 levels in leukocytes from patients with different sepsis endotypes in COVID-19. ADA Adaptive, IFN Interferon, IHD Innate-Host-Defense, INF Inflammatory, NPS Neutrophilic-Suppressive.
Fig. 2
Fig. 2. Downregulation of GLO2 depends on the NF-κB signaling pathway.
a Q-PCR and immunoblot analysis of indicated gene expression in WT or gene-knockout BMDMs stimulated as indicated. b Q-PCR and immunoblot analysis of indicated gene expression in BMDMs pretreated with indicated inhibitors for 1 h and then stimulated by VSV or LPS. c Q-PCR and immunoblot analysis of indicated gene expression in BMDMs stimulated by recombinant cytokines.
Fig. 3
Fig. 3. TTP binds to GLO2 mRNA and mediates its decay.
a Diagram of AU-rich elements (AREs) in the human and mouse GLO2 3′-UTRs. b Q-PCR analysis of indicated mRNAs in resting or LPS-activated (6 h, 100 ng/mL) BMDMs treated with ACTD (5 μM) for indicated time points. c GLO2 mRNA along with its binding proteins were retrieved (through ChIRP) in resting or VSV-activated human THP-1-derived macrophages and the specific band was identified by MS or immunoblot with a TTP antibody. d, e Q-PCR analysis of indicated mRNAs retrieved by TTP antibody or control antibody from BMDMs under crosslinked (d) or native (e) conditions. f RNA FISH of GLO2 mRNA and immunofluorescence assay of TTP protein in human THP-1-derived macrophages stimulated with LPS, VSV or not (medium). Scale bars, 5 μm. The co-localization was analyzed by ImageJ. g Q-PCR and immunoblot analysis of GLO2 expression in WT and TTP−/− BMDMs stimulated as indicated. h RNA-seq data profiling of metabolic enzymes in WT and TTP−/− BMDMs stimulated by LPS for 6 h (GSE63468). i, j Q-PCR and immunoblot analysis of GLO2 expression in WT or GLO2 ARE-sites mutant RAW 264.7 cell lines stimulated by VSV (i) or LPS (j) for indicated time points.
Fig. 4
Fig. 4. SLG accumulates after GLO2 downregulation and directly induces nonenzymatic d-lactylation.
a Diagram of GSH-dependent glyoxalase pathway and the corresponding pharmacological inhibitors. b Enzymatic activity detection of GLO2 in innate immune cells stimulated as indicated. c Targeted LC–MS quantification of SLG in BMDMs stimulated as indicated. d Relative quantification of D-Lactate in BMDMs stimulated as indicated. e LC–MS quantification of SLG in BMDMs treated with DiFMOC-G (0.4 μM) or BrBzGCp2 (5 μM) for 24 h. f Schematic outlines of nucleophilic substitution reaction between SLG and a lysine residue. g Schematic diagram of the three isomer modifications and their different metabolic derivation: KL-La, KD-La, and KCE. h Immunoblot of KD-La levels in innate immune cells stimulated as indicated for 12 h. i Diagram of antibody-enriched lacK peptide identification by LC–MS/MS in BMDMs (left) and fold change of the identified lacK peptides by VSV activation. n = 3 (right). j, k Immunoblot of KD-La levels in BSA (j) or macrophage lysate (k) denatured by boiling or not, then co-incubated with indicated concentration of SLG for 4 h at 37 °C. l Immunoblot of KD-La levels in BMDMs pretreated with indicated concentrations of DiFMOC-G for 24 h. m Immunoblot of KD-La levels in BMDMs pretreated with indicated concentrations of BrBzGCP2 then stimulated by VSV or not. n Immunoblot detection of KD-La levels in Hagh+/+ and Hagh−/− BMDMs. o, p Immunoblot of KD-La levels in BMDMs from WT and GLO2-overexpression (GLO2 OE) mice stimulated by VSV (o) or LPS (p) for indicated time points.
Fig. 5
Fig. 5. SLG-induced d-lactylation is catalyzed by its adjacent cysteine.
a Motif analysis of peptide sequences around lacK sites identified in macrophages. b Nucleophilic substitutions between SLG and lysine were catalyzed by an adjacent cysteine residue. c Immunoblot of KD-La level in BMDM lysates pretreated with DTT (5 mM) or IAM (10 mM), then co-incubated with the indicated concentration of SLG. d Sequence of synthesized WT or mutated IFIT3156-166 peptide and their presumed reaction mechanism with SLG. e LC–MS detection of peptide lactylation (left) and LC–MS/MS detection of lactylation sites (right) on WT or mutated IFIT3156-166 peptides pretreated with IAM (10 mM) or not followed by SLG (1 mM) co-incubation. f Distance between different lysine (K) ε-amine groups and the spatially closest cysteine (C) β-thiol in these 3D protein structures (KC distance) calculated using Python. g 3D structure of STAT1 (PDB 1YVL) and the distance from K193 to its nearest cysteine C174. h KC distance of lacK sites we identified with different subcellular localizations.
Fig. 6
Fig. 6. The d-lactylation targets the immune pathway and reduces innate inflammatory signaling.
a Volcano plot of lacK modification sites identified in macrophages with or without VSV stimulation, n = 3 (upper); GO biological process and KEGG pathway enrichment (lower) of genes with upregulated and downregulated lacK levels. b Immunoblot of levels of different lactylation isomers of RelA proteins from VSV- or LPS-stimulated macrophages by endogenous immunoprecipitation. c Schematic outlines of the use of lacK pyrrolysyl-tRNA synthetase (PylRS) and its cognate tRNAPyl to mediate site-specific lactylation of RelA protein (lacK310) in mammalian cells. d Side chain structure of lysine (K), arginine (R), and lactyllysine (lacK) residues. e Immunoblot of WT, site mutant (K310R), and site-specific lactylated (lacK310) RelA proteins purified from human HEK-293T cells. f The crystal structure of RelA, IκBα, and p50 complex (PDB 1NFI); enlarged region shows the interface of RelA and IκBα around the K310 residue. g Immunoblot detection of indicated proteins co-immunoprecipitated by Flag-tagged WT, K310R mutant, or lacK310 RelA. All RelA proteins were pre-incubated with SLG (1 mM) and then incubated with BMDM cell lysates. h Immunofluorescence analysis of WT, K310R, and lacK310 RelA in TLR4-expressing HEK-293T cells co-transfected with IκB stimulated by LPS. Scale bars, 5 μm. i ChIP analysis of the binding ability of WT, K310R, and lacK310 RelA with indicated gene promoters. j BLI analysis of the binding ability of WT, K310R, and lacK310 RelA with NF-κB-binding DNA fragments. k NF-κB luciferase activities in HEK-293T co-transfected with RelA (WT or K310R) and different amounts of IκBα and then treated with DiFMOC-G (0.4 μM). Data were normalized to renilla luciferase, n = 6.
Fig. 7
Fig. 7. The GLO2 feedback axis regulates inflammatory responses and immune activation in vitro.
a Immunoblot detection of indicated proteins and their phosphorylation in tamoxifen-treated BMDMs from Haghfl/fl and Haghfl/flLyz2creERT2 (Hagh−/−) mice. Cells were stimulated by VSV or LPS for indicated time points. b, c GSEA analysis of RNA-seq data of Haghfl/fl and Hagh−/− BMDMs stimulated by VSV for 9 h. d, e ELISA detection of indicated cytokines in medium supernatants of Haghfl/fl and Hagh−/− BMDMs stimulated as indicated. f Immunoblot detection of indicated proteins in Haghfl/fl and Hagh−/− BMDMs stimulated by VSV or LPS for indicated time points. g Immunoblot detection of indicated proteins and their phosphorylation in BMDMs from WT and GLO2 OE mice. Cells were stimulated by VSV or LPS for indicated time points. h, i ELISA detection of indicated cytokines in medium supernatants of WT and GLO2 OE BMDMs stimulated as indicated VSV (h) and LPS (i). j, k Q-PCR analysis of indicated gene expression in WT or GLO2 ARE-sites mutant RAW 264.7 cells stimulated by VSV (9 h) (j) or LPS (2 h) (k). l Cytometric Bead Array System (CBA) detection of indicated cytokines in medium supernatants of human PBMC stimulated by VSV or LPS with 12 h pretreatment of DiFMOC-G (0.4 μM).
Fig. 8
Fig. 8. Genetic manipulation of GLO2 alters inflammatory responses and immunopathology in vivo.
a Experimental schematic outlines of in vivo challenges with VSV and LPS in tamoxifen-induced Hagh knockout mice. b, c ELISA detection of indicated cytokines in the serum of Haghfl/fl and Hagh−/− mice i.p. injected with VSV (b) or LPS (c) for 12 h. d H&E staining of lung tissues of Haghfl/fl and Hagh−/− mice after i.p. injected with VSV or LPS for 24 h. Scale bars, 50 mm. e Survival of Haghfl/fl and Hagh−/− mice i.p. injected with VSV or LPS. f Experimental schematic outlines of in vivo challenges with VSV and LPS in GLO2 OE mice. g, h ELISA detection of indicated cytokines in the serum of WT and GLO2 OE mice i.p. injected with VSV (g) or LPS (h) for 12 h. i Survival of WT and GLO2 OE mice i.p. injected with VSV or LPS.
Fig. 9
Fig. 9. Targeting GLO2 through pharmacologic inhibition demonstrates promising effects in the treatment of inflammatory and autoimmune diseases.
a Experiment design of acute inflammation and cytokine storm mouse model. b, c ELISA detection of indicated cytokines in the serum of mice pretreated with DiFMOC-G (800 μg/g) then i.p. injected with VSV (b) or LPS (c) for 12 h. df Survival of mice pretreated with DiFMOC-G then i.p. injected with VSV (d), LPS (e), or intravenously (i.v.) injected with Poly (I:C) (f). g Experimental design for the TNBS-induced colitis model. h Body weight of TNBS-induced colitis mice i.p. treated with or without DiFMOC-G. i Survival of colitis mice i.p. treated with or without DiFMOC-G. j H&E staining of colon tissues from colitis mice i.p. treated with or without DiFMOC-G. Scale bars, 50 mm. k, l Targeted LC–MS quantification of SLG (k) or immunoblot detection of lacK levels (l) in VSV-stimulated PBMCs from young (< 25 years old) and elderly (> 70 years old) donors with no obvious metabolic diseases. m Experimental design for generating aging-related inflammatory mouse model. n Q-PCR analysis of indicated gene expression in the indicated tissues from young (8 weeks) or elderly mice (20 months) i.p. treated with or without DiFMOC-G. o Working model of glyoxalase II downregulation feedback orchestrates immune response via its substrate SLG-inducing d-lactylation.

References

    1. Afonina, I. S., Zhong, Z., Karin, M. & Beyaert, R. Limiting inflammation-the negative regulation of NF-kappaB and the NLRP3 inflammasome. Nat. Immunol.18, 861–869 (2017). - PubMed
    1. York, A. G. et al. IL-10 constrains sphingolipid metabolism to limit inflammation. Nature627, 628–635 (2024). - PMC - PubMed
    1. Raghuraman, S., Donkin, I., Versteyhe, S., Barres, R. & Simar, D. The emerging role of epigenetics in inflammation and immunometabolism. Trends Endocrinol. Metab.27, 782–795 (2016). - PubMed
    1. Liu, J. & Cao, X. RBP-RNA interactions in the control of autoimmunity and autoinflammation. Cell Res.33, 97–115 (2023). - PMC - PubMed
    1. Ribet, D. & Cossart, P. Pathogen-mediated posttranslational modifications: a re-emerging field. Cell143, 694–702 (2010). - PMC - PubMed

LinkOut - more resources