. 2025 Jan 17;14(1):113-128.
doi: 10.1021/acssynbio.4c00436. Epub 2025 Jan 6.

Enhancing Chitin Production as a Fermentation Byproduct through a Genetic Toolbox That Activates the Cell Wall Integrity Response

Affiliations

Enhancing Chitin Production as a Fermentation Byproduct through a Genetic Toolbox That Activates the Cell Wall Integrity Response

An Nguyen et al. ACS Synth Biol. .

Abstract

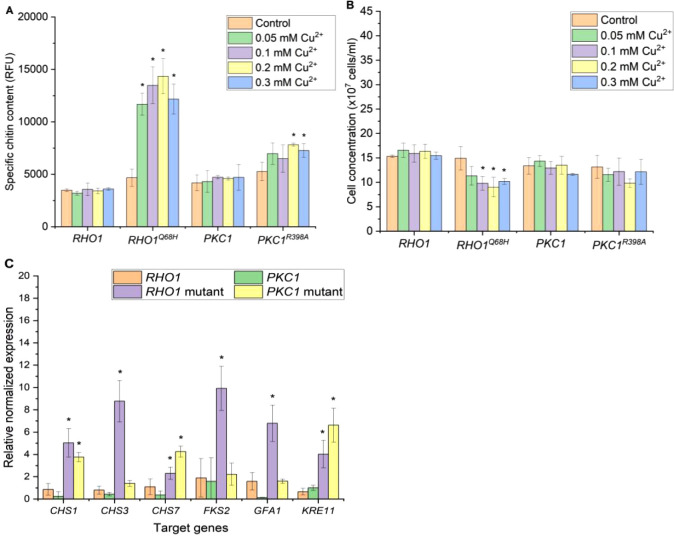
Often, the value of the whole biomass from fermentation processes is not exploited, as commercial interests are focused on the main product that is typically either accumulated within cells or secreted into the medium. One underutilized fraction of yeast cells is the cell wall that contains valuable polysaccharides, such as chitin, known for its biocompatibility and biodegradability, which are thought of as valuable properties in diverse industries. Therefore, the valorization of waste biomass from fermentation to coproduce chitin could significantly improve the overall profitability and sustainability of biomanufacturing processes. Previous studies revealed that environmental stresses trigger the cell wall integrity (CWI) response, leading to an increased level of chitin synthesis as a protective measure. In this study, we evaluated the use of the key regulatory genes of the CWI response, RHO1 and PKC1, and their mutant forms RHO1Q68H and PKC1R398A, to design a genetic switch that provides control over the CWI response to maximize the chitin content in the cell wall. The generated genetic control elements were introduced into different yeast strains, among others, for the coproduction of chitin with either storage lipids or recombinant proteins. Overall, we successfully increased the chitin content in the yeast cell wall up to five times with our optimized setup. Furthermore, similar improvements in chitin production were seen when coproducing chitin with either storage lipids or a secreted acid phosphatase. Our results successfully demonstrated the potential of maximizing the chitin content in the cell wall fraction while producing other intra- or extracellular compounds, showcasing a promising approach for enhancing the efficiency and sustainability of fermentation processes. Moreover, the chitin produced in the cell wall is indistinguishable from the chitin isolated from crustaceans.

Keywords: PKC1; RHO1; Saccharomyces cerevisiae; cell wall integrity pathway; chitin; coproduction.


Conflict of interest statement

The authors declare no competing financial interest.

Figures

Figure 1
Figure 1
Cell wall integrity pathway (CWI) controls chitin synthesis in the cell wall of S. cerevisiae. The stress signals are detected by the sensors on the plasma membrane, which then recruit guanine exchange factors (GEFs) to activate the G-protein (Rho1). Subsequently, Rho1 interacts with and activates protein kinase C (Pkc1). The signal is then amplified through a MAPK cascade. One significant outcome of this pathway is the overexpression of transcription factor Rlm1, which regulates numerous genes related to cell wall biosynthesis. Rlm1 enhances chitin synthesis via the upregulation of GFA1 to increase the production of chitin precursor GlcNAc, and CHS7 to aid the post-translational mobilization of the primary chitin synthesis enzyme in yeast, Chs3. Besides promoting chitin synthesis via the MAPK cascade, Rho1 and Pkc1 also play essential roles in the phosphorylation and mobilization of Chs3 to the plasma membrane.
Figure 2
Figure 2
Specific chitin content (A) and final cell concentration (B) of yeast strains with overexpressed CWI genes under the control of constitutive promoters PTEF1 and PGPD. The control strain contained an empty plasmid. Cells were grown in SD-Ura containing 2% glucose for 24 h before chitin content, and the final cell concentrations were recorded. The specific chitin content is reported as relative fluorescence units (RFU) measured from staining 2 × 10⁷ cells with Calcofluor White. The data represent the mean and standard deviation from three independent experiments. *p < 0.05 indicates a significant difference compared to the control strain using a two-tailed Student’s t test.
Figure 3
Figure 3
Specific chitin content (A) and final cell concentration (B) of yeast strains with overexpressed CWI genes under the control of the GAL1 promoter (PGAL1). Samples were analyzed 18 h after induction with various galactose concentrations (0% to 2%). Noninduced cultures served as controls. The specific chitin content is reported as relative fluorescence units (RFU) measured from staining 2 × 10⁷ cells with Calcofluor White. The data represent the mean and standard deviation from three independent experiments. (C) Expression of CWI target genes analyzed by real-time PCR. RNAs were extracted from yeast samples 18 h after induction with 0.5% galactose, and noninduced cultures served as controls. The data represent the mean and standard deviation from a minimal of two independent experiments. *p < 0.05 indicates a significant difference compared to the control strain using unpaired Student’s t test.
Figure 4
Figure 4
Specific chitin content (A) and final cell concentration (B) of the yeast strain with overexpressed CWI genes under the CUP1 promoter (PCUP1). Samples were analyzed 18 h after induction with various Cu2+ concentrations (0 to 0.3 mM). Noninduced cultures served as controls. The specific chitin content is reported as relative fluorescence units (RFU) measured from staining 2 × 10⁷ cells with Calcofluor White. The data represent the mean and standard deviation from three independent experiments. (C) Expression of CWI target genes analyzed by real-time PCR. RNAs were extracted from yeast samples 18 h after induction with 0.2 mM CuSO4, and noninduced cultures served as controls. The data represent the mean and standard deviation from three independent experiments. *p < 0.05 indicates a significant difference compared to the control strain using unpaired Student’s t test.
Figure 5
Figure 5
Specific chitin content (A) and cell concentration (B) of the late induction sample. The specific chitin content is reported as relative fluorescence units (RFU) measured from staining 2 × 10⁷ cells with Calcofluor White. The data represent the mean and standard deviation from three independent experiments. (C) Expression of CWI target genes analyzed by real-time PCR. RNAs were extracted from yeast samples 24 h after induction with 0.2 mM CuSO4, and noninduced empty plasmid cultures served as controls. The data represent the mean and standard deviation from three independent experiments. *p < 0.05 indicates a significant difference compared to the control strain using unpaired Student’s t test.
Figure 6
Figure 6
Fluorescence microscopy images of yeast cells stained with Calcofluor White. Chitin distribution in the cell wall is compared between a wild-type yeast containing an empty plasmid and yeast that are overexpressing RHO1 and RHO1Q68H under PCUP1. The analyzed yeasts were cultivated following the late induction setup of PCUP1.
Figure 7
Figure 7
Lipid and chitin coproduction using YAN45 and YAN46 (control) strains. (A) Cultivation scheme to coproduce chitin and lipid in yeast using different induction strategies; (B) specific and volumetric chitin content of yeasts. The specific chitin content is reported as relative fluorescence units (RFU) measured from staining 2 × 10⁷ cells with Calcofluor White, while the volumetric chitin content is reported as relative fluorescence units of the total amount of cells per milliliter (RFU/ml); (C) specific and volumetric lipid content of yeasts. The specific lipid content is reported as relative fluorescence units (RFU) measured from staining 5 × 10⁶ cells with Nile Red, while the volumetric lipid content is reported as relative fluorescence units of the total amount of cells per milliliter (RFU/ml); (D) cell concentrations were measured using a hemacytometer; (E) fluorescence microscope images of yeast strains stained with Calcofluor White and Nile Red. The data in panels B to D represent the mean and standard deviation from three independent experiments. *p < 0.05 indicates a significant difference compared to the control strain using unpaired Student’s t test.
Figure 8
Figure 8
Acid phosphatase (AP) activity, chitin content, and cell concentration of AP and chitin coproducing yeast using YAN53 and YAN61 (control) strains. (A) Cultivation scheme to coproduce chitin and AP in yeast; (B) specific and volumetric chitin content of yeast strains induced with galactose at different time points. The specific chitin content is reported as relative fluorescence units (RFU) measured from staining 2 × 10⁷ cells with Calcofluor White, while the volumetric chitin content is reported as relative fluorescence units of the total amount of cells per milliliter (RFU/ml); (C) specific and total AP activity of yeasts induced with galactose at different time points. Total AP activity is represented as absorbance at 405 nm (A405), and the specific AP activity was calculated by dividing total AP activity by the cell concentration (A405/107 cells); (D) cell concentrations were measured by using a hemacytometer. The data represent the mean and standard deviation from three independent experiments. *p < 0.05 indicates a significant difference compared to the control strain using unpaired Student’s t test.
Figure 9
Figure 9
FTIR spectra of A. Commercially available chitin from crustacean, B. chitin extracted from the control strain YAN61 used for acid phosphatase and chitin coproduction experiment, C. chitin extracted from the RHO1Q68H expressing strain YAN53 strain used for acid phosphatase and chitin coproduction experiment, D. chitin extracted from the control strain YAN46 used for lipid and chitin coproduction experiment, and E. chitin extracted from the RHO1Q68H expressing strain YAN45 strain used for the lipid and chitin coproduction experiment.

Similar articles

Cited by

References

    1. Teng T. S.; Chin Y. L.; Chai K. F.; Chen W. N. Fermentation for future food systems: Precision fermentation can complement the scope and applications of traditional fermentation. EMBO Rep. 2021, 22, e5268010.15252/embr.202152680. - DOI - PMC - PubMed
    1. Crognale S.; Russo C.; Petruccioli M.; D’Annibale A. Chitosan Production by Fungi: Current State of Knowledge, Future Opportunities and Constraints. Fermentation 2022, 8, 76.10.3390/fermentation8020076. - DOI
    1. Coma V.; Bartkowiak A.. Potential of Chitosans in the Development of Edible Food Packaging. In Chitin and chitosan: Properties and applications; Wiley Online Library, 2019, pp. 349–369.
    1. Dave U.; Somanader E.; Baharlouei P.; Pham L.; Rahman M. A. Applications of Chitin in Medical, Environmental, and Agricultural Industries. J. Mar. Sci. Eng. 2021, 9, 1173.10.3390/jmse9111173. - DOI
    1. Samoila P.; Humelnicu A. C.; Ignat M.; Cojocaru C.; Harabagiu V. Chitin and Chitosan for Water Purification. Chitin Chitosan 2019, 429–460. 10.1002/9781119450467.ch17. - DOI

Publication types

MeSH terms

LinkOut - more resources