

Predicting Antidepressant Treatment Response From Cortical Structure on MRI: A Mega-Analysis From the ENIGMA-MDD Working Group
- PMID: 39757979
- PMCID: PMC11702469
- DOI: 10.1002/hbm.70053
Predicting Antidepressant Treatment Response From Cortical Structure on MRI: A Mega-Analysis From the ENIGMA-MDD Working Group
Erratum in
-
Correction to "Predicting Antidepressant Treatment Response From Cortical Structure on MRI: A Mega-Analysis From the ENIGMA-MDD Working Group".Hum Brain Mapp. 2025 Feb 1;46(2):e70144. doi: 10.1002/hbm.70144. Hum Brain Mapp. 2025. PMID: 39907435 Free PMC article. No abstract available.
Abstract
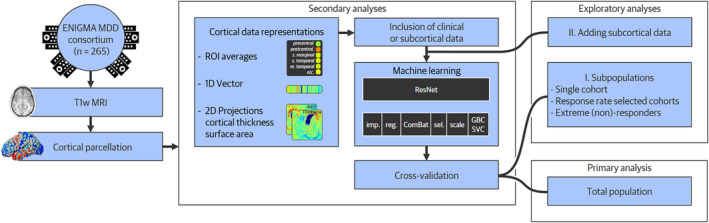
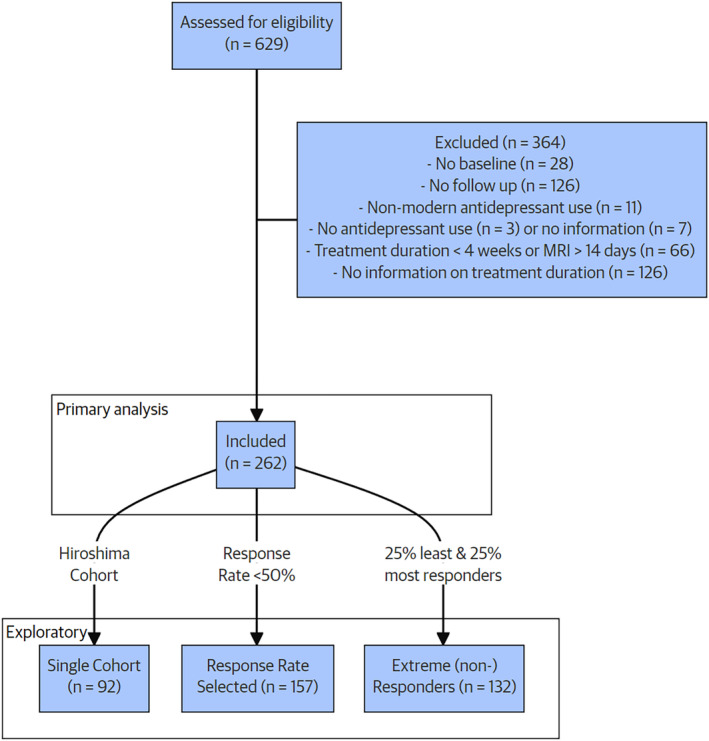
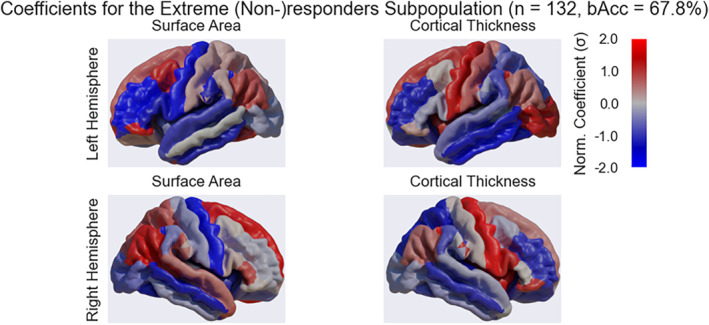
Accurately predicting individual antidepressant treatment response could expedite the lengthy trial-and-error process of finding an effective treatment for major depressive disorder (MDD). We tested and compared machine learning-based methods that predict individual-level pharmacotherapeutic treatment response using cortical morphometry from multisite longitudinal cohorts. We conducted an international analysis of pooled data from six sites of the ENIGMA-MDD consortium (n = 262 MDD patients; age = 36.5 ± 15.3 years; 154 (59%) female; mean response rate = 57%). Treatment response was defined as a ≥ 50% reduction in symptom severity score after 4-12 weeks post-initiation of antidepressant treatment. Structural MRI was acquired before, or < 14 days after, treatment initiation. The cortex was parcellated using FreeSurfer, from which cortical thickness and surface area were measured. We tested several machine learning pipeline configurations, which varied in (i) the way we presented the cortical data (i.e., average values per region of interest, as a vector containing voxel-wise cortical thickness and surface area measures, and as cortical thickness and surface area projections), (ii) whether we included clinical data, and the (iii) machine learning model (i.e., gradient boosting, support vector machine, and neural network classifiers) and (iv) cross-validation methods (i.e., k-fold and leave-one-site-out) we used. First, we tested if the overall predictive performance of the pipelines was better than chance, with a corrected 10-fold cross-validation permutation test. Second, we compared if some machine learning pipeline configurations outperformed others. In an exploratory analysis, we repeated our first analysis in three subpopulations, namely patients (i) from a single site, (ii) with comparable response rates, and (iii) showing the least (first quartile) and the most (fourth quartile) treatment response, which we call the extreme (non-)responders subpopulation. Finally, we explored the effect of including subcortical volumetric data on model performance. Overall, performance predicting antidepressant treatment response was not significantly better than chance (balanced accuracy = 50.5%; p = 0.66) and did not vary with alternative pipeline configurations. Exploratory analyses revealed that performance across models was only significantly better than chance in the extreme (non-)responders subpopulation (balanced accuracy = 63.9%, p = 0.001). Including subcortical data did not alter the observed model performance. Cortical structural MRI alone could not reliably predict individual pharmacotherapeutic treatment response in MDD. None of the used machine learning pipeline configurations outperformed the others. In exploratory analyses, we found that predicting response in the extreme (non-)responders subpopulation was feasible on both cortical data alone and combined with subcortical data, which suggests that specific MDD subpopulations may exhibit response-related patterns in structural data. Future work may use multimodal data to predict treatment response in MDD.
Keywords: ENIGMA; Radiomics; antidepressant treatment response; machine learning; magnetic resonance imaging; major depressive disorder; mega‐analysis.
© 2025 The Author(s). Human Brain Mapping published by Wiley Periodicals LLC.
Conflict of interest statement
M. W. A. Caan is a shareholder of Nico‐lab International Ltd. Dr. H. G. Ruhe received speaking fees from Lundbeck and Janssen, and grants from ZonMW, Hersenstichting, the Dutch ministry of health and an unrestricted educational grant from Janssen. All other authors declare no financial relationships with commercial interests.
Figures
References
-
- Anderson, M. J. 2005. Permutational Multivariate Analysis of Variance. Wuhan, China: Scientific Research Publishing.
-
- Belov, V. , Erwin‐Grabner T., Gonul A. S., et al. 2022. “Global Multi‐Site Benchmark Classification of Major Depressive Disorder Using Machine Learning on Cortical and Subcortical Features of 5,365 Participants From the ENIGMA MDD Dataset.” arXiv Preprint arXiv:2206.08122.
MeSH terms
Substances
Grants and funding
- 01 ZX 1507/Bundesministerium für Bildung und Forschung
- Investigator grant 1024570/National Health and Medical Research Council
- Rubicon 452020227/Nederlandse Organisatie voor Wetenschappelijk Onderzoek
- RF-2018-12367249/Ministry of health, Italy
- R01 MH116147/MH/NIMH NIH HHS/United States
- R01 MH129742/MH/NIMH NIH HHS/United States
- MH129832/MH/NIMH NIH HHS/United States
- Investigator grant 1064643/National Health and Medical Research Council
- R56 AG058854/AG/NIA NIH HHS/United States
- R01 MH134004/MH/NIMH NIH HHS/United States
- K23MH090421/MH/NIMH NIH HHS/United States
- JP18dm0307002/Japan Agency for Medical Research and Development
- R01 MH129832/MH/NIMH NIH HHS/United States
- MH117601/MH/NIMH NIH HHS/United States
- Investigator grant 2017962/National Health and Medical Research Council
- R01 MH131806/MH/NIMH NIH HHS/United States
- 113351/Eurostars
- P41 RR008079/RR/NCRR NIH HHS/United States
- U54 EB020403/EB/NIBIB NIH HHS/United States
- R01 MH117601/MH/NIMH NIH HHS/United States
- CJ Martin Fellowship 1161356/National Health and Medical Research Council
- Veni 016.196.153/Nederlandse Organisatie voor Wetenschappelijk Onderzoek
- MH129742/MH/NIMH NIH HHS/United States
- A_201779W93T/Ministry of University and Scientific Research, Italy
- K23 MH090421/MH/NIMH NIH HHS/United States
- R01 MH129742-01/MH/NIMH NIH HHS/United States
LinkOut - more resources
Full Text Sources
Medical
Miscellaneous
