. 2024 Nov 26;32(4):200913.
doi: 10.1016/j.omton.2024.200913. eCollection 2024 Dec 19.

Enhancing immune response and survival in hepatocellular carcinoma with novel oncolytic Jurona virus and immune checkpoint blockade

Affiliations

Enhancing immune response and survival in hepatocellular carcinoma with novel oncolytic Jurona virus and immune checkpoint blockade

Mulu Z Tesfay et al. Mol Ther Oncol. .

Abstract

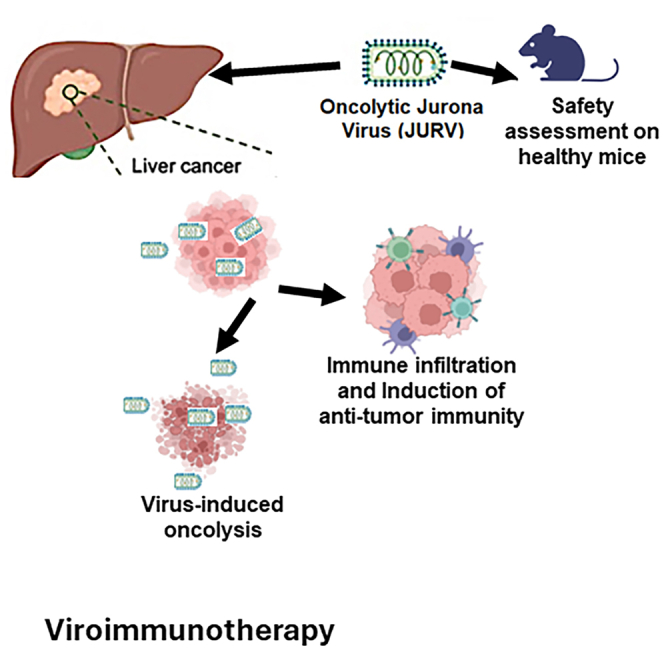
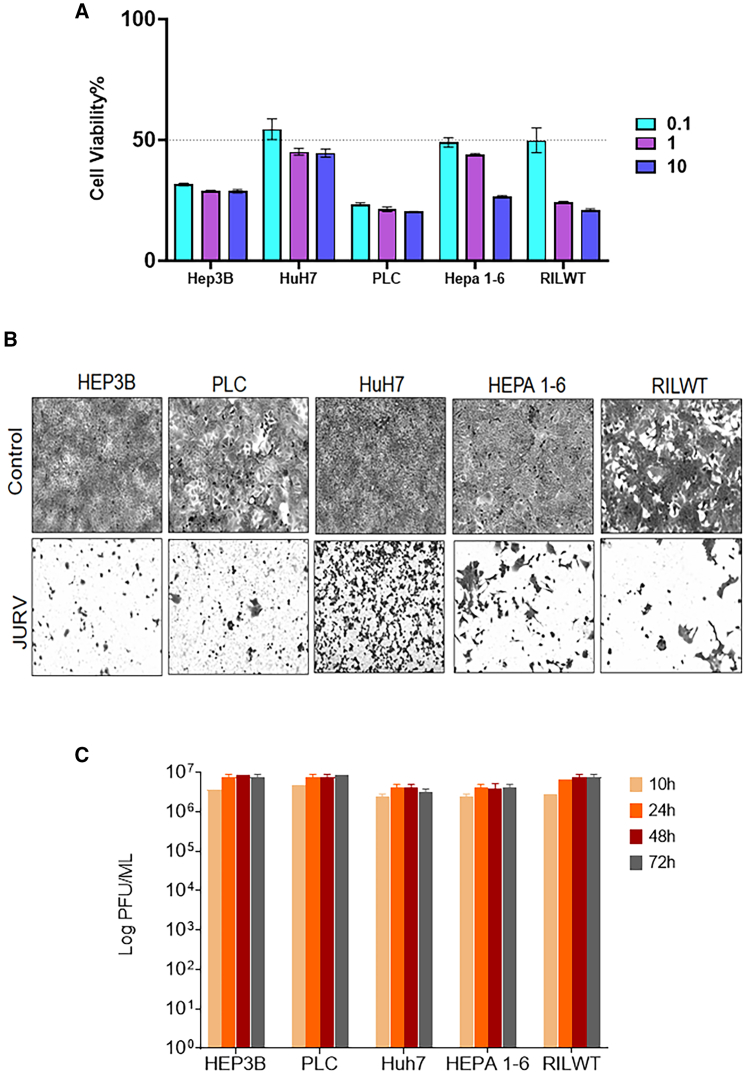
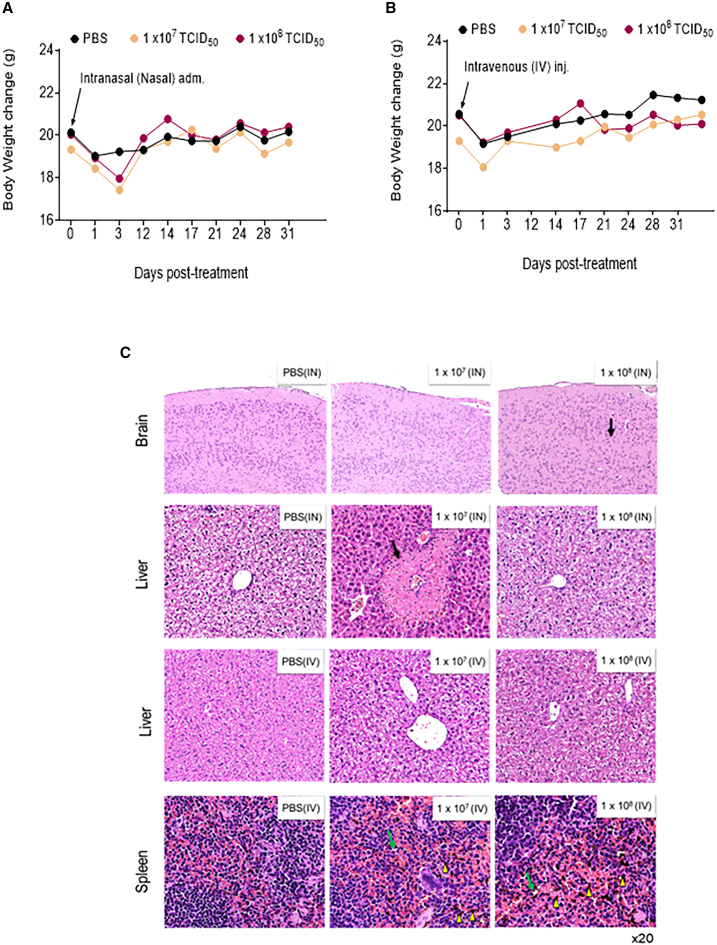
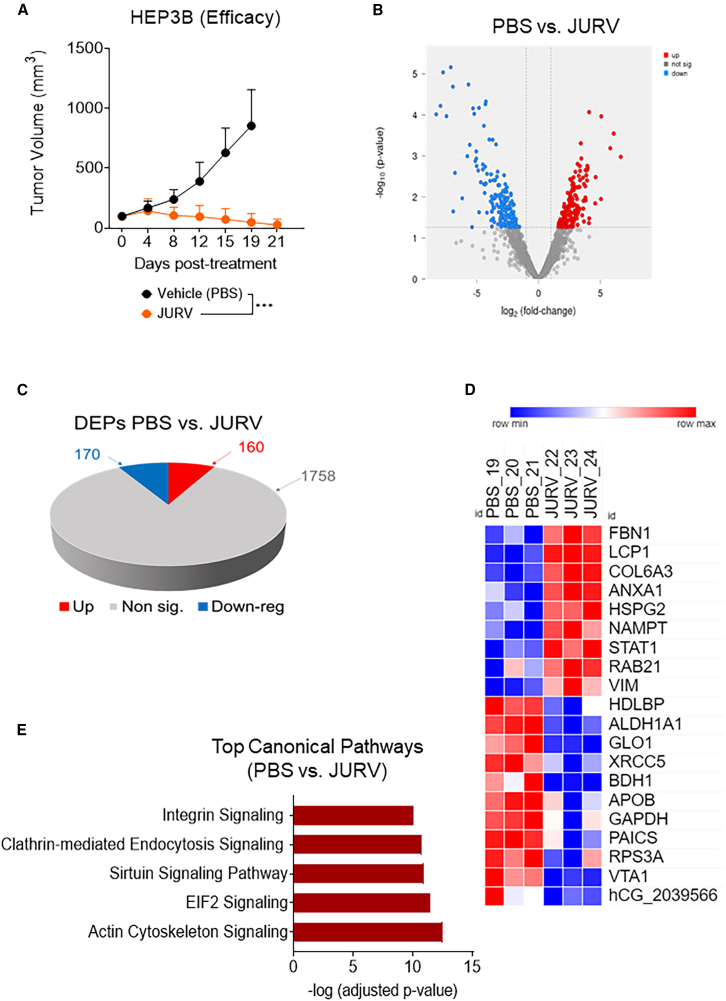
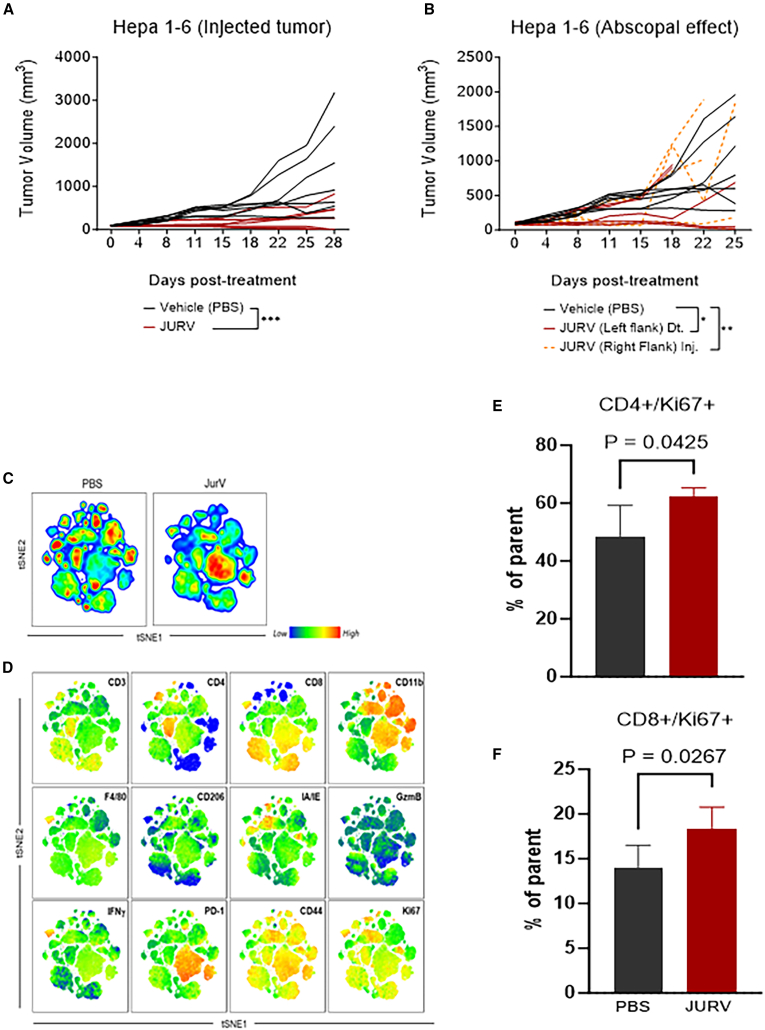
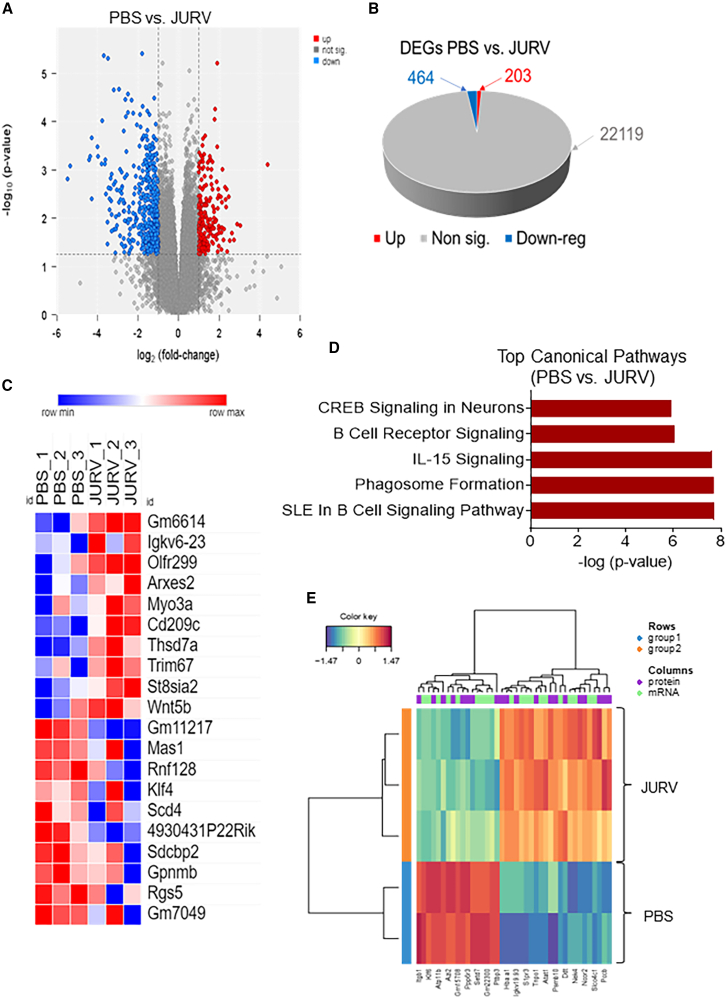
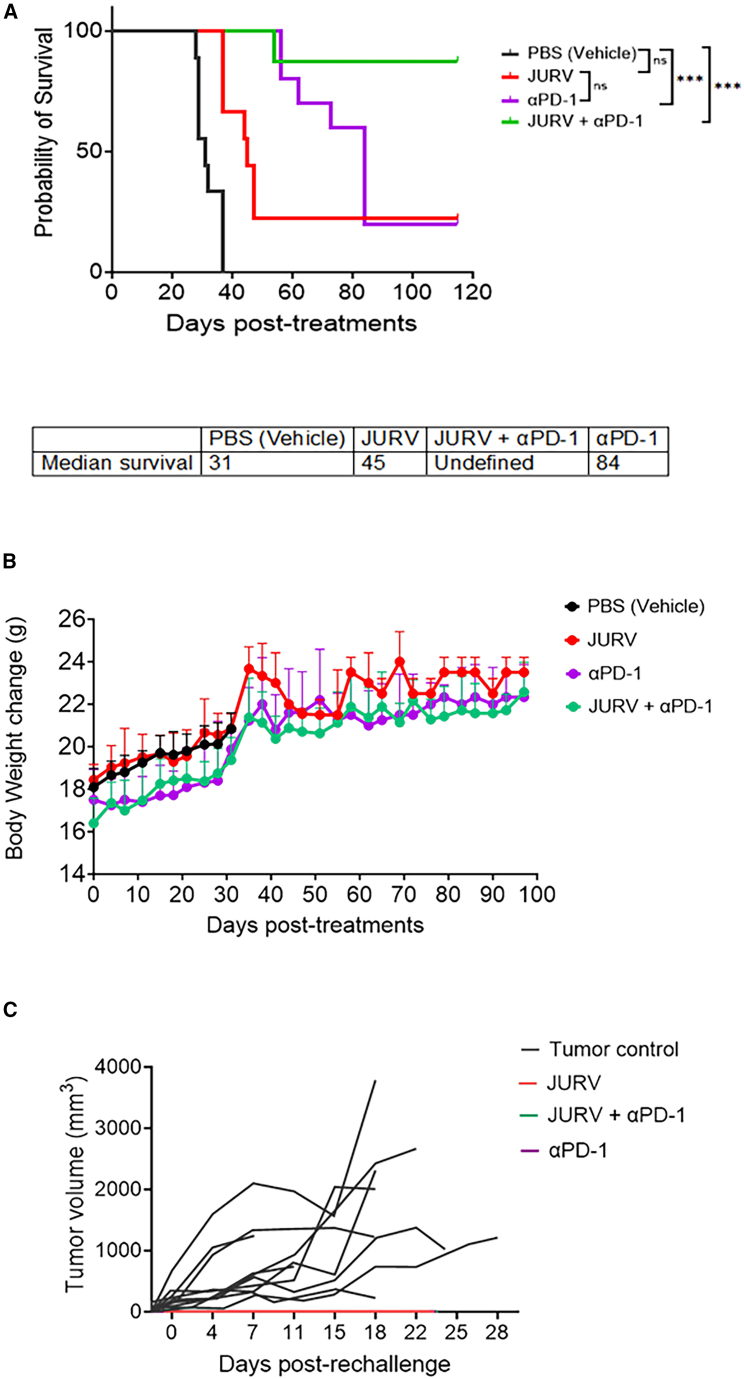
Members of the Vesiculovirus genus including Jurona virus (JURV) have emerged as promising immunotherapeutic agents, characterized by their tumor selectivity, fast kinetics, low seroprevalence, and minimal toxicity in humans. Here, we demonstrate that the administration of JURV leads to tumor regression in both hepatocellular carcinoma (HCC) xenograft and syngeneic models. Furthermore, our findings indicate that combining JURV and anti-PD-1 therapy reduced tumor burden and improved survival rates over JURV or anti-PD-1 alone in an orthotopic HCC model. Proteogenomic analysis of JURV-treated, murine HCC tumors demonstrates that the therapeutic effects of the combination of JURV and anti-PD-1 are predominantly driven by coordinated activation of immune effectors, which modulate the tumor microenvironment into a state conducive to anti-tumor activity. Our results establish JURV as a potent candidate for immunovirotherapy in HCC, capable of modulating immune response and synergizing with standard of care for HCC to prolong survival in preclinical models. Further, this research deepens our understanding of JURV's anti-tumoral mechanisms and highlights its potential as a novel approach to HCC treatment strategies.

Keywords: Jurona virus; Rhabdoviridae; hepatocellular carcinoma; oncolytic virus; vesiculovirus.


Conflict of interest statement

The authors declare no competing interests.

Figures

None
Graphical abstract
Figure 1
Figure 1
Oncolytic JURV is effective at inducing oncolysis in HCC cell lines (A) Monolayers of human HCC (HEP3B, PLC, HuH7), murine HCC (HEPA 1–6 and RILWT) were seeded at a density of 1.5 × 104/well in 96-well plates and infected with JURV at an MOIs of 10, 1, or 0.1, respectively. The percentage of cell viability was determined 72 h post-infection using a colorimetric assay (MTS, Promega) and calculated as percent of noninfected control cells. The discontinued lines on the graphs indicate the cutoff percentage for resistance (>50% cell viability above the line) and sensitivity (<50% of cell viability, below the line). Data were collected from multiple replicates over three independent experiments. Bars indicate mean ± SEM. (B) Crystal violet staining. Cancer cells were plated at 5.0 × 105/well in a 6-well plate and rested overnight. The following day they were infected with JURV at an MOI of 0.1. Cells were fixed and stained with crystal violet 72 h post-infection, and images were captured at 10× magnification on an Olympus IX83 Inverted Microscope System. (C) HCC cells were plated in 6-well plates at 2.0 × 105/well and infected with JURV at an MOI of 0.1. Supernatants from infected cells were collected at different time points, and viral titer was determined using a TCID50 (50% tissue culture infective dose) or PFU method on Vero cells (1.5 × 104). Data are plotted from two independent assessments of TCID50 for each point with mean ± SEM.
Figure 2
Figure 2
Effects of low and high doses of oncolytic JURV on body weight and hemogram in mice Non-tumor-bearing female C57BL6/J (n = 6/group; strain no. 000664) of age 6–8 weeks were administered single doses of PBS, 1 × 107 TCID50 of JURV, or 1 × 108 TCID50 of JURV (A) intranasally (i.n.) or (B) intravenously (i.v.). Body weight was recorded twice a week in both the i.n. and i.v. cohorts to assess drug-related toxicity. Three mice per group in each cohort (i.n. or i.v.) were sacrificed 3 days post-infection, and blood, brain, and liver were harvested to assess the short-term toxicity. Hematoxylin and eosin (H&E) staining (brain, spleen, and liver) are shown for i.n. and i.v. administration (C), where black arrows indicate that samples were within normal limits. Green arrows indicate necrosis, single cell, macrophage, sporadic. Yellow triangles indicate pigmentation increased in macrophages, red pulp, and white pulp.
Figure 3
Figure 3
Assessment of JURV-mediated oncolysis in Hep3B xenografts Female NOD.Cg-Prkdcscid/J (strain no. 001.0303) mice (n = 6/group) were inoculated subcutaneously with HEP3B cells tagged with a luciferase reporter protein. When the average tumor volume reached 80–120 mm3, mice were divided into two groups and received i.t. injections with either PBS or JURV at a dose of 1.0 × 107 TCID50 (days 0, 7, and 14). (A) Tumor volume was recorded twice weekly until the humane endpoint, or end of the study (day 21). HEP3B tumors treated with PBS or JURV were harvested and analyzed for changes in protein expression. (B) Volcano plot of protein expression differences in HEP3B tumors treated with PBS vs. 1 × 107 TCID50 of JURV. (C) 3D pie slices of the numbers of differentially expressed proteins (DEPs) in HEP3B tumors injected with PBS vs. 1 × 107 TCID50 of JURV. (D) Heatmap of the top 20 DEPs upregulated or downregulated in HEP3B tumors injected with PBS vs. 1.0 × 107 TCID50 of JURV. DEPs were determined using the limma-voom method as described in material and methods section. A fold-change |logFC| ≥ 1 and a false discovery rate (FDR) of 0.05 were used as a cutoff. The logFC was computed using the difference between the mean of log2(JURV) and the mean of log2(PBS), that is, mean of log2(JURV) – mean of log2(PBS). (E) Graph showing top-scoring canonical pathways significantly enriched by treatment with 1.0 × 107 TCID50 of JURV in the HEP3B tumors.
Figure 4
Figure 4
Evaluation of the anti-tumor efficacy of oncolytic JURV in an immuno-competent murine HCC model HEPA 1–6 cells were implanted into the right flanks of female C57BL6/J (strain no. 000664) (n = 7/group; Jackson Laboratory). (A) When the average tumor volume reached 80–120 mm3, mice were administered 50 μL i.t. injections containing PBS (vehicle) or 1 × 107 TCID50 units of JURV were injected (inj.) into tumor-bearing mice at days 0, 7, and 14. Tumor volume was recorded twice weekly. Tumors were harvested at the end of the study for downstream analysis. (B) In the abscopal model (dual flanks), HEPA 1–6 cells (1 × 106 cells/mouse) were first subcutaneously grafted into the right flanks and were categorized as “primary” tumors. Simultaneously, we performed distant HEPA 1–6 tumor grafts (1 × 106 cells/mouse) into the left flanks of these mice. Mice in the dual-flank group received 50 μL i.t. injections of 1 × 107 TCID50 units of JURV only on their right flanks once a week for 3 weeks. Data plotted as mean ± SD; ∗∗p < 0.001, ∗∗∗p < 0.0001. Area under the curve for tumor growth was compared by one-way ANOVA with Holm-Sidak correction for type I error. The first day of JURV or PBS injection was defined as day 0. t-SNE (t-distributed stochastic neighbor embedding) plot showing variable composition of tumor-infiltrating lymphocytes in JURV-treated tumors. Viable CD45 (12,500 events per tumor) were clustered by t-SNE. (C) Global cell density by t-SNE for each tumor treatment group. (D) Heatmap level of expression of each cellular marker across all groups. (E and F) Analysis of tumor-infiltrating immune cells following i.t. injection of oncolytic JURV in murine HCC tumors. The parent gate used is the live CD45+CD3+ population.
Figure 5
Figure 5
Proteogenomic changes in murine HCC injected with oncolytic JURV (A) Volcano plot of murine HCC tumor mRNA expression differences for PBS vs. JURV (1.0 × 107 TCID50). (B) 3D pie slices of the numbers of differentially expressed genes (DEGs) between PBS vs. JURV. (C) Heatmap of the top 20 DEGs upregulated or downregulated in PBS vs. JURV. DEGs were determined using the limma-voom. (D) Graph showing top-scoring canonical pathways significantly enriched by treatment with PBS vs. JURV. A MixOmics supervised analysis was carried out between DEPs and DEGs based on Log2 fold change values. Log2 fold change of DEG × Log2 fold change of DEP > 0 with a p value of DEG and DEP < 0.05 were considered associated DEGs/DEPs. (E) DEG/DEP expression heatmap of the 30 most upregulated and downregulated features DEG/DEP in PBS vs. JURV.
Figure 6
Figure 6
JURV synergizes with checkpoint inhibitors to significantly control tumor growth and prolong survival compared with single treatments in the metastatic HCC orthotopic mouse model (A) Kaplan-Meier survival curves illustrate the probability of survival over time for RILWT tumor-bearing mice (n = 10/group) treated with PBS (vehicle), JURV alone, anti-PD-1 antibodies alone, and the combination of JURV and anti-PD-1. Median survival times are indicated for each treatment group, with the combination therapy showing significantly extended survival compared with all other groups (p < 0.0001). (B) Body weight changes of the mice are plotted over time post-treatment, serving as an indirect measure of general health and treatment tolerability. Data points represent mean body weights with error bars indicating standard deviation. (C) Tumor growth post-rechallenge demonstrates individual tumor progression for each treatment cohort. JURV, αPD-1, and their combination notably inhibit tumor growth, which correlates with enhanced survival rates and suggests induction of tumor-specific immune responses. Statistical significance for survival rates was calculated using log rank (Mantel-Cox) tests, with the following notations: ns, not significant; ∗p < 0.05, ∗∗p < 0.01, ∗∗∗p < 0.001, ∗∗∗∗p < 0.0001. Tumor volume and body weight data were analyzed using repeated measures ANOVA with post hoc tests appropriate for multiple comparisons.

References

    1. Global Burden of Disease Liver Cancer Collaboration, Akinyemiju T., Abera S., Ahmed M., Alam N., Alemayohu M.A., Allen C., Al-Raddadi R., Alvis-Guzman N., Amoako Y., et al. The Burden of Primary Liver Cancer and Underlying Etiologies From 1990 to 2015 at the Global, Regional, and National Level: Results From the Global Burden of Disease Study 2015. JAMA Oncol. 2017;3:1683–1691. - PMC - PubMed
    1. Yang C., Zhang H., Zhang L., Zhu A.X., Bernards R., Qin W., Wang C. Evolving therapeutic landscape of advanced hepatocellular carcinoma. Nat. Rev. Gastroenterol. Hepatol. 2023;20:203–222. doi: 10.1038/s41575-022-00704-9. - DOI - PubMed
    1. Foerster F., Gairing S.J., Müller L., Galle P.R. NAFLD-driven HCC: Safety and efficacy of current and emerging treatment options. J. Hepatol. 2022;76:446–457. doi: 10.1016/j.jhep.2021.09.007. - DOI - PubMed
    1. Kim D.W., Talati C., Kim R. Hepatocellular carcinoma (HCC): beyond sorafenib-chemotherapy. J. Gastrointest. Oncol. 2017;8:256–265. - PMC - PubMed
    1. Llovet J.M., Pinyol R., Yarchoan M., Singal A.G., Marron T.U., Schwartz M., Pikarsky E., Kudo M., Finn R.S. Adjuvant and neoadjuvant immunotherapies in hepatocellular carcinoma. Nat. Rev. Clin. Oncol. 2024;21:294–311. doi: 10.1038/s41571-024-00868-0. - DOI - PMC - PubMed