. 2024 Dec 20:18:1480735.
doi: 10.3389/fnins.2024.1480735. eCollection 2024.

Multi-view fusion of diffusion MRI microstructural models: a preterm birth study

Affiliations

Multi-view fusion of diffusion MRI microstructural models: a preterm birth study

Rosella Trò et al. Front Neurosci. .

Abstract

Objective: High Angular Resolution Diffusion Imaging (HARDI) models have emerged as a valuable tool for investigating microstructure with a higher degree of detail than standard diffusion Magnetic Resonance Imaging (dMRI). In this study, we explored the potential of multiple advanced microstructural diffusion models for investigating preterm birth in order to identify non-invasive markers of altered white matter development.

Approach: Rather than focusing on a single MRI modality, we studied on a compound of HARDI techniques in 46 preterm babies studied on a 3T scanner at term-equivalent age and in 23 control neonates born at term. Furthermore, we investigated discriminative patterns of preterm birth using multiple analysis methods, drawn from two only seemingly divergent modeling goals, namely inference and prediction. We thus resorted to (i) a traditional univariate voxel-wise inferential method, as the Tract-Based Spatial Statistics (TBSS) approach; (ii) a univariate predictive approach, as the Support Vector Machine (SVM) classification; and (iii) a multivariate predictive Canonical Correlation Analysis (CCA).

Main results: The TBSS analysis revealed significant differences between preterm and term cohorts in several white matter areas for multiple HARDI features. SVM classification on skeletonized HARDI measures yielded satisfactory accuracy, particularly for highly informative parameters about fiber directionality. Assessment of the degree of overlap between the two methods in voting for the most discriminating features exhibited a good, though parameter-dependent, rate of agreement. Finally, CCA identified joint changes precisely for those measures exhibiting less correspondence between TBSS and SVM.

Significance: Our results suggest that a data-driven intramodal imaging approach is crucial for gathering deep and complementary information. The main contribution of this methodological outline is to thoroughly investigate prematurity-related white matter changes through different inquiry focuses, with a view to addressing this issue, both aiming toward mechanistic insight and optimizing predictive accuracy.

Keywords: diffusion Magnetic Resonance Imaging; inference; intramodal imaging approach; prediction; preterm birth.


Conflict of interest statement

The authors declare that the research was conducted in the absence of any commercial or financial relationships that could be construed as a potential conflict of interest. The author(s) declared that they were an editorial board member of Frontiers, at the time of submission. This had no impact on the peer review process and the final decision.

Figures
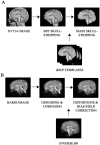
Figure 1
Figure 1
Preprocessing pipeline: overview of the main preliminary image processing steps performed on (A) 3D T1-weighted, whose key step is skull-stripping and (B) HARDI scans, whose core is represented by denoising as well as distortion correction, for an example subject.
Figure 2
Figure 2
An intuitive visualization of Canonical Correlation Analysis: Let N be the number of observations. n datasets—variable depending on each diffusion model—XkRNxVk are transformed by projections WkVkxD such that each paired embedding (Ai, Aj) is maximally correlated with unit length in the projected space.
Figure 3
Figure 3
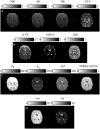
Microstructural models: parametric scalar maps derived from all the HARDI models employed for this study: (A) Diffusion Kurtosis Imaging (DKI), (B) Neurite Orientation Dispersion and Density Imaging (NODDI), (C) Fiber Orientation Estimated using Continuous Axially Symmetric Tensors (FORECAST), (D) Multi-Shell Multi-Tissue Constrained Spherical Deconvolution (MSMT CSD).
Figure 4
Figure 4
TBSS pipeline: overview of the main steps of the TBSS framework, from spatial normalization of DTI volumes to bootstrapping the within-population template to skeletonization of the template DTI-FA map and projection of each subject's DTI-FA onto the skeleton.
Figure 5
Figure 5
Experimental design for SVM classification: in a first phase, an SVM classification estimator is chosen to best perform on DTI-FA skeletonized data; in a second phase the, selected model is extended to other non-FA measures.
Figure 6
Figure 6
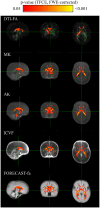
TBSS exhibits discriminant white matter areas for a subset of microstructural measures: group-level voxel-wise statistical difference maps for DTI-FA (FA), Mean Kurtosis (MK), Axial Kurtosis (AK), IntraCellular Volume Fraction (ICVF) and FORECAST fractional anisotropy (FORECAST-fa) between preterm and term-born cohorts. Green indicates the DTI-FA skeleton with a threshold of 0.1, which highlights the tracts used in the comparison. Red-Yellow indicates the regions with decreased metrics values in the preterm group after an unpaired voxel-wise t-test with Family-Wise Error (FWE)-corrected p-values using Threshold-Free Cluster Enhancement (TFCE).
Figure 7
Figure 7
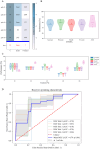
First phase of binary classification: SVM tuning of hyperparameters training on FA skeletonized data: (A) cross-validated search of the best set of hyperparameters for our SVM estimator on stratified 5-fold data; (B) relative performance for every score across folds; (C) Different sets of selected features along with relative performance for every score across folds; and (D) area under the ROC curve score.
Figure 8
Figure 8
Second phase of binary classification: SVM testing on non-FA skeletonized data on average shows good performance, especially for the AUC score: a heatmap containing the average and relative standard deviation, in percentage, of each score and for all the HARDI measures under analysis.
Figure 9
Figure 9
Relationship between Pearson's correlation and Wasserstein Distance shows a good trend of association throughout all HARDI parameters considered: those measures exhibiting the highest absolute correlation values correspondingly have a lower Wasserstein Distance.
Figure 10
Figure 10
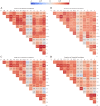
Canonical Correlation Analysis identifies four Canonical Components maximizing pair-wise Canonical Correlation matrices: (A) first Canonical Component, (B) second Canonical Component, (C) third Canonical Component, and (D) fourth Canonical Component. For the sake of brevity, FA stands for DTI-FA, while fa stands for FORECAST-fa.
Figure 11
Figure 11
Perpendicular diffusivity (d) and ISOtropic Volume Fraction (ISOVF) turn out to be joint group-discriminative Components from Canonical Correlation Analysis: (A) Violin plots of the loading parameters for the 4th component for each dMRI measure after outlier removal, with ** indicating the significant p values of the Mann–Whitney U Test between term and preterm participants; (B) Group-discriminating regions across all modalities. The Z-scored spatial maps exhibit positive Z-values (orange regions), meaning preterm > term subjects, and negative Z-values (blue regions), meaning term > preterm.

References

    1. Anderson A. W. (2005). Measurement of fiber orientation distributions using high angular resolution diffusion imaging. Magn. Reson. Med. 54, 1194–1206. 10.1002/mrm.20667 - DOI - PubMed
    1. Anjari M., Srinivasan L., Allsop J. M., Hajnal J. V., Rutherford M. A., Edwards A. D., et al. . (2007). Diffusion tensor imaging with tract-based spatial statistics reveals local white matter abnormalities in preterm infants. Neuroimage 35, 1021–1027. 10.1016/j.neuroimage.2007.01.035 - DOI - PubMed
    1. Bach M., Laun F. B., Leemans A., Tax C. M., Biessels G. J., Stieltjes B., et al. . (2014). Methodological considerations on tract-based spatial statistics (TBSS). Neuroimage 100, 358–369. 10.1016/j.neuroimage.2014.06.021 - DOI - PubMed
    1. Ball G., Counsell S. J., Anjari M., Merchant N., Arichi T., Doria V., et al. . (2010). An optimised tract-based spatial statistics protocol for neonates: applications to prematurity and chronic lung disease. Neuroimage 53, 94–102. 10.1016/j.neuroimage.2010.05.055 - DOI - PubMed
    1. Barnett M. L., Tusor N., Ball G., Chew A., Falconer S., Aljabar P., et al. . (2018). Exploring the multiple-hit hypothesis of preterm white matter damage using diffusion MRI. NeuroImage: Clini. 17, 596–606. 10.1016/j.nicl.2017.11.017 - DOI - PMC - PubMed

LinkOut - more resources