. 2024 Oct 24;27(12):111248.
doi: 10.1016/j.isci.2024.111248. eCollection 2024 Dec 20.

Interleukin-2 receptor signaling acts as a checkpoint that influences the distribution of regulatory T cell subsets

Affiliations

Interleukin-2 receptor signaling acts as a checkpoint that influences the distribution of regulatory T cell subsets

Acacia N Shouse et al. iScience. .

Abstract

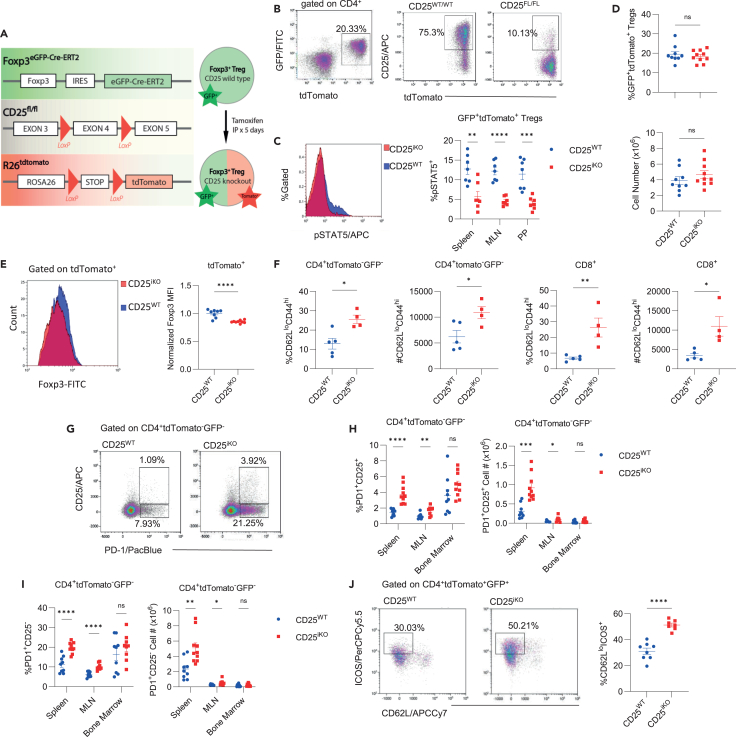
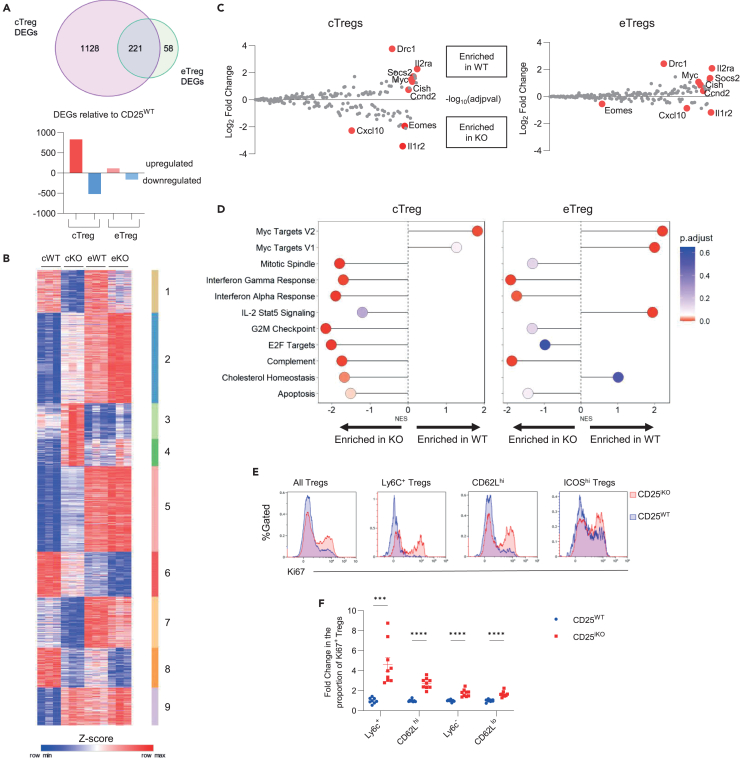
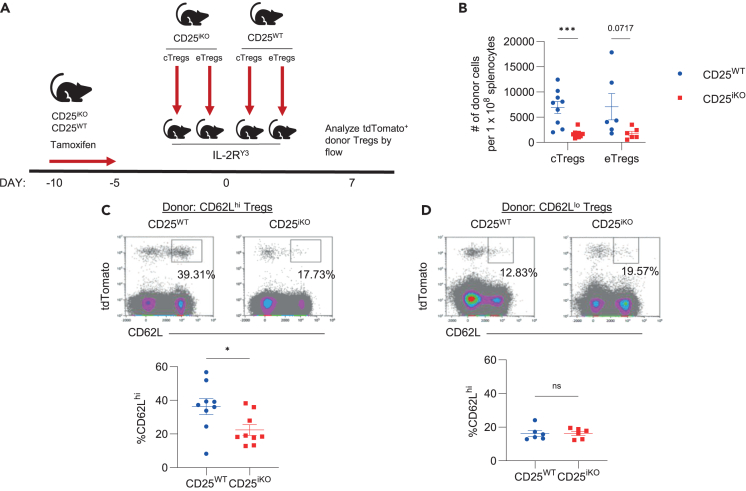
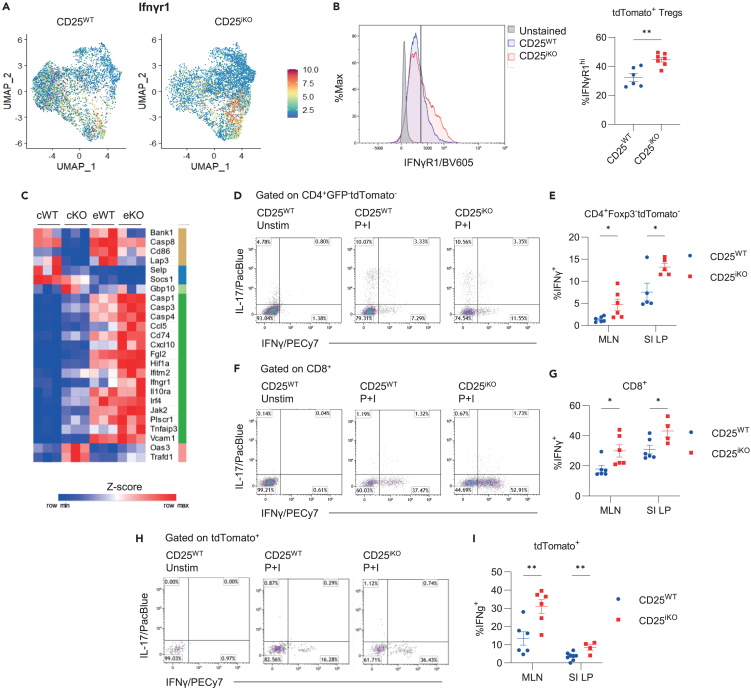
Regulatory T cells (Tregs) require IL-2 for survival in the periphery, yet how IL-2 shapes Treg heterogeneity remains poorly defined. Here we show that inhibition of IL-2R signaling in post-thymic Tregs leads to a preferential early loss of circulating Tregs (cTregs). Gene expression of cTregs was more dependent on IL-2R signaling than effector Tregs (eTregs). Unexpectedly, ablation of IL-2R signaling in cTregs resulted in increased proliferation, expression of eTreg genes, and enhanced capacity to develop into eTregs. Thus, IL-2R signaling normally acts as a checkpoint to maintain cTreg homeostasis while restraining their development into eTregs. Loss of IL-2R signaling also alters the distribution of eTreg subsets, with increased IFNγR1+ eTregs and CXCR5+ PD-1+ T follicular regulatory (TFR) cells but decreased intestinal RORγt+ TR17 cells. These changes lower eTreg suppressive function supporting expansion of IFNγ-secreting T effector cells. Thus, IL-2R signaling also safeguards Treg function and licenses differentiation of specialized eTregs.

Keywords: Biological sciences; Immune response; Immunology; Natural sciences.


Conflict of interest statement

The University of Miami and Thomas Malek have a patent on IL-2/CD25 fusion proteins and this technology has been licensed to Bristol Myers Squibb by the University of Miami for commercial development. Both receive royalties for its commercialization.

Figures

None
Graphical abstract
Figure 1
Figure 1
Inducible Treg-deletion of CD25 leads to activation of autoreactive T cells (A) Schematic of the CD25iKO mouse model incorporating three constructs, Foxp3eGFP−Cre-ERT2, CD25FL/FL and R26tdTomato. CD25 is knocked out upon the administration of tamoxifen. Mice lacking the CD25FL/FL construct are used as CD25WT controls. (B) Identification of GFP+ tdTomato+ Tregs by flow cytometry and assessment of CD25 expression by GFP+ tdTomato+ splenic Tregs from CD25WT vs. CD25iKO mice. (C) Ex vivo pSTAT5 staining by Tregs from spleen, mesenteric lymph nodes (MLN) and Peyer’s Patches (PP) of CD25WT and CD25iKO mice. Cells are gated on GFP+ tdTomato+ Tregs with representative flow cytometry histograms (left) and quantitative data (right). (D) Frequencies and numbers of GFP+ tdTomato+ Tregs in the spleen. (E) Foxp3 MFI from CD25WT or CD25iKO splenocytes after fixation and staining with anti-Foxp3. (F) At 12 days post-tamoxifen, frequency and numbers of activated CD62LloCD44hi CD4+ tdTomato GFP conventional T cells (left) and CD8+ T cells (right) in the blood from CD25WT and CD25iKO mice. (G) Representative flow cytometry dot plots to measure CD4+ PD-1+ CD25+ and CD4+ PD-1+ CD25neg autoreactive T cells in the spleen. (H) Proportion and number of CD4+ PD-1+ CD25+ autoreactive T cells. (I) Proportion and number of CD4+ PD-1+ CD25neg autoreactive T cells. (J) Representative flow cytometry dot plots (left) and quantitative data (right) for expression of CD62L and ICOS by CD4+ Tregs in CD25WT and CD25iKO mice. All data were collected at 10 days post-tamoxifen treatment unless otherwise stated. Data (n = 4–5, E; n = 8–10, C, D, G-I) from at least two replicate experiments were analyzed by an unpaired t test. ∗p < 0.05, ∗∗p < 0.01, ∗∗∗p < 0.001, ∗∗∗∗p < 0.0001.
Figure 2
Figure 2
The cTreg transcriptome is more dependent on IL-2 signaling than that of eTregs (A) Spleens and lymph nodes were pooled from 2 to 3 mice per replicate (n = 3/group), FACS-purified for CD62Lhi and CD62Llo Treg subsets and subjected to bulk RNA-seq. The number of differentially expressed genes (DEGs) were determined (>1.5-fold with adjusted p-val <0.05). (B) Heatmap of the DEGs displayed in A. The heatmap (broadinstitute.com/morpheus) was generated using TPMs converted to Z score and clustered by K-means. (C) Genes from the Hallmark IL/2-STAT5 pathway were plotted as Log2FC vs. log10(adjpval). The genes that were the most differentially expressed in cTregs are highlighted by red dots in both plots. (D) GSEA was performed and the top Hallmark pathways for each Treg subset were plotted for their enrichment score (x axis) and adjusted p value (color). (E) Representative flow cytometry histograms of Ki67 expression by various Tregs subsets based on the indicated markers for CD25WT and CD25iKO Tregs. (F) Quantitative data from (E).Data (n = 8, F) from two replicate experiments were analyzed by unpaired t test. ∗∗∗p < 0.001, ∗∗∗∗p < 0.0001.
Figure 3
Figure 3
IL-2R signaling influences the proportion of cTreg and eTreg subsets (A) scRNA-seq of FACS purified CD25iKO and CD25WT Tregs, each pooled from 2 spleens. The resulting data were merged and UMAP distribution of Treg clusters are then shown for the indicated Tregs. (B) CD62L (red) and Icos (blue) expression overlayed onto the UMAP from Figure 4A for the indicated Tregs. (C) Relative proportional changes of 5 clusters of Tregs (Figure 4A) from the indicated Tregs. (D) Heatmaps of transcript expression between CD25iKO and CD25WT Tregs for cluster defining genes with relative expression level shown by the color bar on the right. Cluster-defining genes (Log2FC >0.25, adjusted p-value <0.05) were determined using MAST by comparing the transcripts within each cluster compared to all other clusters.
Figure 4
Figure 4
IL-2R signaling regulates molecular drivers of eTreg subsets (A) IL-2-dependent genes determined by RNA-seq in Figure 2A were compared to cluster defining genes from scRNA-seq. The proportion of cluster-defining genes that are IL-2-dependent are plotted by color and overlayed onto the merged UMAP from Figure 3A with CD25iKO and CD25WT Tregs combined. (B) UMAP feature plots of scRNA-seq data highlighting cluster-defining transcription factors that are IL-2-dependent. (C) Transcription factors that define clusters in Figure 3 are shown by their fold change in cTregs (top) and eTreg (bottom).
Figure 5
Figure 5
IL-2R signaling maintains Treg survival and the abundance of CD62Lhi cTregs (A) Schematic of adoptive transfer of Treg subsets into IL-2Rβ mutant mice (IL-2RβY3). CD25WT and CD25iKO mice were treated with tamoxifen for five days (Day −10 to −5). Five days later (Day 0), CD25WT and CD25iKO CD62Lhi cTregs and CD62Llo eTregs were FACS-sorted from the spleens and lymph nodes and 300,000 cells were adoptively transferred to IL-2RβY3 recipient mice. (B) 7 days post-transfer, the number of donor Tregs in the spleen of IL-2RβY3 recipients were enumerated based on expression of the tdTomato-reporter. (C) Representative flow cytometry dot plots (top) and quantitative data (bottom) of donor CD62Lhi tdTomato+ Tregs after gating CD4+ splenocytes 7 days post-transfer of cTregs. (D) Representative flow cytometry dot plots (top) and quantitative data (bottom) of donor CD62Lhi tdTomato+ Tregs after gating CD4+ splenocytes 7 days post-transfer of eTregs. The percent in the dot plots (C, D) represents the fraction of donor Tregs that express CD62L. Data (n = 6–9) for (B) and (C) from 2 to 3 replicate experiments were analyzed by unpaired t tests. ∗p < 0.05, ∗∗p < 0.01, ∗∗∗p < 0.001.
Figure 6
Figure 6
RORγt+ Tregs depend on IL-2R signaling (A) 58 IL-2 dependent genes unique to CD25iKO eTregs with genes specific to TH17 and/or TR17 highlighted in red. (B and C) CD25WT and CD25iKO mice were induced with tamoxifen for 5 days. 4 weeks later, lymphocytes were isolated from the small intestine lamina propria. Representative flow cytometry dot plots (left) and quantitative data (right) of RORγt expression by CD25WT and CD25iKO tdTomato+ Tregs (B) or CD4+ GFP tdTomato conventional T cells (C) Data (n = 7–8) from at least two replicate experiments were analyzed by an unpaired t-test. ∗∗p < 0.01.
Figure 7
Figure 7
IL-2R signaling represses IFNγ immune signature associated with eTregs (A) IFNγR1 expression overlayed on UMAP plots (Figure 4A), where transcript abundance is designated by color intensity for CD25WT and CD25iKO Tregs. (B) Representative flow cytometry histogram (left) and quantitative data (right) of expression of IFNγR1 by CD25WT and CD25iKO Tregs. (C) Heatmap of DEGs between CD25WT and CD25iKO splenic Treg subsets from the Hallmark Interferon Gamma Response pathway. (D–I) CD25WT and CD25iKO mice were treated with tamoxifen. Four weeks later, lymphocytes from the MLN and small intestine lamina propria were cultured in the presence of Golgi inhibitors with and without PMA/Ionomycin for 4 h and the indicated cytokines were enumerated by intracellular FACS analysis. Representative flow cytometry dot plots from the lamina propria (D, F) or MLN (H) and quantitative data (E, G, I) for IFNγ-producing CD4+ T conventional (E) and CD8+ (G) T cells and tdTomato+ Tregs (I). Data (n = 4–8) are from at least two replicate experiments were analyzed by unpaired t-test, ∗p < 0.05, ∗∗p < 0.01.
Figure 8
Figure 8
Post-thymic IL-2R signaling is required for Treg subset maintenance, stability and self-tolerance Homeostatic IL-2R signaling maintains cTreg transcriptional programs and regulates the balance between TFR, TR17 and other eTregs. Under low IL-2R signaling, the cTreg transcriptional program is lost and cTregs differentiate more readily into eTregs. TR17 differentiation is inhibited and other eTregs become more abundant. IFNγR1+ Tregs are generated and Tregs suppressive function is compromised, leading to a TH1-type inflammatory response.

References

    1. Toomer K.H., Lui J.B., Altman N.H., Ban Y., Chen X., Malek T.R. Essential and non-overlapping IL-2Rα-dependent processes for thymic development and peripheral homeostasis of regulatory T cells. Nat. Commun. 2019;10:1037. - PMC - PubMed
    1. Chinen T., Kannan A.K., Levine A.G., Fan X., Klein U., Zheng Y., Gasteiger G., Feng Y., Fontenot J.D., Rudensky A.Y. An essential role for the IL-2 receptor in Treg cell function. Nat. Immunol. 2016;17:1322–1333. - PMC - PubMed
    1. Fontenot J.D., Rasmussen J.P., Gavin M.A., Rudensky A.Y. A function for interleukin 2 in Foxp3-expressing regulatory T cells. Nat. Immunol. 2005;6:1142–1151. - PubMed
    1. Shouse A.N., LaPorte K.M., Malek T.R. Interleukin-2 signaling in the regulation of T cell biology in autoimmunity and cancer. Immunity. 2024;57:414–428. - PMC - PubMed
    1. Marshall D., Sinclair C., Tung S., Seddon B. Differential requirement for IL-2 and IL-15 during bifurcated development of thymic regulatory T cells. J. Immunol. 2014;193:5525–5533. - PMC - PubMed

LinkOut - more resources