

Optical coherence tomography angiography enables visualization of microvascular patterns in chronic venous insufficiency
- PMID: 39759076
- PMCID: PMC11700630
- DOI: 10.1016/j.isci.2024.110998
Optical coherence tomography angiography enables visualization of microvascular patterns in chronic venous insufficiency
Abstract
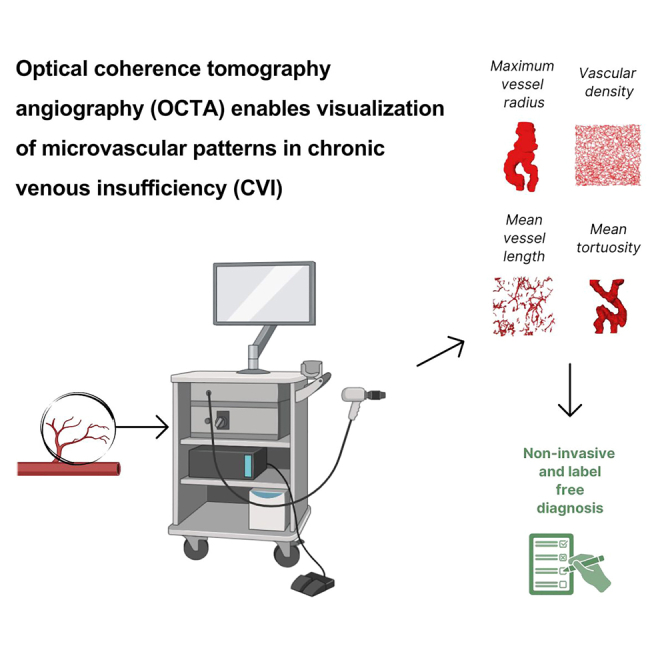
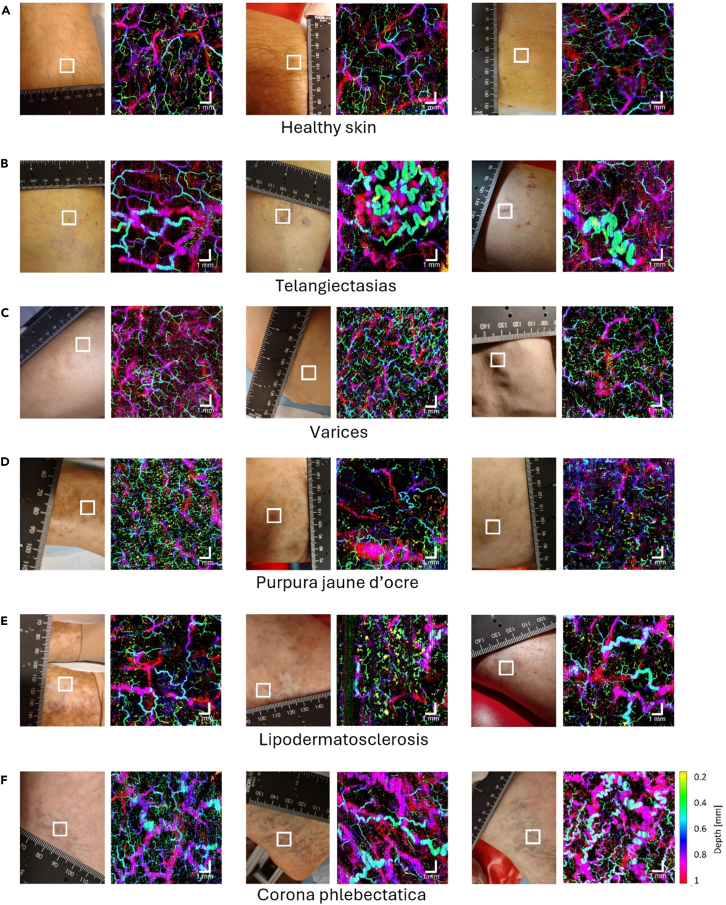
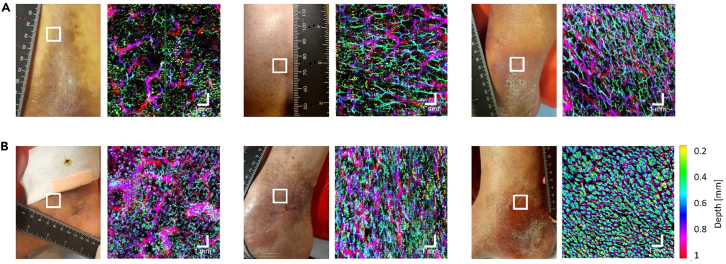
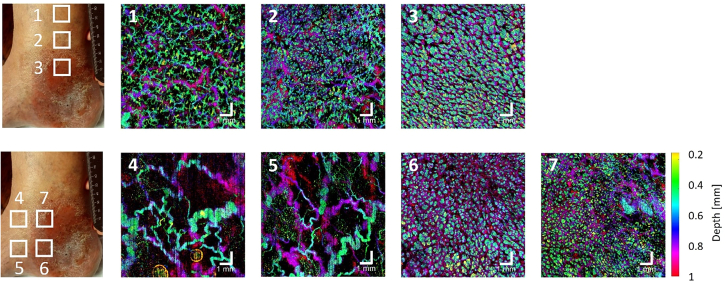
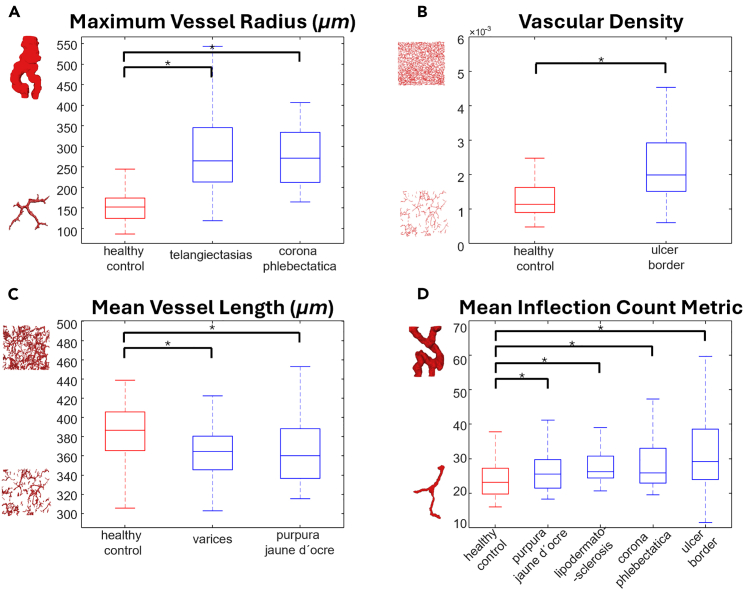
Chronic venous insufficiency (CVI) is a global health concern with significant public health and individual impact. Currently available diagnostic methods cannot visualize microvenous pathologies that have shown to result in severe forms of CVI and also affect the skin. Optical coherence tomography angiography (OCTA) may close the CVI diagnostic gap by providing a fast, label-free, and non-invasive solution to visualize cutaneous microvasculature. The study enlisted 66 subjects, including 53 CVI patients spanning all clinical-etiology-anatomic-pathophysiologic (CEAP) C stages and 13 healthy controls. The high spatial resolution OCTA system used was specifically designed for skin imaging. Significant microangiographic pattern variations emerged, both in qualitative and quantitative terms. OCTA provided valuable insights into cutaneous microvascular changes among different CVI stages. Thereby, OCTA may enable the selection of patient populations at risk for disease progression in the future.
Keywords: Health sciences; Optical imaging; Vascular anatomy.
© 2024 The Author(s).
Conflict of interest statement
The authors declare no competing interests.
Figures
References
-
- Kim Y., Png C.Y.M., Sumpio B.J., DeCarlo C.S., Dua A. Defining the human and health care costs of chronic venous insufficiency. Semin. Vasc. Surg. 2021;34:59–64. - PubMed
-
- Wrona M., Jöckel K.H., Pannier F., Bock E., Hoffmann B., Rabe E. Association of venous disorders with leg symptoms: Results from the Bonn vein study 1. Eur. J. Vasc. Endovasc. Surg. 2015;50:360–367. - PubMed
-
- Robertson L., Evans C., Fowkes F.G.R. Epidemiology of chronic venous disease. Phlebology. 2008;23:103–111. - PubMed
-
- Carpentier P.H., Maricq H.R., Biro C., Ponçot-Makinen C.O., Franco A. Prevalence, risk factors, and clinical patterns of chronic venous disorders of lower limbs: A population-based study in France. J. Vasc. Surg. 2004;40:650–659. - PubMed
-
- Lurie F., Passman M., Meisner M., Dalsing M., Masuda E., Welch H., Bush R.L., Blebea J., Carpentier P.H., De Maeseneer M., et al. The 2020 update of the CEAP classification system and reporting standards. J. Vasc. Surg. Venous Lymphat. Disord. 2020;8:342–352. - PubMed
LinkOut - more resources
Full Text Sources
Miscellaneous
