. 2024 Sep 25;27(11):111030.
doi: 10.1016/j.isci.2024.111030. eCollection 2024 Nov 15.

MP: A steady-state visual evoked potential dataset based on multiple paradigms

Affiliations

MP: A steady-state visual evoked potential dataset based on multiple paradigms

Xi Zhao et al. iScience. .

Abstract

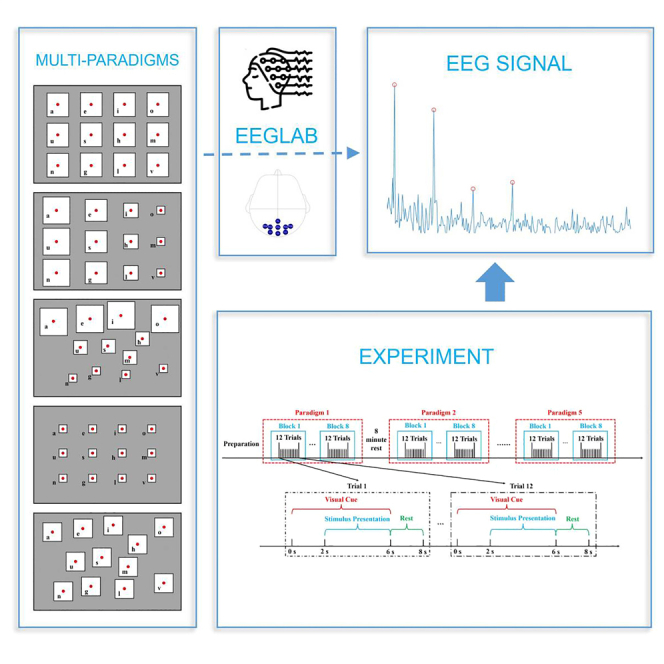
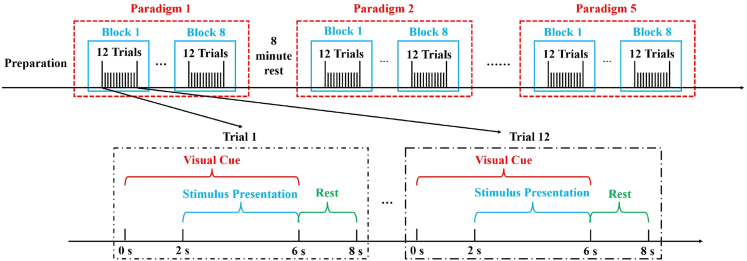
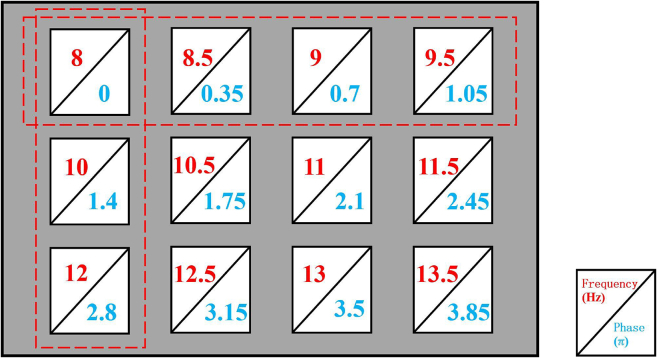
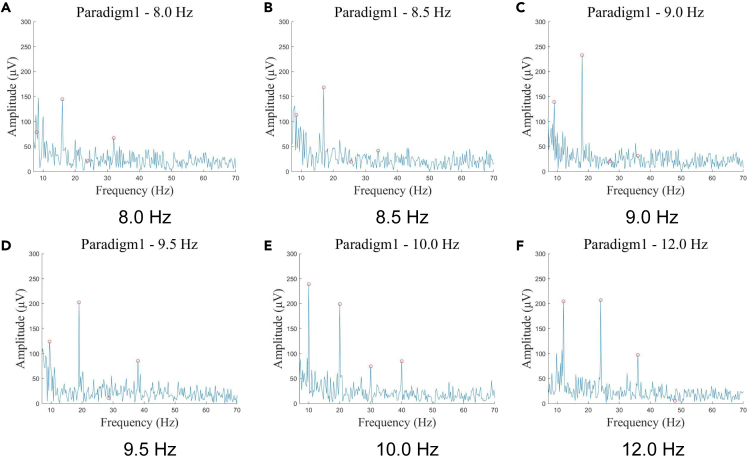
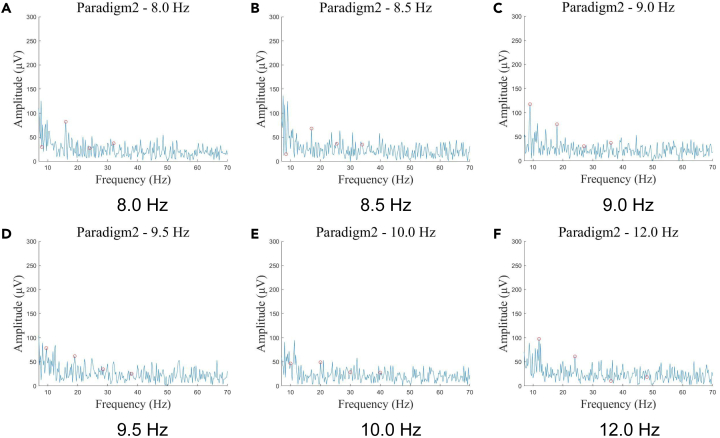
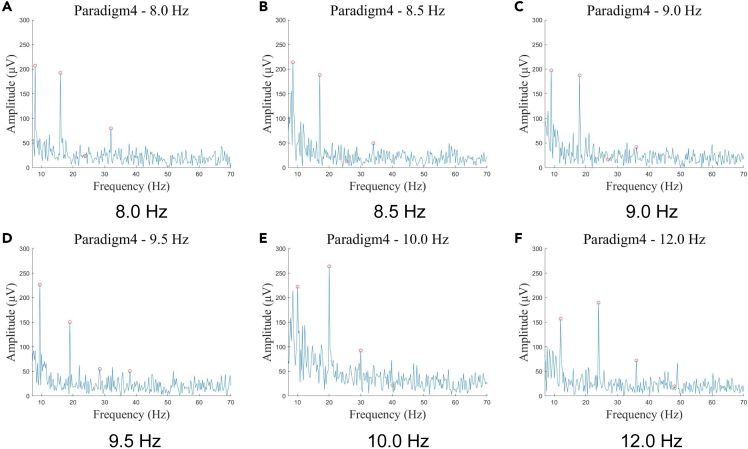
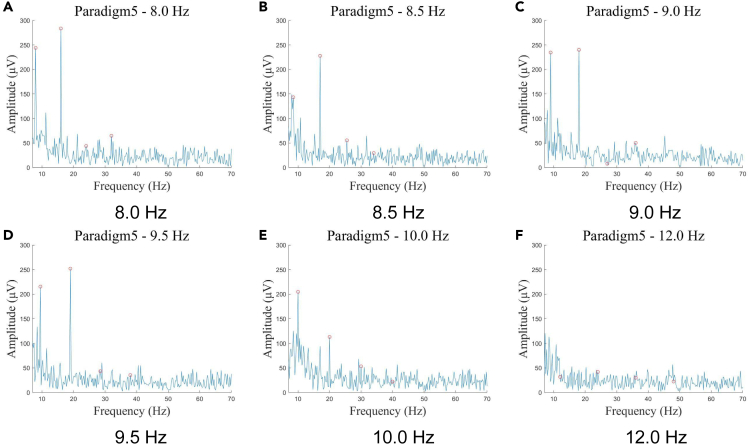
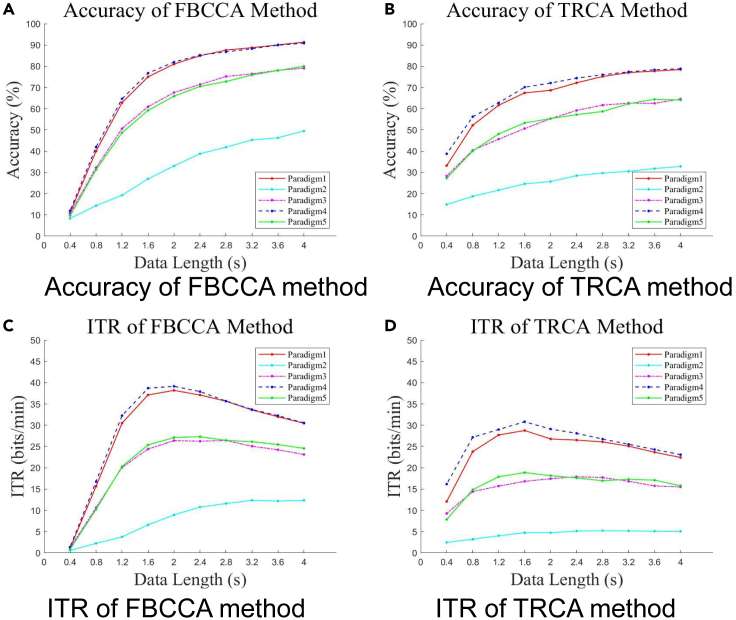
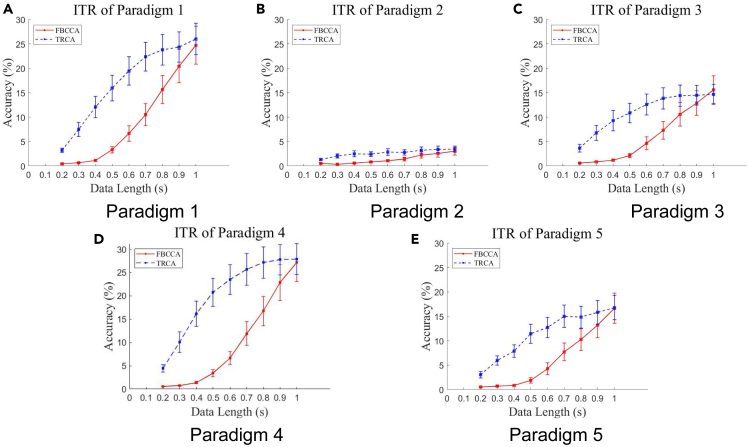
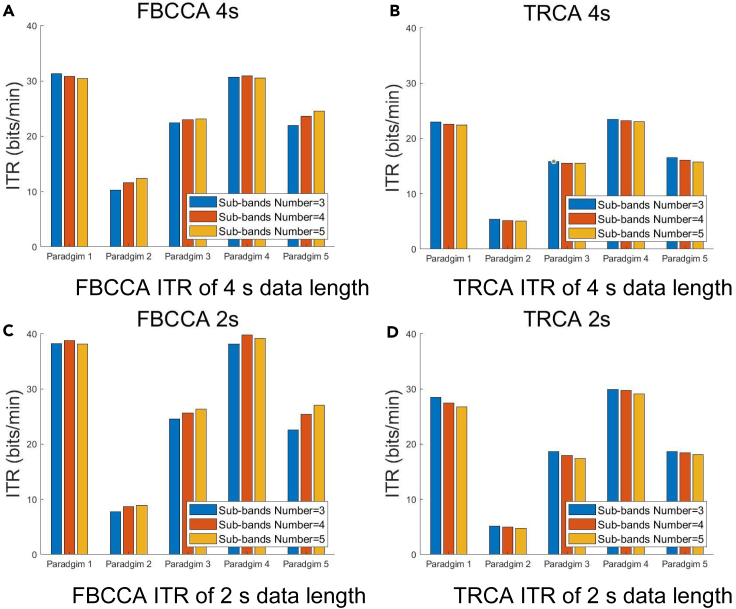
In the field of steady-state visual evoked potential (SSVEP), stimulus paradigms are regularly arranged or mimic the style of a keyboard with the same size. However, stimulation paradigms have important effects on the performance of SSVEP systems, which correlate with the electroencephalogram (EEG) signal amplitude and recognition accuracy. This paper provides MP dataset that was acquired using a 12-target BCI speller. MP dataset contains 9-channel EEG signals from the occipital region of 24 subjects under 5 stimulation paradigms with different stimulus sizes and arrangements. Stimuli were encoded using joint frequency and phase modulation (JFPM) method. Subjects completed an offline prompted spelling task using a speller under 5 paradigms. Each experiment contains 8 blocks, and each block contains 12 trials. Designers can use this dataset to test the performance of algorithms considering "stimulus size" and "stimulus arrangement". EEG data showed SSVEP features through amplitude-frequency analysis. FBCCA and TRCA confirmed its suitability.

Keywords: Health sciences; Natural sciences; computer science.


Conflict of interest statement

The authors declare no competing interests.

Figures

None
Graphical abstract
Figure 1
Figure 1
The 5 stimulation paradigms for which the experiment was designed (A) Paradigm 1: The squares are of the same size, with large square dimensions and regular arrangement. (B) Paradigm 2: The squares are of the same size, with small square dimensions and regular arrangement. (C) Paradigm 3: The squares are decreasing in size by columns and regularly arranged. (D) Paradigm 4: The squares are of the same size, with large square dimensions and irregular arrangement. (E) Paradigm 5: The squares are irregularly arranged in decreasing size by row.
Figure 2
Figure 2
Frequency and phase of 5 stimulation paradigms (A–E) Following a left-to-right, top-to-bottom coding sequence, the stimulation frequencies ranged from 8 Hz to 13.5 Hz at intervals of 0.5 Hz, and the additional phase ranged from 0 to 3.85 π at intervals of 0.35 π.
Figure 3
Figure 3
Process of the experiment to be completed by each subject, which consisted of 5-paradigm task Each paradigm task contained 8 blocks, and each block contained 12 trials lasting 8 s. The trail was divided into 3 steps: (1) Visual Cue (6 s), (2) Stimulation Presentation (4 s) and (3) Rest (2 s).
Figure 4
Figure 4
The acquisition device NeuroHUB from Neuracle.
Figure 5
Figure 5
Nine electrodes in the occipital region
Figure 6
Figure 6
Six targets selected for amplitude-frequency analysis
Figure 7
Figure 7
Amplitude spectra of the six targets in Paradigm 1 (A–F) Except for the one at 8 Hz, distinct peak amplitudes can be observed at both the fundamental frequency and the first harmonic frequency. The values of the peak amplitudes at the SSVEP frequencies of the six targets are relatively similar.
Figure 8
Figure 8
Amplitude spectra of the six targets in Paradigm 2 (A–F) The peaks of all six targets can be observed at the position of the first harmonic of the SSVEP frequency, but the peaks are not obvious. The values of the peak amplitude of the SSVEP frequency were relatively similar for all six targets.
Figure 9
Figure 9
Amplitude spectra of the six targets in Paradigm 3 (A–F) Peaks are observed at the fundamental and first harmonic frequency positions for all six targets. For the four targets, 8.0 Hz, 8.5 Hz, 9.0 Hz, and 9.5 Hz, which had decreasing stimulus square sizes, the amplitude of the SSVEP frequency conformed to the trend of decreasing with decreasing stimulus size, and the peaks became less pronounced. For the three targets with the same stimulus size of 8.0 Hz, 10.0 Hz, and 12.0 Hz, the peak amplitudes of their SSVEP frequencies were more similar.
Figure 10
Figure 10
Amplitude spectra of the six targets in Paradigm 4 (A–F) Obvious peak amplitudes can be observed at both the fundamental and the first harmonic for all six targets. The peak amplitudes are relatively similar for all six targets. Compared with Paradigm 1, the peak amplitude values at the SSVEP frequency are relatively similar for both.
Figure 11
Figure 11
Amplitude spectra of the six targets in Paradigm 5 (A–F) All six targets observe peaks at the fundamental and first harmonic frequency positions. For the four targets, 8.0 Hz, 8.5 Hz, 9.0 Hz, and 9.5 Hz, which have the same stimulus square size and more similar peak amplitudes, the peaks are clearly observed at both the fundamental and first harmonic frequency locations. For the three targets with decreasing stimulus sizes, 8.0 Hz, 10.0 Hz, and 12.0 Hz, their peak amplitude values at the SSVEP frequency also tend to a decrease with decreasing stimulus size, and their peak frequency become less pronounced compared to the other frequencies.
Figure 12
Figure 12
Cross-sectional comparison of accuracy and ITR of five paradigms using FBCCA method and TRCA method (A–D) Accuracy and ITR for all 5 paradigms both show the trend: Paradigm 1 ≈ Paradigm 4 > Paradigm 5 ≈ Paradigm 3 > Paradigm 2.
Figure 13
Figure 13
Accuracy of FBCCA and TRCA methods over time (A–E) Under the five SSVEP paradigms, the accuracy of both FBCCA and TRCA increases with increasing data length in all five SSVEP paradigms. The recognition accuracy of TRCA algorithm is better than that of FBCCA method in a short period of time (<1 s). The error bars indicate standard errors.
Figure 14
Figure 14
ITR of FBCCA and TRCA methods over time (A–E) Except for Paradigm 2, the ITR of the remaining four paradigms significantly increased and the ITR of Paradigm 2 increases slightly with accuracy over time. TRCA method shows superior ITR to FBCCA method for shorter stimulation duration (<1 s). The error bars indicate standard errors.
Figure 15
Figure 15
Accuracy of FBCCA and TRCA under sub-bands number of 3, 4, 5 for 5 paradigms with data length of 4 s and 2 s respectively (A) FBCCA result of 4 s data length. (B) TRCA result of 4 s data length. (C) FBCCA result of 2 s data length. (D) TRCA result of 2 s data length.
Figure 16
Figure 16
ITR of FBCCA and TRCA under sub-bands number of 3, 4, 5 for 5 paradigms with data length of 4 s and 2 s respectively (A) FBCCA result of 4 s data length. (B) TRCA result of 4 s data length. (C) FBCCA result of 2 s data length. (D) TRCA result of 2 s data length.

References

    1. Mridha M.F., Das S.C., Kabir M.M., Lima A.A., Islam M.R., Watanobe Y. Brain-computer interface: Advancement and challenges. Sensors. 2021;21:5746. - PMC - PubMed
    1. Chen Y., Yang C., Ye X., Chen X., Wang Y., Gao X. Implementing a calibration-free ssvep-based bci system with 160 targets. J. Neural. Eng. 2021;18 - PubMed
    1. Wang Y., Gao X., Hong B., Jia C., Gao S. Brain-computer interfaces based on visual evoked potentials. IEEE Eng. Med. Biol. Mag. 2008;27:64–71. - PubMed
    1. Vialatte F.-B., Maurice M., Dauwels J., Cichocki A. Steady-state visually evoked potentials: Focus on essential paradigms and future perspectives. Prog. Neurobiol. 2010;90:418–438. - PubMed
    1. Zhang Y., Xu P., Cheng K., Yao D. Multivariate synchronization index for frequency recognition of SSVEP- based brain–computer interface. J. Neurosci. Methods. 2014;221:32–40. - PubMed

LinkOut - more resources