. 2024 Nov 26;36(1):102400.
doi: 10.1016/j.omtn.2024.102400. eCollection 2025 Mar 11.

A sort and sequence approach to dissect heterogeneity of response to a self-amplifying RNA vector in a novel human muscle cell line

Affiliations

A sort and sequence approach to dissect heterogeneity of response to a self-amplifying RNA vector in a novel human muscle cell line

Rachel D Barton et al. Mol Ther Nucleic Acids. .

Abstract

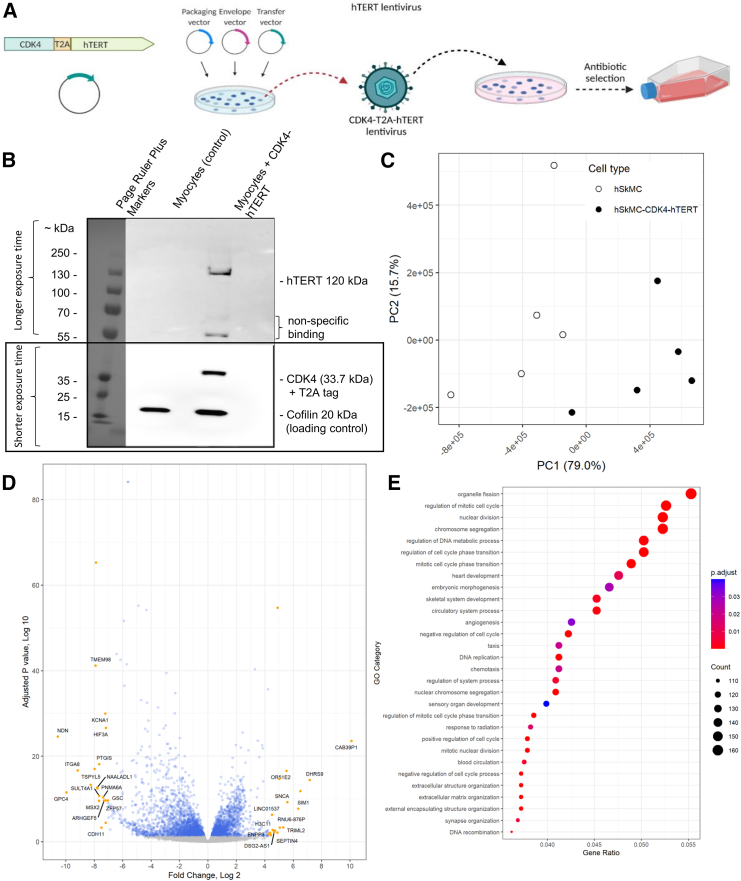
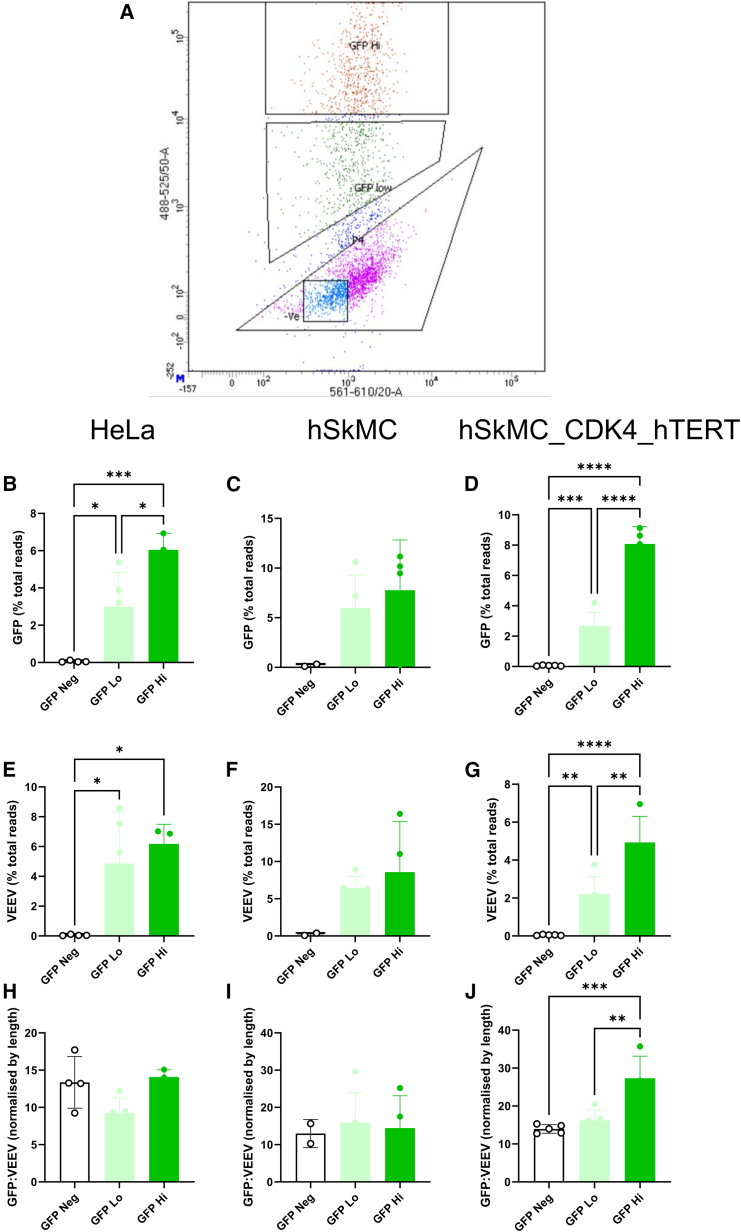
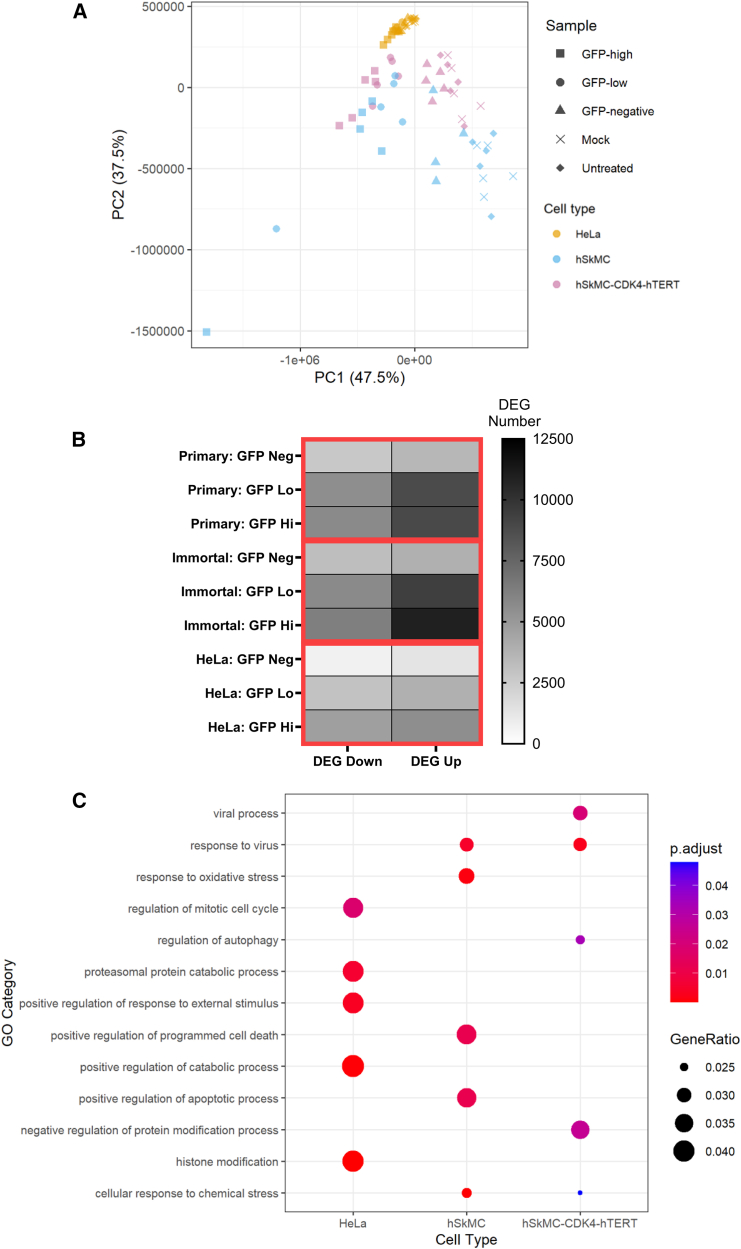
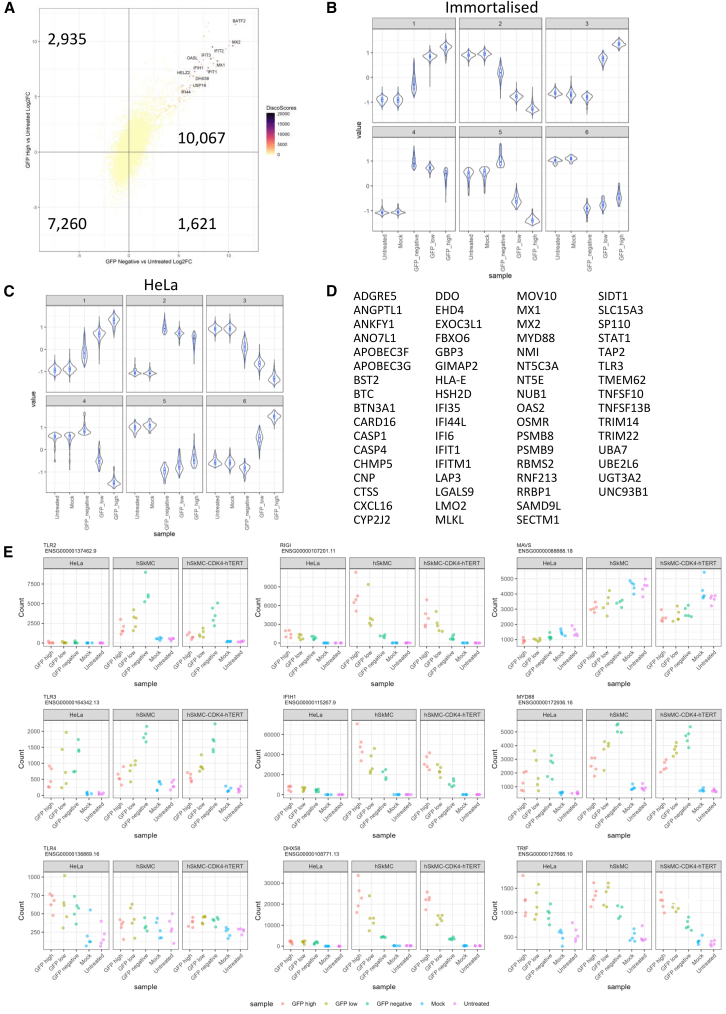
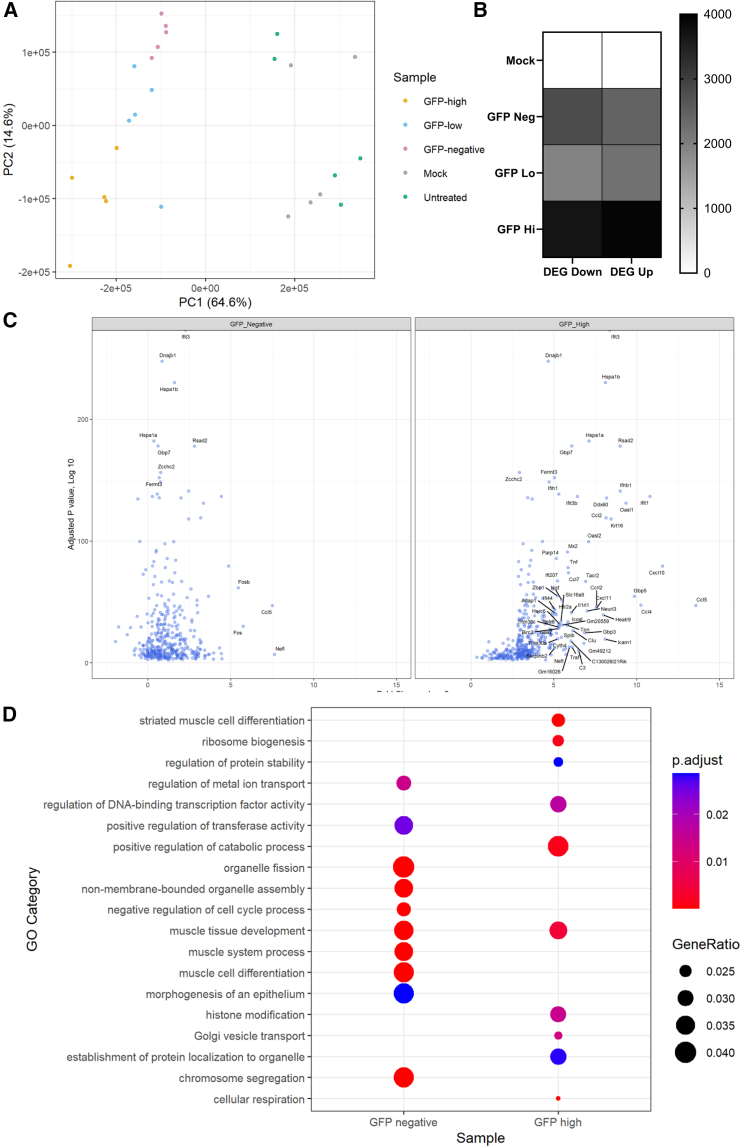
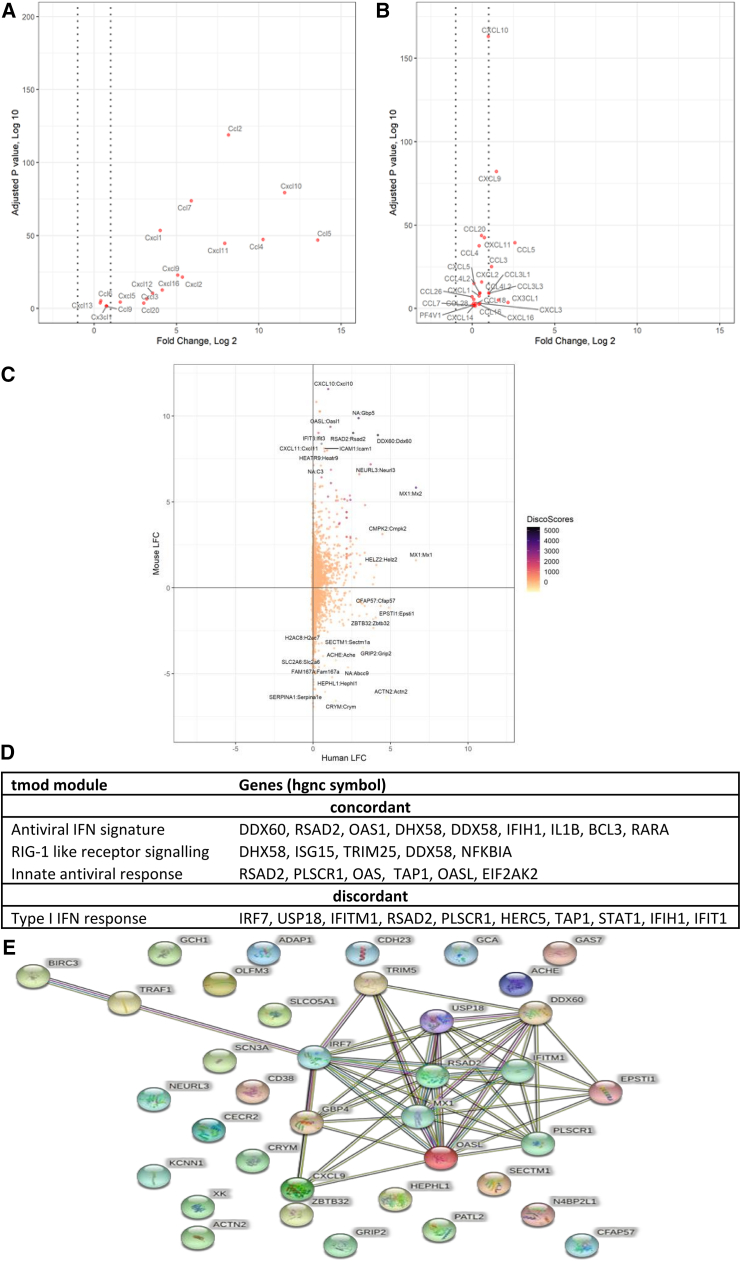
Self-amplifying RNA (saRNA) is an extremely promising platform because it can produce more protein for less RNA. We used a sort and sequence approach to identify host cell factors associated with transgene expression from saRNA; the hypothesis was that cells with different expression levels would have different transcriptomes. We tested this in CDK4/hTERT immortalized human muscle cells transfected with Venezuelan equine encephalitis virus (VEEV)-derived saRNA encoding GFP. Cells with the highest expression levels had very high levels of transgene mRNA (5%-10% total reads); the cells sorted with low and negative levels of GFP protein also had detectable levels of both VEEV and GFP RNA. To understand host responses, we performed RNA sequencing. Differentially expressed gene (DEG) patterns varied with GFP expression; GFP high cells had many more DEGs, which were associated with protein synthesis and cell metabolism. Comparing profiles by an unsupervised approach revealed that negative cells expressed higher levels of cell-intrinsic immunity genes such as IFIT1, MX1, TLR3, and MyD88. To explore the role of interferon, cells were treated with the Jak inhibitor ruxolitinib. This reduced the number of DEGs, but differences between cells sorted by expression level remained. These studies demonstrate the complex interplay of factors, some immune related, affecting saRNA transgenes.

Keywords: MT: Delivery Strategies; RNA; alphavirus; expression; innate immunity; self-amplifying; vaccine.


Conflict of interest statement

The authors declare no competing interests.

Figures

None
Graphical abstract
Figure 1
Figure 1
Production of immortalized muscle cells using lentivirus-mediated transduction of human primary myoblasts (A) Scheme for immortalization of muscle cells by lentivirus gene delivery. (B) Western blot detecting CDK4 and hTERT in myoblast lysates, with a cofilin loading control. Untransfected myocytes are used as a negative control. The blot in (B) was captured with two different exposure times to prevent over- or underexposure of the different bands. (C) PCA plot showing the first two PCs of the primary and immortalized muscle dataset. (D) Volcano plot showing the log2FC and the corresponding adjusted p values for each gene in the immortalized muscle cells with respect to the primary muscle cells. The values were calculated using the DESeq2 Wald method. The significant genes are indicated in blue and the not-significant genes are indicated in gray. Genes with particularly high log2FC are indicated in orange and labeled with the corresponding HUGO Gene Nomenclature Committee symbol. (E) Dot plot showing the top 30 GO terms. The color of the dots represents the adjusted p values, and the dot size is representative of the number of DEGs associated with the GO term. Benjamini-Hochberg used to adjust p value.
Figure 2
Figure 2
Uptake of saRNA and antigen expression is associated with increased host gene expression in primary and immortalized muscle cell lines Cells were transfected with 1 ng/μL VEEV GFP (total amount 1 μg) on 106 cells, 16 h after transfection. (A) Cells were sorted for GFP expression, splitting into the top 40% brightest (GFP Hi), bottom 40% (GFP Low), and GFP (-ve). GFP subgenomic mRNA counts (B–D) and VEEV genomic replicon (E–G) counts were calculated as a percentage of total reads in sorted cells by cell type: HeLa (B and E), hSkMC (C and F), and hSkMC_CDK4_hTERT (D and G). GFP to VEEV ratio normalized to length (H–J). ∗ p < 0.05; ∗∗ p < 0.01; ∗∗∗ p < 0.001; ∗∗∗∗ p < 0.0001.
Figure 3
Figure 3
Uptake of saRNA and antigen expression are associated with increased host gene expression in primary and immortalized muscle cell lines (A) After sorting, RNA was extracted and global responses in different treatments/cell types were assessed by PCA. (B) Differential gene expression was determined with DESeq2; overall numbers of DEGs for each condition with an adjusted p < 0.05 cutoff (Benjamini-Hochberg). (C) DEG were clustered by GO term. N = 3 replicates per cell type/condition.
Figure 4
Figure 4
Cells with high GFP expression following transfection with VEEV upregulate similar patterns of innate immune genes Cells were saRNA transfected, sorted for GFP expression, and RNA-seq analysis performed. (A–C) Differential gene expression between transfected and mock control cells for (A) primary muscle cells, (B) immortalized muscle cells, and (C) HeLa cells. (D and E) Venn diagram of shared genes between GFP (D) and GFP high (E) cells, with FC >2 and p < 0.05 cutoff. (F and G) Heatmap of expression of significant (p < 0.05) differentially expressed innate immune (F; GO: 0045087) and cytokine activity (G; GO: 0005125) genes. Tile color represents log2FC from untreated control samples, and genes are clustered based on the similarity of expression profile. N = 3 replicates per cell type/condition.
Figure 5
Figure 5
GFP high and GFP cells had differences in host gene expression associated with the innate immune response (A) Concordance and discordance (using the DISCO tool) between HeLa GFP high and GFP cells. (B and C) Comparing the differences between GFP-high and GFP RNA-seq datasets, genes were clustered using the degPatterns tool for immortalized muscle (B) and HeLa (C) cells. (D) Individual genes in all three clusters. (E) Expression (normalized counts) of individual genes of interest.
Figure 6
Figure 6
The JAK-STAT inhibitor (ruxolitinib) reduces the number of DEGs following saRNA transfection, but there were still differences between cells when sorted by expression level HeLa and primary muscle cell line were treated with 30 ng/μL ruxolitinib (Ruxo) before transfection. Cells were transfected with 1 ng/μL VEEV GFP; 16 h after transfection, cells were sorted for GFP expression, splitting into the top 40% brightest (GFP Hi), bottom 40% (GFP Lo), and GFP (GFP Neg). After sorting, RNA was extracted for RNA-seq analysis. GFP subgenomic mRNA counts (A and C) and VEEV genomic replicon (B and D) counts were calculated as a percentage of total reads in sorted cells by cell type: HeLa (A and C) and hSkMC_CDK4_hTERT (B and D). (E) Global responses in different treatments/cell types were assessed by PCA. (F) Heatmap of expression of significant (adjusted p < 0.05, Benjamini-Hochberg) differentially expressed innate immune genes (GO: 0045087). (G) Differential gene expression between transfected and mock control cells for immortalized muscle cells. ∗ p < 0.05; ∗∗ p < 0.01; ∗∗∗ p < 0.001; ∗∗∗∗ p < 0.0001.
Figure 7
Figure 7
Transcriptomic responses to saRNA in mouse muscle Mouse C2C12 myoblast cells were transfected with 1 ng/μL VEEV GFP in the presence of 30 ng/μL ruxolitinib. At 16 h after transfection, cells were sorted for GFP expression, splitting into the top 40% brightest (GFP Hi), bottom 40% (GFP Lo), and GFP (GFP Neg). (A) After sorting, RNA was extracted, and global responses in different treatments/cell types were assessed by PCA. (B) Differential gene expression was determined by the LRT function of DESeq2; overall numbers of DEG for each condition with an adjusted p < 0.01 cutoff (Benjamini-Hochberg). (C) Differential gene expression between transfected and mock control cells. (D) DEGs were clustered by GO term. N = 3 replicates per cell type/condition.
Figure 8
Figure 8
Both human and mouse cell lines express IFN-related genes in response to saRNA, but there are differences between the cell lines RNA-seq data from the human and mouse myoblast cell lines were compared. (A and B) Log2FC in expression across all samples (mock, GFP, GFP low, GFP high) compared to the baseline untreated sample for chemokine activity (GO: 0008009) in mouse (A) and human (B) myoblasts. (C) DISCO analysis of top 400 human DEGs compared to mouse orthologs. (D) Key concordant and discordant gene sets. (E) STRING analysis of most discordant genes by expression level in human cells.

References

    1. Pepini T., Pulichino A.M., Carsillo T., Carlson A.L., Sari-Sarraf F., Ramsauer K., Debasitis J.C., Maruggi G., Otten G.R., Geall A.J., et al. Induction of an IFN-Mediated Antiviral Response by a Self-Amplifying RNA Vaccine: Implications for Vaccine Design. J. Immunol. 2017;198:4012–4024. - PMC - PubMed
    1. Guy C., Bowie A.G. Recent insights into innate immune nucleic acid sensing during viral infection. Curr. Opin. Immunol. 2022;78 - PubMed
    1. Brito L.A., Chan M., Shaw C.A., Hekele A., Carsillo T., Schaefer M., Archer J., Seubert A., Otten G.R., Beard C.W., et al. A Cationic Nanoemulsion for the Delivery of Next-generation RNA Vaccines. Mol. Ther. 2014;22:2118–2129. - PMC - PubMed
    1. Shirota H., Petrenko L., Hong C., Klinman D.M. Potential of transfected muscle cells to contribute to DNA vaccine immunogenicity. J. Immunol. 2007;179:329–336. - PubMed
    1. Hassett K.J., Rajlic I.L., Bahl K., White R., Cowens K., Jacquinet E., Burke K.E. mRNA vaccine trafficking and resulting protein expression after intramuscular administration. Mol. Ther. Nucleic Acids. 2024;35 - PMC - PubMed

LinkOut - more resources