Unravelling distinct patterns of metagenomic surveillance and respiratory microbiota between two P1 genotypes of Mycoplasma pneumoniae
- PMID: 39760260
- PMCID: PMC11730683
- DOI: 10.1080/22221751.2024.2449087
Unravelling distinct patterns of metagenomic surveillance and respiratory microbiota between two P1 genotypes of Mycoplasma pneumoniae
Abstract
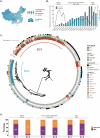
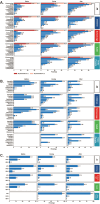
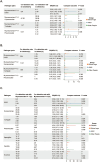
To unravel distinct patterns of metagenomic surveillance and respiratory microbiota between Mycoplasma pneumoniae (M. pneumoniae) P1-1 and P1-2 and to explore the impact of the COVID-19 pandemic on epidemiological features, we conducted a multicentre retrospective study which spanned 90,886 pneumonia patients, among which 3164 cases M. pneumoniae were identified. Our findings revealed a concurrent outbreak of M. pneumoniae, with the positivity rate rising sharply to 9.62% from July 2023, compared to the 0.16% to 4.06% positivity rate observed during the 2020-2022 COVID-19 pandemic. P1-1 had a higher odds ratio of co-detecting opportunistic pathogens. However, no significant differences were observed in the co-detection odds ratio between children and other age groups in P1-2. This study is the first to demonstrate differences in relative abundance, diversity of respiratory microbiota and co-detection rate of opportunistic pathogen between M. pneumoniae P1-1 and P1-2. Through bronchoalveolar lavage (BAL) metagenomic and host transcriptomic analyses, we identified variations in co-detection rates of M. pneumoniae P1-1 genotype with opportunistic pathogens like S. pneumoniae, alterations in respiratory microbiota composition, lung inflammation, and disruption of ciliary function. Consistent with the results of host transcriptome, we found that P1-1 infections were associated with significantly higher rates of requiring respiratory support and mechanical ventilation compared to P1-2 infections (Fisher's exact test, p-value = 0.035/0.004). Our study provides preliminary evidence of clinical severity between M. pneumoniae strains, underscoring the need for ongoing research and development of targeted therapeutic strategies.
Keywords: Mycoplasma pneumoniae; P1 genotype; clinical outcome; host immune response; respiratory microbiota.
Conflict of interest statement
No potential conflict of interest was reported by the author(s).
Figures


Similar articles
-
P1 adhesin genotype characteristics of Mycoplasma pneumoniae in China from 2017 to 2019.Front Cell Infect Microbiol. 2025 Feb 17;15:1513177. doi: 10.3389/fcimb.2025.1513177. eCollection 2025. Front Cell Infect Microbiol. 2025. PMID: 40034391 Free PMC article.
-
Characteristics of lower respiratory microbiota in children's refractory Mycoplasma pneumoniae pneumonia pre- and post-COVID-19 era.Front Cell Infect Microbiol. 2025 Jan 21;14:1438777. doi: 10.3389/fcimb.2024.1438777. eCollection 2024. Front Cell Infect Microbiol. 2025. PMID: 39906212 Free PMC article.
-
Mycoplasma pneumoniae infection outbreak in Guangzhou, China after COVID-19 pandemic.Virol J. 2024 Aug 11;21(1):183. doi: 10.1186/s12985-024-02458-z. Virol J. 2024. PMID: 39129001 Free PMC article.
-
Synergistic impact of macrolide resistance and H3N2 infection on M. pneumoniae outbreak in children.Microbiol Spectr. 2025 Apr;13(4):e0184424. doi: 10.1128/spectrum.01844-24. Epub 2025 Feb 25. Microbiol Spectr. 2025. PMID: 39998323 Free PMC article.
-
Epidemiology of Mycoplasma pneumoniae prevalence in Iranian patients: a systematic review and meta-analysis.J Med Microbiol. 2019 Nov;68(11):1614-1621. doi: 10.1099/jmm.0.001079. J Med Microbiol. 2019. PMID: 31524582
Cited by
-
Understanding the unconventional reemergence of M. pneumoniae epidemics during the COVID-19 pandemic.Transl Pediatr. 2025 Mar 31;14(3):473-479. doi: 10.21037/tp-24-482. Epub 2025 Mar 26. Transl Pediatr. 2025. PMID: 40225082 Free PMC article. Review.
-
P1 adhesin genotype characteristics of Mycoplasma pneumoniae in China from 2017 to 2019.Front Cell Infect Microbiol. 2025 Feb 17;15:1513177. doi: 10.3389/fcimb.2025.1513177. eCollection 2025. Front Cell Infect Microbiol. 2025. PMID: 40034391 Free PMC article.
-
An mRNA Vaccine Targeting the C-Terminal Region of P1 Protein Induces an Immune Response and Protects Against Mycoplasma pneumoniae.Int J Mol Sci. 2025 Jul 7;26(13):6536. doi: 10.3390/ijms26136536. Int J Mol Sci. 2025. PMID: 40650312 Free PMC article.
References
Publication types
MeSH terms
LinkOut - more resources
Full Text Sources
Other Literature Sources
Medical
