. 2025 Jan;97(1):e70156.
doi: 10.1002/jmv.70156.

SARS-CoV-2 Productively Infects Human Hepatocytes and Induces Cell Death

Affiliations

SARS-CoV-2 Productively Infects Human Hepatocytes and Induces Cell Death

Chunkyu Ko et al. J Med Virol. 2025 Jan.

Abstract

SARS-CoV-2 infection is accompanied by elevated liver enzymes, and patients with pre-existing liver conditions experience more severe disease. While it was known that SARS-CoV-2 infects human hepatocytes, our study determines the mechanism of infection, demonstrates viral replication and spread, and highlights direct hepatocyte damage. Viral replication was readily detectable upon infection of primary human hepatocytes and hepatoma cells with the ancestral SARS-CoV-2, Delta, and Omicron variants. Hepatocytes express the SARS-CoV-2 receptor ACE2 and the host cell protease TMPRSS2, and knocking down ACE2 and TMPRSS2 impaired SARS-CoV-2 infection. Progeny viruses released from infected hepatocytes showed the typical coronavirus morphology by electron microscopy and proved infectious when transferred to fresh cells, indicating that hepatocytes can contribute to virus spread. Importantly, SARS-CoV-2 infection rapidly induced hepatocyte death in a replication-dependent fashion, with the Omicron variant showing faster onset but less extensive cell death. C57BL/6 wild-type mice infected with a mouse-adapted SARS-CoV-2 strain showed high levels of viral RNA in liver and lung tissues. ALT peaked when viral RNA was cleared from the liver. Liver histology revealed profound tissue damage and immune cell infiltration, indicating that direct cytopathic effects of SARS-CoV-2 and immune-mediated killing of infected hepatocytes contribute to liver pathology.

Keywords: ACE2; COVID‐19; SARS‐CoV‐2; TMPRSS2; hepatocytes; liver; tropism.


Conflict of interest statement

UP received grants from SCG Cell Therapy, and VirBio and personal fees from Abbott, Abbvie, Arbutus, Gilead, GSK, Leukocare, J&J, Roche, MSD, Sanofi, Sobi and Vaccitech. UP is a cofounder and share‐holder of SCG Cell Therapy. The other authors declare no conflicts of interest. CAJ reports research funding from the German Center for Lung Research and an issued patent “Bradykinin B2 receptor antagonist for treatment of SARS‐CoV2‐infection” (EP3909646A1).

Figures

Figure 1
Figure 1
ACE2 and TMPRSS2 expression profiles of different cell types. (A, B) The gene expression of ACE2 (A) and TMPRSS2 (B) of eleven different cell types was assessed by RT‐qPCR. ACE2 and TMPRSS2 mRNA levels were normalized to GAPDH mRNA levels. Four different batches of PHH derived from individual donors were included in this analysis. (C) ACE2 and TMPRSS2 protein expression in liver‐derived cell types was analyzed by Western blot analysis under reducing conditions. Protein band intensities were quantified using Multi Gauge software (V3.0) and normalized to GAPDH, which served as a loading control. The relative expression values are shown below the images. (D) Total cell lysate obtained from PHH and Vero‐E6 cells were mock‐treated or treated with PNGase F and subjected to Western blot analysis for the detection of ACE2. ND, not detected; RT‐qPCR, reverse transcription quantitative PCR.
Figure 2
Figure 2
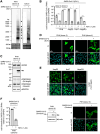
Analysis of SARS‐CoV‐2 replication in hepatocytes. Cells were mock‐infected or infected with SARS‐CoV‐2 (EU1 or Omicron) at an moi of 0.1 pfu/mL for PHH, HepG2, Huh7, Calu‐3 cells. HepaRG cells were infected at an moi of 1 pfu/mL. Cells were collected at 24 h postinfection for the following analysis. (A) Intracellular SARS‐CoV‐2 RNA species were detected by Northern blot analysis with a digoxigenin‐labeled double‐stranded SARS‐CoV‐2 DNA probe complementary to N ORF. 28S and 18S ribosomal RNAs were used for loading control. Arrowhead heads indicate subgenomic (sg) RNAs. Single‐stranded RNA ladders were used as a size‐marking standard. (B) Intracellular SARS‐CoV‐2 RNA levels from untreated control and RDV‐treated samples were analyzed by RT‐qPCR using primers to N gene and were normalized to cellular GAPDH contents. (C) Antigen expression of SARS‐CoV‐2 was assessed in PHH. Western blot analysis detected ACE2, TMPRSS2, and SARS‐CoV‐2 N protein. GAPDH served as a loading control. (D, E) SARS‐CoV‐2 N protein expressing cells were visualized by indirect immunofluorescence staining. DAPI is used as a nuclear counterstain. Bars represent 20 μM. (F, G) Following SARS‐CoV‐2 (Omicron) infection to PHH, SARS‐CoV‐2 RNA and protein contents were analyzed as similar to panel (B–D). EU1, European lineage B.1.177; moi, multiplicity of infection; N, nucleocapsid; Omicron, Omicron variant (B.1.1.529); ORF, open reading frame; pfu, plaque‐forming units; RDV, remdesivir; RT‐qPCR, reverse transcription quantitative PCR. Statistical significance was determined using Student's t‐test (***, p ≤ 0.001; *, p ≤ 0.05).
Figure 3
Figure 3
The role of ACE2 and TMPRSS2 in SARS‐CoV‐2 infection of hepatocytes. (A) PHH were transfected with either siRNA against ACE2 (siACE2) or TMPRSS2 (siTMPRSS2) or control siRNA targeting GFP sequence (siGFP) at the final concentration of 300 nM. After 3 days, cells were additionally infected with SARS‐CoV‐2 (EU1) at an moi of 0.1 pfu/mL. After 24 h, the knockdown efficiency of ACE2 and TMPRSS2 mRNA was determined by RT‐qPCR. The total intracellular SARS‐CoV‐2 RNA levels were measured by RT‐qPCR with an N gene primer set. Cellular and viral RNA contents were normalized to GAPDH mRNA and set relative to siGFP used as control. (B) Another batch of PHH, similar to panel A, was used for SARS‐CoV‐2 infection following siRNA transfection. The sample cotransfected with siACE2 and siTMPRSS2 was included. EU1, European lineage B.1.177; moi, multiplicity of infection; N, nucleocapsid; pfu, plaque‐forming units; RT‐qPCR, reverse transcription quantitative PCR. Statistical significance was determined using Student's t‐test (***, p ≤ 0.001; **, p ≤ 0.01; ns, not significant).
Figure 4
Figure 4
Analysis of morphology and functionality of progeny virions produced from SARS‐CoV‐2 infected hepatocytes. Different cell lines (PHH, HepG2, Huh7 and Vero‐E6) were infected with SARS‐CoV‐2 (EU1) at an moi of 0.1 pfu/mL. After 24 h, the supernatant was collected and clarified by low‐seed centrifugation and either subjected to sucrose gradient ultracentrifugation to concentrate virus particles (A) or directly used to measure the infectious virus titer by plaque assay (B). (A) Transmission electron microscope images of negatively stained SARS‐CoV‐2 particles are shown. Scale 100 nm. (B) SARS‐CoV‐2 plaque phenotypes are shown in original color (left). The virus titer was determined as pfu/ml by counting the number of plaques at appropriate dilutions (right). EU1, European lineage B.1.177; moi, multiplicity of infection; pfu, plaque‐forming units.
Figure 5
Figure 5
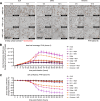
Real‐time imaging and quantitative analysis of hepatocytes infected with SARS‐CoV‐2. PHH were either left uninfected or infected with three different SARS‐CoV‐2 stains at a moi of 0.1 pfu/mL in the presence or absence of RDV (1 µM) or NIR (1 µM) for 1 h. After removing the inoculum (set as time zero), cells were cultured in the presence of Cytotox Red Dye for 72 h. RDV and NIR were continuously added after SARS‐CoV‐2 infection. Cells images were taken by automated, phase‐contrast and fluorescence time‐lapse microscope every 4 h for 72 h. (A) PHH were infected with SARS‐CoV‐2 EU1, Delta or Omicron. Overlays of fluorescence and phase contrast images of PHH taken at time 0 and 72 h are shown. (B) Background‐subtracted total fluorescent objected area (µm2/image) per experimental timeline is plotted as mean ± standard deviation. (C) Phase object confluence showing percentage (%) change from baseline is plotted as mean ± standard deviation. Scale bars represent 200 µm. Delta, Delta variant (B.1.617.2); EU1, European lineage B.1.177; moi, multiplicity of infection; NIR, nirmatrelvir; Omicron, Omicron variant (B.1.1.529); pfu, plaque‐forming units; RDV, remdesivir. See also Supplementary Movies.
Figure 6
Figure 6
Analysis of SARS‐CoV‐2 infection in mice. C57BL/6J mice were randomly allocated into one uninfected control group (n = 3) and three infected groups (n = 5, each). Mice were intranasally infected with 1 × 103 plaque‐forming units of SARS‐CoV‐2 (MA20). Blood and livers were collected at 3, 5, and 7 days postinfection for the following analysis. (A) SARS‐CoV‐2 RNA was analyzed by qRT‐PCR using primers targeting the nucleocapsid gene using a plasmid standard. (B) Mouse liver tissue collected at 5 days postinfection was stained with anti‐SARS‐CoV‐2 spike antibody or hematoxylin and eosin. (C) IL‐6 expression and (D) presence of ALT were assessed in the serum of mice. Mean and SEM are shown. Each dot represents an individual mouse. Data analysis was performed blinded to individual groups. Statistical significance was determined using Student's t test (**, p ≤ 0.01; *, p ≤ 0.05). The scale bar represents 50 µm. LOD: limit of detection.

References

    1. Weiss S. R. and Navas‐Martin S., “Coronavirus Pathogenesis and the Emerging Pathogen Severe Acute Respiratory Syndrome Coronavirus,” Microbiology and Molecular Biology Reviews 69, no. 4 (2005): 635–664. - PMC - PubMed
    1. Alluwaimi A. M., Alshubaith I. H., Al‐Ali A. M., and Abohelaika S., “The Coronaviruses of Animals and Birds: Their Zoonosis, Vaccines, and Models for SARS‐CoV and SARS‐CoV2,” Frontiers in Veterinary Science 7 (2020): 582287. - PMC - PubMed
    1. Zhu N., Zhang D., Wang W., et al., “A Novel Coronavirus From Patients With Pneumonia in China, 2019,” New England Journal of Medicine 382, no. 8 (2020): 727–733. - PMC - PubMed
    1. Zhou P., Yang X. L., Wang X. G., et al., “A Pneumonia Outbreak Associated With a New Coronavirus of Probable Bat Origin,” Nature 579, no. 7798 (2020): 270–273. - PMC - PubMed
    1. Hoffmann M., Kleine‐Weber H., Schroeder S., et al., “SARS‐CoV‐2 Cell Entry Depends on ACE2 and TMPRSS2 and Is Blocked by a Clinically Proven Protease Inhibitor,” Cell 181, no. 2 (2020): 271–280.e8. - PMC - PubMed

Supplementary concepts