. 2025 Feb;75(2):69-81.
doi: 10.1111/pin.13503. Epub 2025 Jan 6.

Superoxide dismutase 2 deficiency in mesenchymal stromal cells induces sympathetic denervation and functional impairment of brown adipose tissue

Affiliations

Superoxide dismutase 2 deficiency in mesenchymal stromal cells induces sympathetic denervation and functional impairment of brown adipose tissue

Yuya Urano et al. Pathol Int. 2025 Feb.

Abstract

Brown adipose tissue (BAT) is an energy-consuming organ, and its functional dysregulation contributes to the development of metabolic diseases and obesity. BAT function is regulated by the sympathetic nervous system but declines with age, which is partly caused by reduced sympathetic nerve fibers innervating BAT. Thus far, the role of mesenchymal stromal/stem cells in age-related BAT dysfunction remains unknown. Here, we show that BAT dysfunction may be induced by a defect in the antioxidant capacity of stromal cells that localize in and around the nerve fibers (perineurial cells) of BAT. These cells express Meflin, a marker of mesenchymal stromal/stem cells. Specific deletion of the antioxidant enzyme superoxide dismutase 2 in Meflin-lineage cells caused sympathetic denervation and whitening of BAT and its functional impairment, as exemplified by a decline in the fat oxidation rate during the daytime. This phenotype was accompanied by overexpression of the neurorepulsive factor semaphorin 3A in perineurial cells. Notably, Meflin-deficient mice exhibited resistance to doxorubicin-induced BAT dysfunction. These results highlight the role of Meflin+ stromal cells, including perineurial cells, in maintaining BAT function and suggest that targeting BAT stromal cells provides a new avenue for improving BAT function.

Keywords: ISLR; Meflin; brown adipose tissue; oxidative stress; perineurial cells; semaphorin 3A.


Conflict of interest statement

Atsushi Enomoto and Shinji Mii are Editorial Board members of Pathology International and co‐authors of this article. To minimize bias, they were excluded from all editorial decision‐making related to the acceptance of this article for publication. All other authors declare no conflict of interest.

Figures
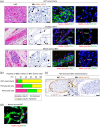
Figure 1
Figure 1
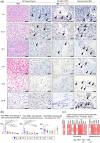
Meflin is expressed in stromal, perivascular, and perineurial cells in human brown adipose tissue (BAT). (a) Histopathological analysis of human infant BAT. The BAT sections were stained with hematoxylin and eosin (H&E) or stained for Meflin (ISLR) by in situ hybridization (ISH) (left two columns). The sections were also double‐stained for Meflin (ISLR, red) and either the brown adipocyte marker UCP1, the endothelial cell marker CD31, the neuronal marker PGP9.5, or the mesenchymal stromal/stem cell marker PDGFRA (green). UCP1, CD31, and PGP9.5 were detected by immunohistochemistry (IHC), while Meflin (ISLR) and PDGFRA were stained by ISH. Nuclei were stained with DAPI (blue). Scale bars: 50 µm. (b) Quantification of the numbers of cells positive for Meflin (ISLR) and PDGFRA in the BAT parenchyma, perivascular, and perineurial areas in the human BAT. Five high‐power field (HPF, ×400) images were evaluated for each area. (c) Serial sections of the human BAT were stained for EMA by IHC (left) and for Meflin (ISLR) by ISH (right). The boxed areas were magnified in the middle panels. Arrowheads denote Meflin (ISLR)‐ and EMA‐double‐positive perineurial cells. Scale bars: 50 µm. (d) Sections from human BAT were double stained for Meflin (ISLR) (red) and EMA (green) by ISH and IHC, respectively. White arrowheads denote red Meflin (ISLR) signals merged with green EMA signals. Nuclei were stained with DAPI (blue). Scale bar: 50 µm.
Figure 2
Figure 2
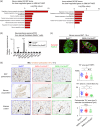
Age‐dependent and cell type‐specific changes of Meflin (ISLR) expression in murine brown adipose tissue (BAT). (a) Tissue sections from BAT in C57BL/6J mice at 2 weeks, 5.5 weeks, 16 weeks, 6 months, 14 months, and 24 months of age were stained by H&E and in situ hybridization (ISH) for Meflin (ISLR). Black arrowheads denote Meflin (ISLR) signals. Scale bars: 50 µm. (b) Quantification of the number of Meflin (ISLR) signals in the indicated areas (BAT parenchyma, perivascular, and perineurial areas). Four high‐power field (HPF) images were randomly selected and evaluated. n = 2–5 per group. (c) Publicly available RNA‐seq data that investigated RNA expression levels in perineurial cells around murine superior cervical ganglia (GSE227493) was analyzed for expression of the indicated genes. Transcriptomic data of each gene is presented as log2‐transformed transcripts per million (TPM). Each square indicates independent transcriptomic data obtained from each sample. n = 3. Data are presented as mean ± standard deviation (SD). Statistical analyses were performed using Steel‐Dwass test (b). *p < 0.05.
Figure 3
Figure 3
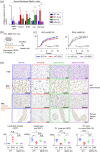
Sod2 deficiency in Meflin‐lineage stromal cells impairs brown adipose tissue (BAT) function in mice. (a) Schematic illustration of Meflin‐Cre and Sod2‐floxed mice. (b) Body weight of 12‐month‐old male Meflin‐Cre; Sod2f/f mice and Sod2f/f mice. n = 5–6 per group. (c) Tissue sections prepared from BAT in 16‐week‐old male Meflin‐Cre; Sod2f/f mice and their control mice were examined by H&E staining and stained for CD31 by immunohistochemistry (IHC), followed by quantification. Large lipid droplets were defined as those larger than 400 μm2. Four high‐power field (HPF) images were randomly selected and evaluated. n = 6–8 per group. Scale bars: 50 µm. (d) Fat oxidation rate (mg/min/kg) of 8‐week‐old male Meflin‐Cre; Sod2f/f mice and Sod2f/f mice calculated by respiratory gas analysis. Data were collected every 5 min for 3 days. Hourly averages and the averages for daytime (8:00–20:00) and nighttime (20:00–8:00) were visualized on the line graph (left) and bar graph (right), respectively. n = 7 per group. (e) Time course of blood glucose level and its area under the curve in 12‐month‐old male Meflin‐Cre; Sod2f/f and Sod2f/f mice intraperitoneally administered D(+)‐Glucose solution at 2 mg/kg after a 6‐h fasting period. n = 5 per group. (f) BAT temperature (surface temperature of the shaved back skin adjacent to the interscapular BAT) of 12‐month‐old male Meflin‐Cre; Sod2f/f mice and Sod2f/f mice under cold conditions. n = 5 per group. (g) Expression of BAT thermogenesis‐related genes in total RNA extracted from bulk BAT specimens of 12‐month‐old male Meflin‐Cre; Sod2f/f mice and Sod2f/f mice. n = 5–6 per group. (h) Ten‐week‐old male Meflin‐Cre; Sod2f/f mice and Sod2f/f mice were fed an HFD for 16 weeks. (i) Body weight change of Meflin‐Cre; Sod2f/f mice and Sod2f/f mice fed an high‐fat diet (HFD). n = 4 per group. (j) Meflin‐Cre; Sod2f/f mice and Sod2f/f mice fed an HFD were intraperitoneally administered D(+)‐Glucose dissolved in PBS at 2 mg/kg after a 6‐h fasting period, followed by measurement of blood glucose level. n = 4 per group. Data were presented as mean ± SD. Statistical analyses were performed by Steel‐Dwass test (c), two‐way repeated measures ANOVA (e [blood glucose level], i and j), and Student's t‐test (b, d [the averages for daytime and nighttime], e [area under the curve], f and g). *p < 0.05; DTR, diphtheria toxin receptor; NS, not significant.
Figure 4
Figure 4
Sod2 deficiency in Meflin‐lineage stromal cells in brown adipose tissue (BAT) induces sympathetic denervation of BAT. (a) Enrichment analyses of gene ontology (GO) biological process (BP) terms for down‐regulated genes in BAT mesenchymal stromal/stem cells (MSCs) of 24‐month‐old mice compared with those cells of 3‐month‐old mice. Neuro‐related (left) and axon‐related (right) GO BP terms that were significantly enriched in 24 M BAT MSCs were summarized in descending order of their p‐values. (b) Relative expression of several neuroguidance genes in fibroblasts isolated from fetal dermis adjacent to interscapular BAT of Meflin‐Cre; Sod2f/f and Sod2f/f mice. n = 4–5 per group. (c) Representative images of in situ hybridization (ISH) analysis for Sema3A (red) and immunofluorescent staining for the neuronal marker PGP9.5 (green) on BAT tissue sections prepared from the indicated mice. Nuclei were stained with DAPI (blue). Red arrowheads denote Sema3A signals. Scale bars: 50 µm. (d) BAT tissue sections from 16‐week‐old male Meflin‐Cre; Sod2f/f mice and their control mice were stained for tyrosine hydroxylase (TH) by immunohistochemistry (IHC), followed by quantification. The representative images of the BAT parenchyma (upper), nerves around BAT (middle), and arteries in BAT (lower) are shown. Four high‐power field (HPF) images were randomly selected and evaluated. n = 6–8 per group. Data are presented as mean ± SD. Statistical analyses were performed using Student's t‐test (b) and Steel‐Dwass test (d). *p < 0.05, ***p < 0.001; NS, not significant.
Figure 5
Figure 5
Involvement of Meflin in oxidative stress‐induced Sema3A upregulation in fibroblasts and brown adipose tissue (BAT) impairment. (a) Relative gene expression in H2O2‐treated fibroblasts isolated from the fetal dermis of WT and Meflin KO mice. n = 6 per group. (b) Two‐week‐old male WT and Meflin KO mice were intraperitoneally (i.p.) administered vehicle (Ve) or doxorubicin (DXR) four times every week for 4 weeks. (c) Body weight of WT (n = 3–18 per group) and Meflin KO (n = 3–4 per group) mice treated with Ve or DXR. (d) Representative images of H&E staining and CD31 and tyrosine hydroxylase (TH) immunostaining of BAT in WT and Meflin KO mice treated with Ve or DXR, followed by quantification. n = 3 per group. Three of four high‐power field (HPF) images were randomly selected and evaluated. Scale bars: 50 µm. Data are presented as mean ± SD. Statistical analyses were performed using Steel‐Dwass test (a and d) and two‐way repeated measures ANOVA (c). *p < 0.05; NS, not significant.
Figure 6
Figure 6
Schematic diagram of the mechanism of oxidative stress‐induced brown adipose tissue (BAT) impairment associated with changes in Meflin+ BAT stromal cells. Our findings suggest that oxidative stress‐ or aging‐induced changes in the expression of genes, including Sema3A, in Meflin+ perineurial cells in BAT may contribute to sympathetic denervation and subsequent BAT impairment. Red circles indicate Sema3A secreted from perineurial cells under oxidative stress. Red arrows indicate increases in the levels of oxidative stress and oxidative stress‐induced Sema3A expression in perineurial cells.

References

    1. Marlatt KL, Ravussin E. Brown adipose tissue: an update on recent findings. Curr Obes Rep. 2017;6:389–396. - PMC - PubMed
    1. Graja A, Schulz TJ. Mechanisms of aging‐related impairment of brown adipocyte development and function. Gerontology. 2015;61:211–217. - PubMed
    1. Becher T, Palanisamy S, Kramer DJ, Eljalby M, Marx SJ, Wibmer AG, et al. Brown adipose tissue is associated with cardiometabolic health. Nat Med. 2021;27:58–65. - PMC - PubMed
    1. Scarpace PJ, Mooradian AD, Morley JE. Age‐associated decrease in beta‐adrenergic receptors and adenylate cyclase activity in rat brown adipose tissue. J Gerontol. 1988;43:B65–B70. - PubMed
    1. Perez LC, Perez LT, Nene Y, Umpierrez GE, Davis GM, Pasquel FJ. Interventions associated with brown adipose tissue activation and the impact on energy expenditure and weight loss: a systematic review. Front Endocrinol. 2022;13:1037458. - PMC - PubMed

MeSH terms

Substances

LinkOut - more resources