. 2025 Jan 6;82(1):35.
doi: 10.1007/s00018-024-05566-9.

ALG5 downregulation inhibits osteogenesis and promotes adipogenesis by regulating the N-glycosylation of SLC6A9 in osteoporosis

Affiliations

ALG5 downregulation inhibits osteogenesis and promotes adipogenesis by regulating the N-glycosylation of SLC6A9 in osteoporosis

Quanfeng Li et al. Cell Mol Life Sci. .

Abstract

Osteoporosis is characterized by decreased bone mass and accumulation of adipocytes in the bone marrow. The mechanism underlying the imbalance between osteoblastogenesis and adipogenesis in bone marrow mesenchymal stem cells (BMSCs) remains unclear. We found that ALG5 was significantly downregulated in BMSCs from osteoporotic specimens. ALG5 knockdown inhibited osteogenic differentiation and increased adipogenic differentiation of BMSCs. ALG5 deficiency diminished the N-glycosylation of SLC6A9, thereby altering its protein stability and disrupting SLC6A9-mediated glycine uptake in BMSCs. ALG5 overexpression by adeno-associated virus serotype 9 (rAAV9) alleviated bone loss in OVX mice. Taken together, our findings suggest a novel role for the ALG5-SLC6A9-glycine axis in the imbalance of BMSC differentiation in osteoporosis. Moreover, we identify ALG5 overexpression as a potential therapeutic strategy for treating osteoporosis.

Keywords: ALG5; Bone marrow mesenchymal stem cells; Glycine; Osteoporosis; SLC6A9.


Conflict of interest statement

Declarations. Conflict of interests: The authors declare that they have no competing interests. Ethical approval: The animal experimentation protocols received approval from the Institutional Animal Care and Use Committee of Sun Yat-Sen University. The assigned approval numbers for the experiments were 2022003644, 2023000742, and 2023001223. Additionally, collection and experimentation involving human specimens were ethically approved by the Ethics Committee of the Eighth Affiliated Hospital, Sun Yat-Sen University, with the respective approval numbers for human subject handling being 2021r037 and 2022r023. Consent for publication: All authors have read and approved the manuscript.

Figures
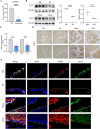
Fig. 1
Fig. 1
ALG5 is downregulated in OP. A The expression of ALG5 in the GEO dataset GSE35956 was analyzed. B, C Protein levels (B) and RNA expression (C) of ALG5 in BMSCs from HDs, OP patients, control mice, and OP model mice (n = 6 in each group). D Representative images of immunohistochemical staining showing decreased ALG5 expression in bone tissues from OP patients and mice with OP. Scale bar = 100 μm. E Representative immunofluorescence images showing the decreased ALG5 expression in bone tissues from OP patients and mice with OP. Scale bar = 50 μm. The statistical data are represented as the means ± SDs, *P < 0.05, **P < 0.01, ***P < 0.005, ****P < 0.001
Fig. 2
Fig. 2
Knockdown of ALG5 inhibits osteoblast differentiation and promotes adipogenic differentiation of BMSCs in vitro and in vivo. A Osteogenic differentiation of BMSCs transfected with siALG5 or siCtrl was determined by ARS and ALP staining. B The quantification of ARS staining was determined by the absorbance at 562 nm, and ALP activity was assessed in units per gram of protein per 15 min (n = 6 in each group). C The protein levels of osteogenic markers in BMSCs transfected with siALG5 or siCtrl after osteogenic induction were determined by western blotting. Scatter plots showing the relative abundances of SP7, BMP2 and Runx2 (n = 3 in each group). D HE staining, Masson staining and Col immunohistochemistry of HA/TCP in ALG5 knockdown and control BMSCs. Scale bar = 100 μm. E Quantification of Masson staining and the relative areas of Col in (D) (n = 6 in each group). F Adipogenic differentiation of BMSCs transfected with siALG5 or siCtrl was determined by ORO staining. G ORO staining was quantified by the absorbance at 520 nm (n = 6 in each group). H Protein levels of adipogenic markers in BMSCs transfected with siALG5 or siCtrl after adipogenic induction were determined by western blot analysis. Scatter plots showing the relative abundance of PPAR-γ, C/EBP-α, and FABP4 (n = 3 in each group). I Schematic diagram of the in vivo adipogenic differentiation experiment. J HE staining of fat vacuoles in the ALG5 knockdown group and the control group. Scale bar = 100 μm. K Quantification of the relative areas of fat vacuoles in (J) (n = 6 in each group). The statistical data are represented as the means ± SDs, *P < 0.05, **P < 0.01, ***P < 0.005, ****P < 0.001
Fig. 3
Fig. 3
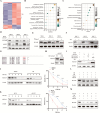
ALG5 modulates SLC6A9 expression via N-glycosylation in BMSCs. A Heatmap of proteomic data comparing BMSCs transfected with siALG5 and siCtrl; n = 2 for each group. B Gene Ontology (GO) analysis for differentially expressed proteins. C KEGG enrichment analysis for differentially expressed proteins. D Protein levels of SLC6A9 in BMSCs transfected with siALG5 or siCtrl were determined by western blot analysis. E Western blot analysis of BMSCs treated with or without TM (5 μg/mL) for 24 h. * Represents a glycosylated band and Filled triangle represents a deglycosylated band. F Western blot analysis of BMSC lysates treated with or without PNGase F. G The predicted N-glycosylation sites of SLC6A9 are shown. H After ALG5 was knocked down, SLC6A9-WT and SLC6A9-4NQ were reintroduced into BMSCs via a lentiviral system. I The indicated cell lines were treated with TM (5 μg/mL) for 24 h. J BMSCs were treated with 20 μM CHX at the indicated intervals in the presence or absence of TM (5 μg/mL). The intensity of the SLC6A9 protein band was quantified using ImageJ software. K BMSCs transfected with siALG5 and siCtrl were treated with 20 μM CHX at the indicated intervals. The intensity of the SLC6A9 protein band was quantified using ImageJ software. L BMSCs were treated with or without TM (5 μg/mL) and/or chloroquine (CQ) (10 mM), ammonium chloride (50 mM) or MG132 (10 μM) for 24 h. M ALG5 knockdown BMSCs were treated with CQ (10 mM), ammonium chloride (50 mM) or MG132 (10 μM) for 24 h
Fig. 4
Fig. 4
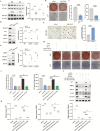
ALG5 downregulation induces an imbalance in BMSC differentiation by decreasing SLC6A9. A Protein level of SLC6A9 in BMSCs from HDs, OP patients, control mice, and mice with OP (n = 6 in each group) determined by western blotting. B Osteogenic differentiation of SLC6A9 knockdown and control BMSCs was determined by ARS and ALP staining. C The quantification of ARS staining was determined by the absorbance at 562 nm, and ALP activity was assessed in units per gram of protein per 15 min (n = 6 in each group). D The protein levels of osteogenic markers in SLC6A9 knockdown and control BMSCs after osteogenic induction were determined by western blot analysis. Scatter plots showing the relative abundances of SP7, BMP2 and Runx2 (n = 3 in each group). E Adipogenic differentiation of SLC6A9 knockdown and control BMSCs was determined by ORO staining. F Quantification of ORO staining was determined by the absorbance at 520 nm (n = 6 in each group). G Protein levels of adipogenic markers in SLC6A9 knockdown and control BMSCs after adipogenic induction were determined by western blot analysis. Scatter plots showing the relative abundance of PPAR-γ, C/EBP-α, and FABP4 (n = 3 in each group). H ARS and ALP staining of BMSCs transfected with the indicated constructs. I ARS staining was quantified by the absorbance at 562 nm, and ALP activity was assessed in units per gram of protein per 15 min (H) (n = 3 in each group). J The protein levels of osteogenic markers in BMSCs transfected with the indicated constructs after osteogenic induction were determined by western blotting. K Scatter plots showing the relative abundances of SP7, BMP2 and Runx2 (n = 3 in each group). The statistical data are represented as the means ± SDs, *P < 0.05, **P < 0.01, ***P < 0.005, ****P < 0.001, ns, no significant difference
Fig. 5
Fig. 5
ALG5 regulates BMSC differentiation via SLC6A9-mediated glycine uptake. A The concentrations of glycine in the medium supernatant of ALG5 knockdown and control BMSCs, SLC6A9 knockdown and control BMSCs were determined by ELISAs. B GSH levels and the ratio of NADH/NAD+ in ALG5 knockdown or SLC6A9 knockdown BMSCs. C The concentrations of glycine in the medium supernatant of BMSCs transfected with the indicated constructs. D GSH levels and the ratio of NADH/NAD+ in BMSCs transfected with the indicated constructs. E Targeted metabolomics assays of glycine in PB plasma derived from HDs (n = 7) and OP patients (n = 7). F Osteogenic differentiation of BMSCs treated with or without glycine-free medium was determined by ARS and ALP staining. G ARS staining was quantified by the absorbance at 562 nm, and ALP activity was assessed in units per gram of protein per 15 min (n = 6 in each group). H Protein levels of osteogenic in BMSCs treated with or without glycine-free medium. Scatter plots showing the relative abundance of the indicated markers (n = 3 in each group). I Adipogenic differentiation of BMSCs treated with or without glycine-free medium was determined by ORO staining. J Quantification of ORO staining was determined by the absorbance at 520 nm (n = 6 in each group). K Protein levels of adipogenic markers in BMSCs treated with or without glycine-free medium. Scatter plots showing the relative abundance of the indicated markers (n = 3 in each group). The statistical data are represented as the means ± SDs, *P < 0.05, **P < 0.01, ***P < 0.005, ****P < 0.001
Fig. 6
Fig. 6
Overexpressing ALG5 rescues bone loss in OVX mice. A Representative micro-CT images showing the trabecular bone of mice that underwent ovariectomy and were injected with rAAV9-vector, rAAV9-ALG5 WT or rAAV9-ALG5 mut. B Bone morphometric analysis, including the analysis of BV/TV, Tb.Th, Tb.N, and Tb.Sp, was performed in the OVX mouse group treated with rAAV9-vector, rAAV9-ALG5 WT or rAAV9-ALG5 mut. C Histological analysis of bone loss and lipid accumulation in the femur was performed using HE staining. Scale bar = 500 μm (upper) or 250 μm (lower). D Accumulation of lipid droplets in the bone marrow was quantified by counting the number of droplets per mm2. E Histological analysis of bone loss detected by Masson staining. Scale bar = 500 μm. F The concentrations of glycine in mouse serum were detected by ELISAs. G Micro-CT analysis showing the femoral defects of the mice treated with rAAV9-vector, rAAV9-ALG5 WT or rAAV9-ALG5 mut. The statistical data are presented as the means ± SDs; n = 5 in each group; *P < 0.05, **P < 0.01, ***P < 0.005, ****P < 0.001
Fig. 7
Fig. 7
The proposed model shows ALG5 downregulation triggers an imbalance in BMSC differentiation by decreasing SLC6A9 and glycine uptake in osteoporosis

Similar articles

References

    1. (2001) Osteoporosis prevention, diagnosis, and therapy. Jama 285(6): 785–95 - PubMed
    1. Compston JE, McClung MR, Leslie WD (2019) Osteoporosis. Lancet 393(10169):364–376 - PubMed
    1. Sfeir JG et al (2022) Skeletal aging. Mayo Clin Proc 97(6):1194–1208 - PMC - PubMed
    1. Kawai M, de Paula FJ, Rosen CJ (2012) New insights into osteoporosis: the bone-fat connection. J Intern Med 272(4):317–329 - PMC - PubMed
    1. Li H et al (2017) FOXP1 controls mesenchymal stem cell commitment and senescence during skeletal aging. J Clin Invest 127(4):1241–1253 - PMC - PubMed

LinkOut - more resources