. 2025 Jan 6;16(1):11.
doi: 10.1007/s12672-025-01759-1.

Single-cell RNA-sequencing and genome-wide Mendelian randomisation along with abundant machine learning methods identify a novel B cells signature in gastric cancer

Affiliations

Single-cell RNA-sequencing and genome-wide Mendelian randomisation along with abundant machine learning methods identify a novel B cells signature in gastric cancer

Qi Ma et al. Discov Oncol. .

Abstract

Background: Gastric cancer (GC) has a poor prognosis, considerable cellular heterogeneity, and ranks fifth among malignant tumours. Understanding the tumour microenvironment (TME) and intra-tumor heterogeneity (ITH) may lead to the development of novel GC treatments.

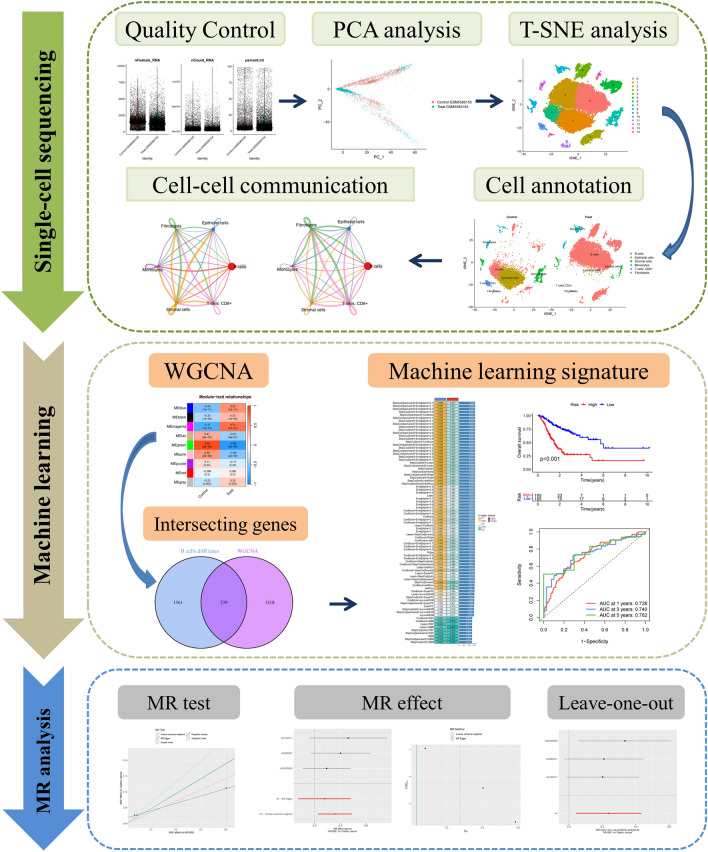
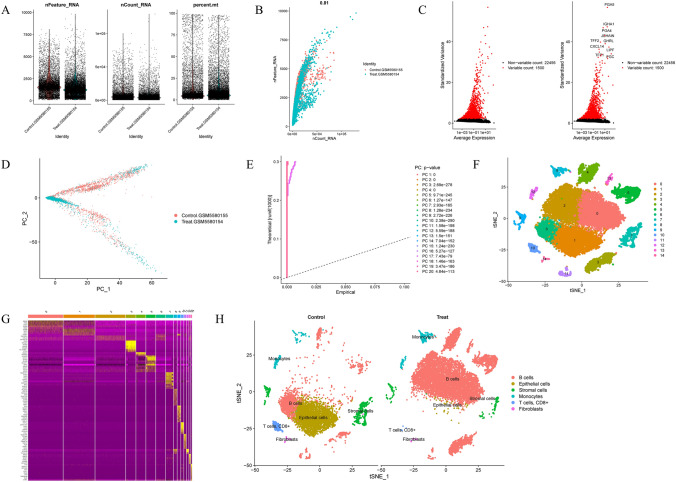
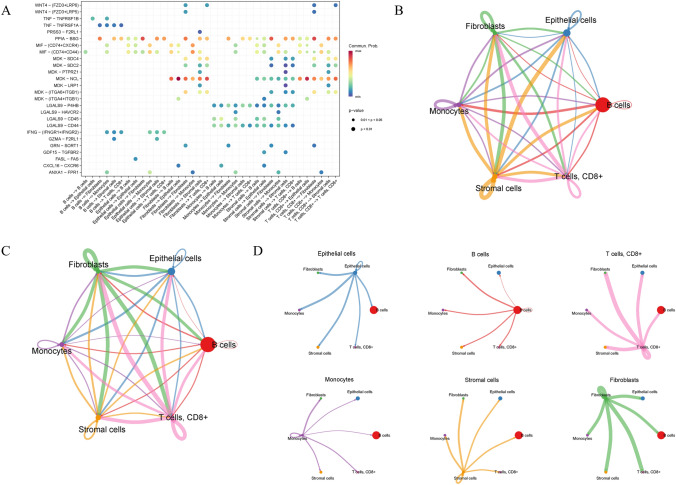
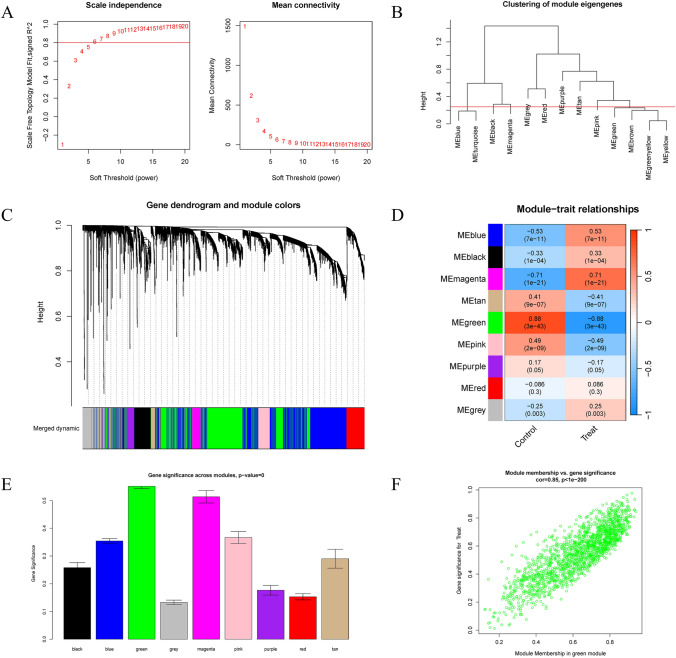
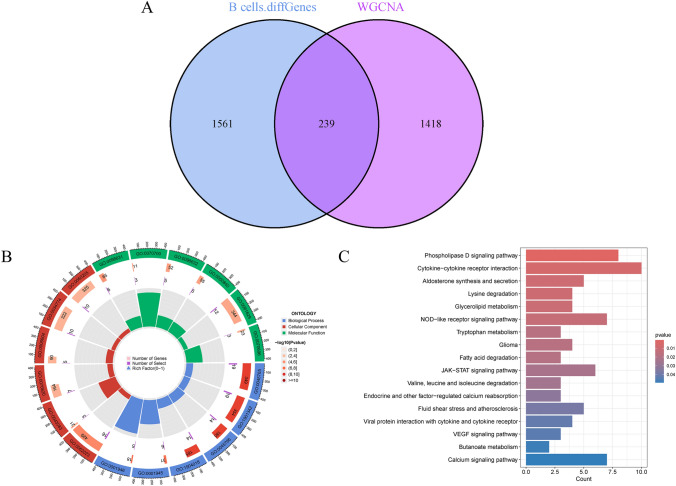
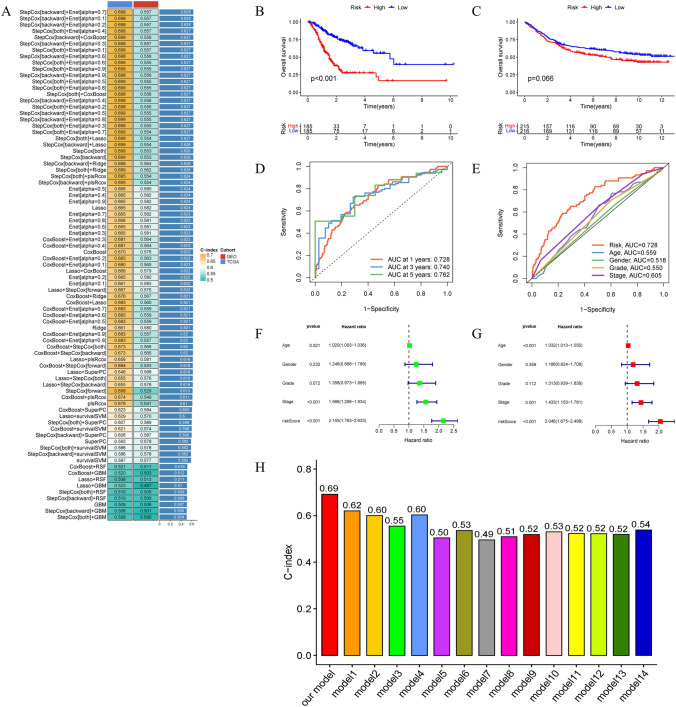
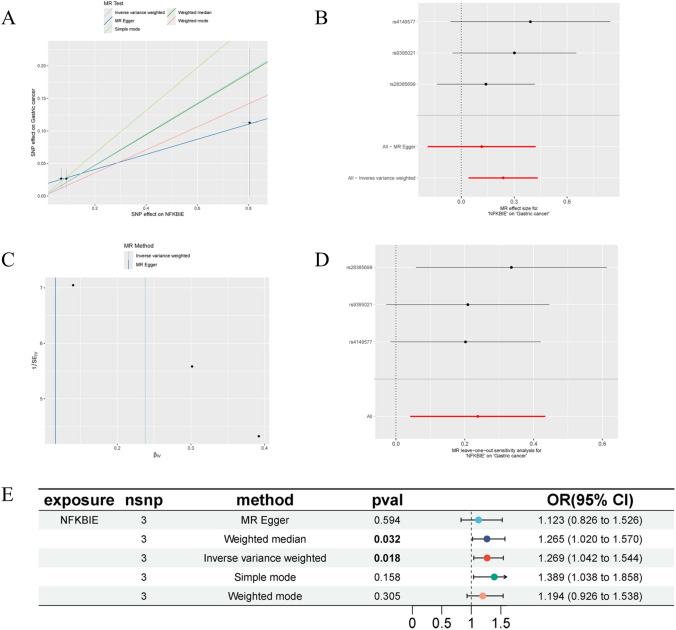
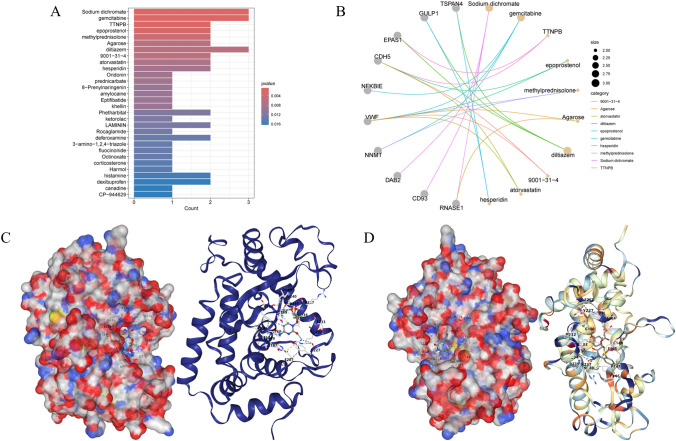
Methods: The single-cell RNA sequencing (scRNA-seq) dataset was obtained from the Gene Expression Omnibus (GEO) database, where diverse immune cells were isolated and re-annotated based on cell markers established in the original study to ascertain their individual characteristics. We conducted a weighted gene co-expression network analysis (WGCNA) to identify genes with a significant correlation to GC. Utilising bulk RNA sequencing data, we employed machine learning integration methods to train specific biomarkers for the development of novel diagnostic combinations. A two-sample Mendelian randomisation study was performed to investigate the causal effect of biomarkers on gastric cancer (GC). Ultimately, we utilised the DSigDB database to acquire associations between signature genes and pharmaceuticals.

Results: The 18 genes that made up the signature were as follows: ZFAND2A, PBX4, RAMP2, NNMT, RNASE1, CD93, CDH5, NFKBIE, VWF, DAB2, FAAH2, VAT1, MRAS, TSPAN4, EPAS1, AFAP1L1, DNM3. Patients were categorised into high-risk and low-risk groups according to their risk scores. Individuals in the high-risk cohort exhibited a dismal outlook. The Mendelian randomisation study demonstrated that individuals with a genetic predisposition for elevated NFKBIE levels exhibited a heightened likelihood of acquiring GC. Molecular docking indicates that gemcitabine and chloropyramine may serve as effective therapeutics against NFKBIE.

Conclusions: We developed and validated a signature utilising scRNA-seq and bulk sequencing data from gastric cancer patients. NFKBIE may function as a novel biomarker and therapeutic target for GC.

Keywords: Bioinformatics; Diagnostic biomarker; Gastric cancer; Machine learning; Single-cell RNA sequencing.


Conflict of interest statement

Declarations. Ethics approval and consent to participate: The authors are accountable for all aspects of the work in ensuring that questions related to the accuracy or integrity of any part of the work are appropriately investigated and resolved. Competing interests: The authors declare no competing interests.

Figures

Fig. 1
Fig. 1
Flow chart of this study
Fig. 2
Fig. 2
Characterisation of the scRNA-seq data. A Quality control study of the scRNA-seq data from gastric cancer cell samples and adjacent non-cancerous tissue samples. B Relationship between the quantity of expressed genes and sequencing depth. C Variogram illustrating 1500 genes with significant expression variability. D Initial categorisation of cells by PCA and determination of significantly applicable dimensions. E Twenty PCs were found with a P-value of less than 0.05. F Identification of fourteen clusters utilising the t-SNE technique. G Heatmap illustrating the ten most significantly cluster-discriminative genes for each cellular cluster. H Annotated phenotypes of each cellular cluster
Fig. 3
Fig. 3
Cell–cell communication analysis. A The bubble chart illustrates overexpressed ligand-receptor interactions. The size of the bubble indicates the P value derived from the permutation test, while the colour signifies the likelihood of interactions. B The frequency of interactions among immune cells. C The intensity of interaction among immunological cells. D Diagram of single-cell communication patterns
Fig. 4
Fig. 4
Co-expression network in GC. A The choosing of power with a flexible threshold. B Representation of clustered module genes. C Gene dendrogram and module hues. D Examination of the relationship between module genes and clinical condition. E Importance of genes across modules. F Scatter plot illustrating the correlation between module membership in the green module and the genetic significance of GC
Fig. 5
Fig. 5
Intersecting genes acquisition and GO and KEGG enrichment analysis. A Identification of overlapping genes between WCGNA module genes and B cell-associated differentially expressed genes. B GO enrichment analysis. C KEGG enrichment analysis
Fig. 6
Fig. 6
Building models using machine learning. A A total of 101 prediction model types were developed utilising the LOOCV framework, and the C-index for each model was then computed for both training and validation datasets. B Kaplan–Meier graphs of overall survival between the two risk groups in the training dataset. C Kaplan–Meier graphs of overall survival between the two risk groups in the testing dataset. D ROC curves illustrate the 1-, 3-, and 5-year overall survival in the TCGA-STAD. E ROC curves show the 1-, 3- and 5- year clinical traits in the TCGA-STAD. F Univariate Cox regression analysis. G Multivariate Cox regression analysis. H C-index of 15 models
Fig. 7
Fig. 7
Two-sample Mendel Randomisation analysis. A A scatterplot illustrates the inverse relationship between the SNP effect on NFKBIE and GC. B Forest plot illustrating the causal impact of each SNP on the risk of GC. C Funnel plots to illustrate the overall variety of MR estimates about the impact of NFKBIE on GC. D Leave-one-out plot to illustrate the causal influence of NFKBIE on GC risk by excluding one SNP at a time. E Mendelian randomisation estimations about the connections between NFKBIE and GC
Fig. 8
Fig. 8
Potential therapeutic drugs prediction and molecular docking. A A barplot of drug enrichment analysis. B A network illustrates the connections between genes and pharmaceuticals. C Illustration of the molecular docking configuration of NFKBIE with gemcitabine. D Illustration of the molecular docking configuration of diltiazem with chloropyramine

Similar articles

References

    1. Smyth EC, et al. Gastric cancer. Lancet. 2020;396(10251):635–48. - PubMed
    1. Machlowska J, et al. Gastric cancer: epidemiology, risk factors, classification, genomic characteristics and treatment strategies. Int J Mol Sci. 2020;21(11):4012. - PMC - PubMed
    1. Li Y, et al. Recent estimates and predictions of 5-year survival in patients with gastric cancer: a model-based period analysis. Cancer Control. 2022;29:10732748221099228. - PMC - PubMed
    1. Balachandran VP, et al. Nomograms in oncology: more than meets the eye. Lancet Oncol. 2015;16(4):e173–80. - PMC - PubMed
    1. Karobari MI, et al. Evaluation of the diagnostic and prognostic accuracy of artificial intelligence in endodontic dentistry: a comprehensive review of literature. Comput Math Methods Med. 2023;2023:7049360. - PMC - PubMed

LinkOut - more resources