. 2025 Jan 6:13:RP96317.
doi: 10.7554/eLife.96317.

Aminoglycoside tolerance in Vibrio cholerae engages translational reprogramming associated with queuosine tRNA modification

Affiliations

Aminoglycoside tolerance in Vibrio cholerae engages translational reprogramming associated with queuosine tRNA modification

Louna Fruchard et al. Elife. .

Abstract

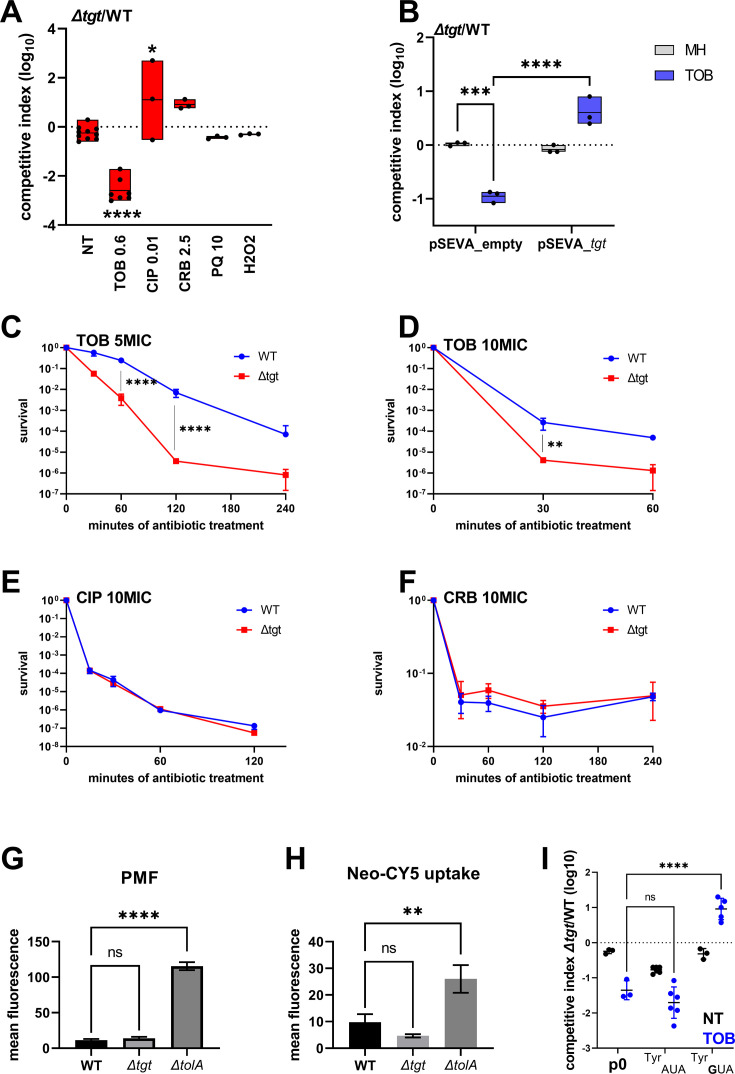
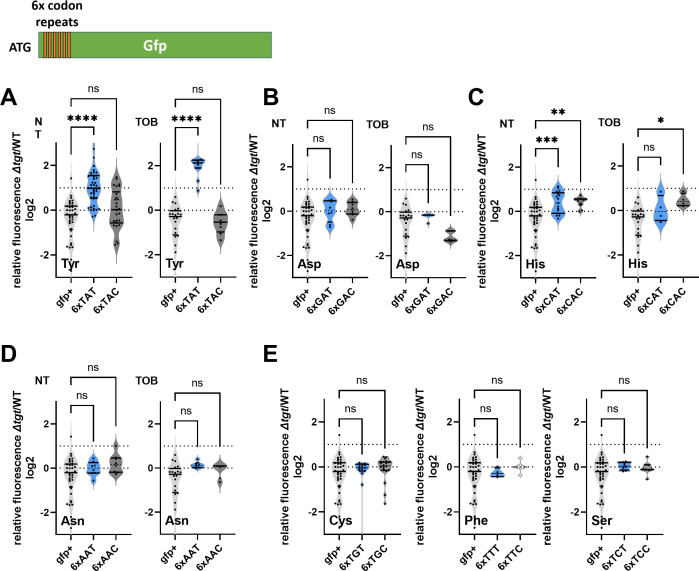
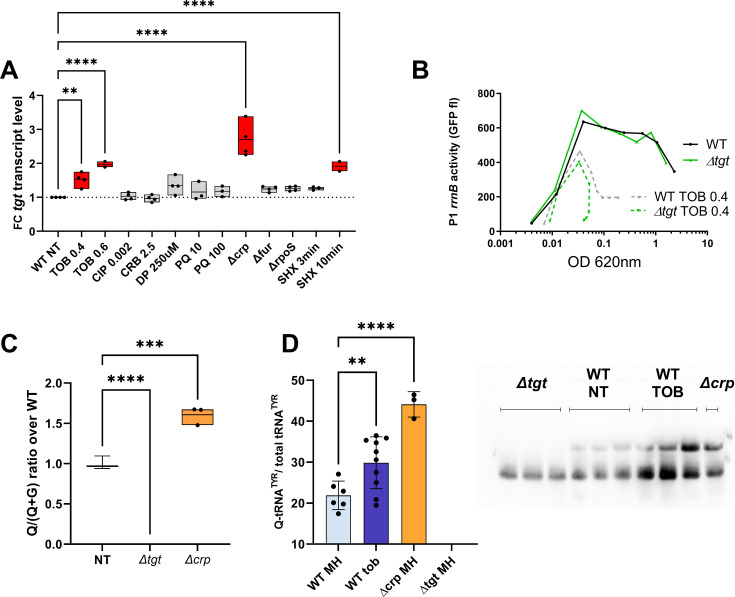
Tgt is the enzyme modifying the guanine (G) in tRNAs with GUN anticodon to queuosine (Q). tgt is required for optimal growth of Vibrio cholerae in the presence of sub-lethal aminoglycoside concentrations. We further explored here the role of the Q34 in the efficiency of codon decoding upon tobramycin exposure. We characterized its impact on the overall bacterial proteome, and elucidated the molecular mechanisms underlying the effects of Q34 modification in antibiotic translational stress response. Using molecular reporters, we showed that Q34 impacts the efficiency of decoding at tyrosine TAT and TAC codons. Proteomics analyses revealed that the anti-SoxR factor RsxA is better translated in the absence of tgt. RsxA displays a codon bias toward tyrosine TAT and overabundance of RsxA leads to decreased expression of genes belonging to SoxR oxidative stress regulon. We also identified conditions that regulate tgt expression. We propose that regulation of Q34 modification in response to environmental cues leads to translational reprogramming of transcripts bearing a biased tyrosine codon usage. In silico analysis further identified candidate genes which could be subject to such translational regulation, among which DNA repair factors. Such transcripts, fitting the definition of modification tunable transcripts, are central in the bacterial response to antibiotics.

Keywords: Vibrio cholerae; antibiotic stress; epitranscriptome; genetics; genomics; infectious disease; microbiology; post-transcriptional regulation; queuosine; tRNA modification.


Conflict of interest statement

LF, AB, AC, ML, BL, MD, QG, MM, FB, IH, HA, CF, EC, GS, VM, YM, ON, Vd, DM, ZB No competing interests declared

Figures

Figure 1.
Figure 1.. V. cholerae ∆tgt shows decreased aminoglycoside tolerance.
(A) Competition experiments between wild-type (WT) and ∆tgt with the indicated antibiotic or oxidant at sub-MIC concentration. NT: non-treated; TOB: tobramycin 0.6 µg/mL; CIP: ciprofloxacin 0.01 µg/mL; CRB: carbenicillin 2.5 µg/mL; PQ: paraquat 10 µM; H2O2: 2 mM. (B) Competition experiments between WT and ∆tgt carrying the indicated plasmids. pSEVA-tgt: plasmid expressing tgt using the XylS regulated Pm promoter, which is activated using sodium benzoate. MH: non-treated. (C–F) Survival of exponential phase cultures after various times of incubation (indicated in minutes on the X-axis) with the indicated antibiotic at lethal concentration: 5MIC: 5 times the MIC; 10MIC: 10 times the MIC. (G) Proton-motive force (PMF) measurement of exponential phase cultures using fluorescent MitoTracker dye, measured using flow cytometry. (H) Neomycin uptake measurement by flow cytometry using fluorescent Cy5 coupled neomycin. (I) Competition experiments between WT and ∆tgt carrying either empty plasmid (p0), or a plasmid overexpressing tRNATyr with the native GUA anticodon, or with the synthetic AUA anticodon. The anticodon sequence is indicated (e.g. tRNATyrAUA decodes the UAU codon). NT: non-treated; TOB: tobramycin 0.6 µg/mL. For multiple comparisons, we used one-way ANOVA. **** means p<0.0001, *** means p<0.001, ** means p<0.01, * means p<0.05. ns: non-significant. Number of replicates for each experiment: 3 < n < 8.
Figure 1—figure supplement 1.
Figure 1—figure supplement 1.. Impact of tRNA overexpression on fitness during growth in sub-MIC tobramycin (TOB).
(A) Absence of tgt does not visibly affect endogenous tRNA-GUN levels. qRT-PCR. A: relative tRNA abundance in ∆tgt compared to wild-type (WT) strain in the absence of treatment (NT) and in the presence of sub-MIC TOB. (B) In vitro competition experiments between V. cholerae WT and ∆tgt strains, carrying a plasmid overexpressing the indicated tRNA; in the absence (NT) or presence of sub-MIC tobramycin (50% of the MIC, TOB 0.6 μg/mL). NT: no antibiotic treatment. The Y-axis represents log10 of competitive index calculated as described in the Materials and methods. A competitive index of 1 indicates equal growth of both strains. The X-axis indicates which tRNA is overexpressed, from the high copy pTOPO plasmid. The anticodon sequence is indicated (e.g. tRNATyrAUA decodes the TAT codon). The following tRNAs-GUN are the canonical tRNAs which are present in the genome, and modified by Tgt: TyrGUA, HisGUG, AsnGUU, AspGUC. The following tRNAs-AUN are synthetic tRNAs which are not present in the genome: TyrAUA, HisAUG, AsnAUU, AspAUC. tRNAPheGAA is used as non-Tgt-modified control. p0 is the empty plasmid. (C) Codon-specific translation efficiency in WT and ∆tgt using 6xcodon stretches inserted in GFP. Left: Y-axis represents the relative fluorescence of the indicated gfp variant in WT and ∆tgt strains carrying indicated tRNA overexpression plasmid normalized to fluorescence with empty plasmid (no tRNA overexpression). Right: ratio of ∆tgt over WT. Y-axis represents the relative fluorescence of a given GFP in ∆tgt over the same construct in WT. Each specified codon is repeated 6× within the coding sequence of the GFP (e.g. TACTACTACTACTACTAC). P0: both WT ∆tgt carry empty plasmid. ptRNATyrGUA: overexpressing tRNATyr with GUA anticodon. ptRNATyrAUA: overexpressing tRNA-Tyr with AUA anticodon. For multiple comparisons, we used one-way ANOVA on GraphPad Prism. **** means p<0.0001, ** means p<0.01, * means p<0.05. Number of replicates for each experiment: 3 < n < 8. In A, only significant differences are indicated. ns means non-significant.
Figure 2.
Figure 2.. Codon decoding differences for V. cholerae wild-type (WT) and ∆tgt.
(A–E) Codon-specific translation efficiency in WT and ∆tgt using 6xcodon stretches inserted in GFP. Y-axis represents the relative fluorescence of a given GFP in ∆tgt over the same construct in WT. NT: non-treated; TOB: tobramycin at 0.4 µg/mL. Each specified codon is repeated 6× within the coding sequence of the GFP (e.g. TACTACTACTACTACTAC). For multiple comparisons, we used one-way ANOVA. **** means p<0.0001, *** means p<0.001, ** means p<0.01, * means p<0.05. ns: non-significant. Number of replicates for each experiment: 3<n, each dot represents one replicate gfp+ is the native gfp (gfpmut3) without any stretch.
Figure 3.
Figure 3.. Differential translation at tyrosine and aspartate codons evaluated by growth on carbenicillin of mutated β-lactamase reporters.
(A) The catalytic tyrosine at position 103 was tested in its native sequence (TAC), or with the synonymous TAT mutation. (B) The catalytic aspartate at position 129 was tested in its native sequence (GAT), or with the synonymous GAC mutation. (A and B). Growth on microtiter plates. Growth was followed by measuring the OD 620 nm every 15 min during 600 min. CARB was used at 100 µg/mL. When present, TOB was used at 0.2 µg/mL (20% of MIC). Curves represent mean and standard errors from biological duplicates. (C) Rationale. (D) Cells were grown to early exponential phase without carbenicillin, and with (down) or without (top) tobramycin 20% of MIC, and treated with carbenicillin at 10× MIC for 20 hr. Dilutions were spotted on plate without carbenicillin. Surviving cells shown here are sensitive to carbenicillin (no growth on carbenicillin containing plates), suggesting that increased or decreased survival was due to increased (erroneous translation) or decreased (faithful translation) β-lactamase activity at the time of treatment. Number of replicates for each experiment: 3. One representative experiment is shown.
Figure 3—figure supplement 1.
Figure 3—figure supplement 1.. Q modification impacts decoding fidelity in V. cholerae.
Stop codon readthrough levels show increased mistranslation at TAA and TAG for ∆tgt. Blue: wild-type (WT). Red: ∆tgt. NT: no treatment. TOB: growth in the presence of tobramycin at 20% of the MIC. Reporters described in Fabret and Namy, 2021, #1572. Y-axis represents stop codon readthrough*1000. The other graphs show mean fluorescence of gfp reporters where the tyrosine codon at position 66 was replaced with indicated non-cognate or near-cognate codons. Fluorescence was measured on overnight cultures grown either in MH medium without treatment (NT: non-treated) or with sub-MIC TOB (0.2 µg/mL). In black: fluorescence in the WT strain. Red: fluorescence in the ∆tgt strain. Number of biological replicates: between 3 and 8. For comparisons between two groups (WT vs ∆tgt), first an F-test was performed in order to determine whether variances are equal or different between comparisons. For comparisons with equal variance, Student’s t-test was used. For comparisons with significantly different variances, we used Welch’s t-test (*: p<0.05, **: p<0.01, ****: p<0.0001).
Figure 4.
Figure 4.. Post-transcriptional regulation in ∆tgt and Tyr codon usage bias.
(A and B) Volcano plots showing less and more abundant proteins in proteomics analysis (performed in triplicates) in ∆tgt compared to wild-type (WT) during growth without antibiotics (A, where MH is the growth medium), or in sub-MIC TOB at 0.4 µg/mL (B). (C) Codon usage bias calculation example with VC1017 rsxA tyrosine TAC and TAT codons. (D–G) Plots showing codon usage bias for genes lists that are up or down in ribosome profiling analysis (performed in triplicates), normalized to RNA-seq values for each gene, for codons decoded by tRNAs with Q modification. Each dot represents one gene of the lists TE stands for translation efficiency, i.e. Riboseq data normalized to total transcriptome.
Figure 5.
Figure 5.. Post-transcriptional upregulation of RsxA in ∆tgt due to a Tyr codon bias toward TAT and toxicity in sub-MIC TOB.
(A) rsxA mRNA levels measured by digital RT-PCR. 4 biological replicates. (B) Transcriptional expression levels from the rsxA promoter measured by flow cytometry. 6 biological replicates. (C) Translational fusion of rsxA to gfp and gfp alone, with differences in codon usage. 3 biological replicates. One-way ANOVA was used to determine the statistical differences (p-value) between groups. *** means p<0.001, ** means p<0.01, ns: non-significant. (D) Growth curves in microtiter plate reader, in V. cholerae in indicated conditions. P-tgt+: pSEVA expressing tgt. P-rsx+: pSEVA expressing rsxA. P-control: empty pSEVA. Inducer: DAPG (see Materials and methods). 2 biological replicates and standard errors are shown for each curve.
Figure 5—figure supplement 1.
Figure 5—figure supplement 1.. Post-transcriptional upregulation of RsxA in ∆tgt due to a Tyr codon bias toward TAT and toxicity in sub-MIC TOB.
(A–C) Translational fusion of TAC and TAT versions of rsxA to gfp (A: 4 hr exponential phase cultures, B: overnight stationary phase cultures). (D–F) TAC and TAT versions of gfp alone (C: 4 hr exponential phase cultures without antibiotics, D: in the presence of sub-MIC TOB), measured by flow cytometry. Y-axis represents mean fluorescence. (C and F) show representative examples of fluorescence observed with indicated reporters. (G) Relative fluorescence of Δtgt compared to WT, various sequences displayed by rsxA inserted in gfp after its ATG codon, measured by flow cytometry. We used either the native TAT or the TAC replacement while keeping the remaining sequence unchanged. For multiple comparisons, we used one-way ANOVA. **** means p<0.0001, *** means p<0.001, ** means p<0.01, * means p<0.05. ns: non-significant. Number of replicates for each experiment: 3<n, each dot represents one replicate.
Figure 5—figure supplement 2.
Figure 5—figure supplement 2.. rsxA levels impact growth in the presence of sub-MIC TOB in E. coli.
Figure 6.
Figure 6.. Regulation of tgt expression and tRNA Q levels.
(A) tgt transcript levels measured by digital-RT-PCR. Y-axis represents relative abundance compared to the non-treated (NT) condition in wild-type (WT). (B) Stringent response induction measured with P1rrn-gfp reporter shown as fluorescence (Y-axis) as a function of growth (X-axis: OD 600 nm). (C) Q levels in tRNA-enriched RNA extracts, measured by mass spectrometry. (D) Northern blot and quantification of Q levels in tRNATyr. The lower band in the gel corresponds to unmodified tRNATyr. The upper band corresponds to Q-modified tRNA-Tyr. ∆tgt is the negative control without modification of tRNATyr. A representative gel is shown. Histograms show the quantification of Q-modified tRNATyr over total tRNATyr, as follows: Q-modified tRNATyr/(Q-modified tRNATyr+tRNATyr without Q)=upper band/(upper band+lower band). 2.5 µg in tRNA-enriched RNA extracts were deposited in lanes WT NT, WT TOB, and ∆crp. 0.9 µg was deposited in lanes ∆tgt. Number of replicates for each experiment: 3. For multiple comparisons, we used one-way ANOVA (for A, C, E). **** means p<0.0001, *** means p<0.001, ** means p<0.01. Only significant differences are shown.
Figure 6—figure supplement 1.
Figure 6—figure supplement 1.. Q detection and quantification by IO4- oxidation coupled to deep sequencing.
The Y-axis represents deletion score, which correlates with the Q34 level in tRNA. Results for tRNAs His, AsnGUU2, and Asp are shown. Analysis was performed for three biological replicates (shown as colored dots) and at least two technical replicates for each strain (only mean of technical replicates is shown). p-Values are calculated by two-tailed t-test, error bars correspond to standard error of the mean.
Figure 7.
Figure 7.. DNA repair after UV irradiation is more efficient in V. cholerae ∆tgt.
(A and C) Tyrosine codon usage of DNA repair genes A: in V. cholerae. C: in E. coli. Red indicates positive codon usage bias, i.e., TAT bias. Blue indicates negative codon usage bias for TAT, i.e., TAC bias. (B and D) Survival of ∆tgt relative to wild-type (WT) after UV irradiation (linear scale) B: in V. cholerae. (D) in E. coli. For multiple comparisons, we used one-way ANOVA. **** means p<0.0001, ns: non-significant.
Figure 7—figure supplement 1.
Figure 7—figure supplement 1.. Codon usage.
(A and B) Tyrosine codon usage in A: V. cholerae and B: E. coli in the whole genome and selected groups of genes. Red indicates positive codon usage bias, i.e., TAT bias. Blue indicates negative codon usage bias for TAT, i.e., TAC bias. (C–E) Gene ontology enrichment analysis in V. cholerae of (C) overrepresented gene categories with TAT usage bias. (D) Underrepresented gene categories with TAT usage bias. (E) Overrepresented gene categories with TAC usage bias.
Figure 8.
Figure 8.. Model.
Upon exposure to sub-MIC aminoglycosides, the expression of tgt is upregulated in V. cholerae and influences the decoding of tyrosine TAC vs TAT codons. This leads to differential translation from transcripts bearing a codon usage bias for tyrosine codons. The rsxA transcript bears a tyrosine codon bias and its translation can be tuned by tRNA Q modification. RsxA is an anti-SoxR factor. SoxR controls a regulon involved in oxidative stress response. When RsxA levels are high, SoxR is increasingly inactivated and oxidative stress response efficiency decreases. It has been previously shown that sub-MIC aminoglycosides trigger oxidative stress in V. cholerae (Baharoglu et al., 2013). Increasing RsxA levels thus reduce fitness in TOB by hampering efficient oxidative stress response. As a corollary, decreased RsxA would lead to increased expression of the SoxR regulon, which would allow for more efficient response to oxidative stress, and increased fitness in the presence of sub-MIC TOB. We propose that when Tgt/Q levels in tRNA increase, RsxA synthesis is low and active SoxR levels are high, facilitating the bacterial response to aminoglycoside-dependent oxidative stress. Created with BioRender.com.
Author response image 1.
Author response image 2.
Author response image 3.
Author response image 4.

Update of

  • doi: 10.1101/2022.09.26.509455
  • doi: 10.7554/eLife.96317.1
  • doi: 10.7554/eLife.96317.2

Similar articles

Cited by

References

    1. Advani VM, Ivanov P. Translational control under stress: reshaping the translatome. BioEssays. 2019;41:e1900009. doi: 10.1002/bies.201900009. - DOI - PMC - PubMed
    1. Andersen JB, Sternberg C, Poulsen LK, Bjorn SP, Givskov M, Molin S. New unstable variants of green fluorescent protein for studies of transient gene expression in bacteria. Applied and Environmental Microbiology. 1998;64:2240–2246. doi: 10.1128/AEM.64.6.2240-2246.1998. - DOI - PMC - PubMed
    1. Aubee JI, Olu M, Thompson KM. The i6A37 tRNA modification is essential for proper decoding of UUX-Leucine codons during rpoS and iraP translation. RNA. 2016;22:729–742. doi: 10.1261/rna.053165.115. - DOI - PMC - PubMed
    1. Babosan A, Fruchard L, Krin E, Carvalho A, Mazel D, Baharoglu Z. Nonessential tRNA and rRNA modifications impact the bacterial response to sub-MIC antibiotic stress. microLife. 2022;3:uqac019. doi: 10.1093/femsml/uqac019. - DOI - PMC - PubMed
    1. Baharoglu Z, Bikard D, Mazel D. Conjugative DNA transfer induces the bacterial SOS response and promotes antibiotic resistance development through integron activation. PLOS Genetics. 2010;6:e1001165. doi: 10.1371/journal.pgen.1001165. - DOI - PMC - PubMed

MeSH terms

Associated data