. 2025 Jan 6;23(1):e3002950.
doi: 10.1371/journal.pbio.3002950. eCollection 2025 Jan.

PRDM9 drives the location and rapid evolution of recombination hotspots in salmonid fish

Affiliations

PRDM9 drives the location and rapid evolution of recombination hotspots in salmonid fish

Marie Raynaud et al. PLoS Biol. .

Abstract

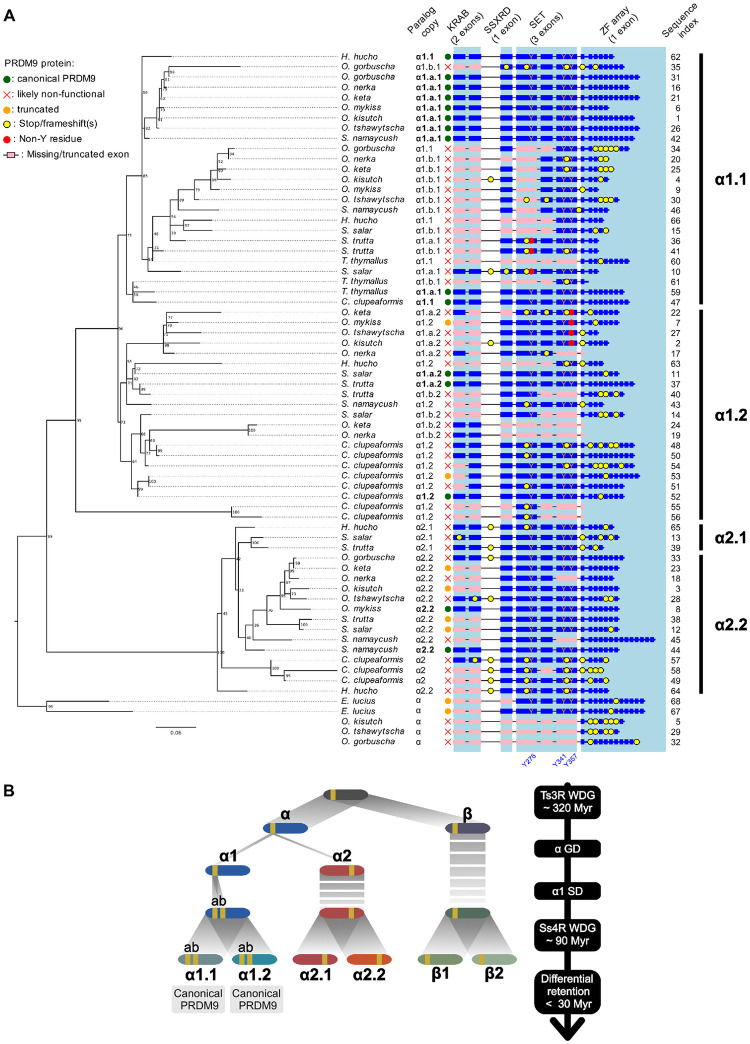
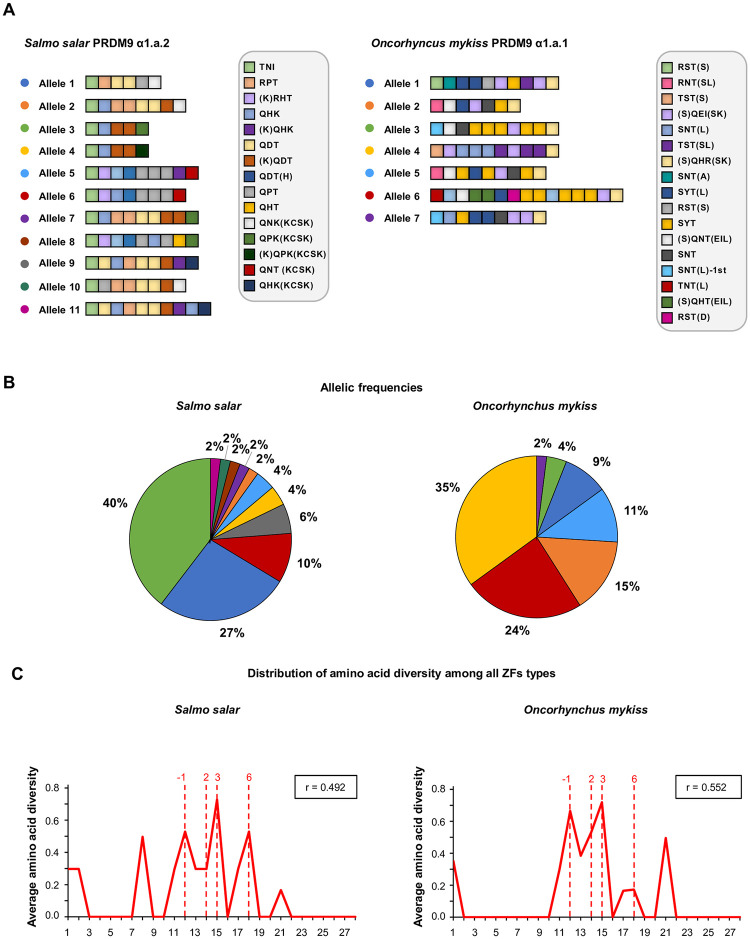
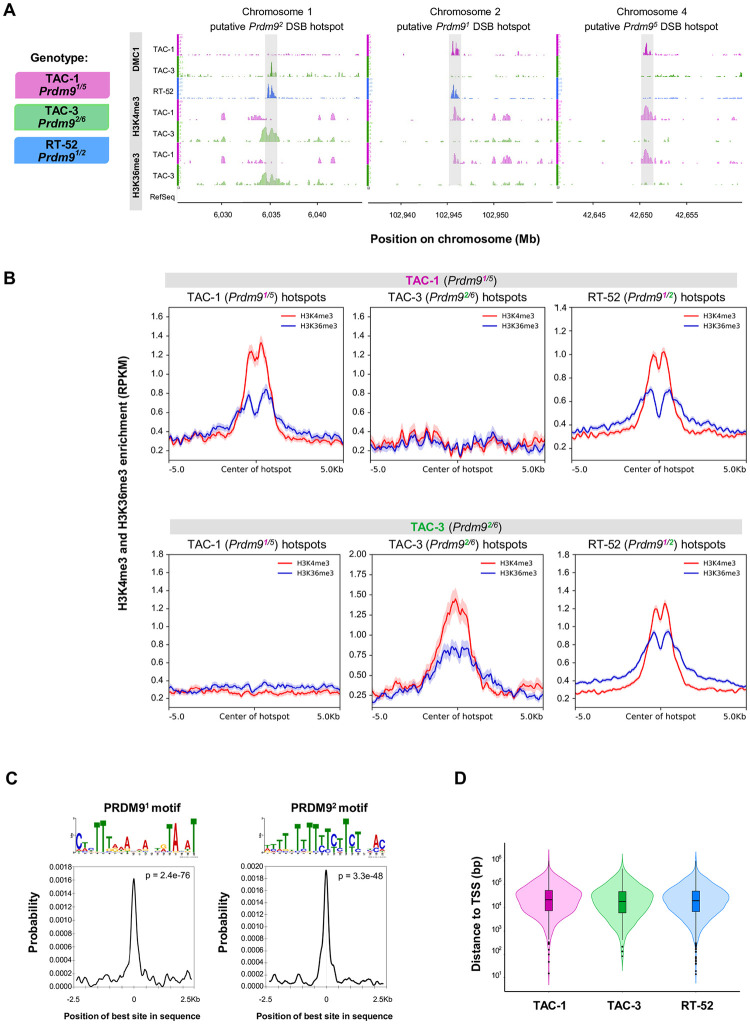
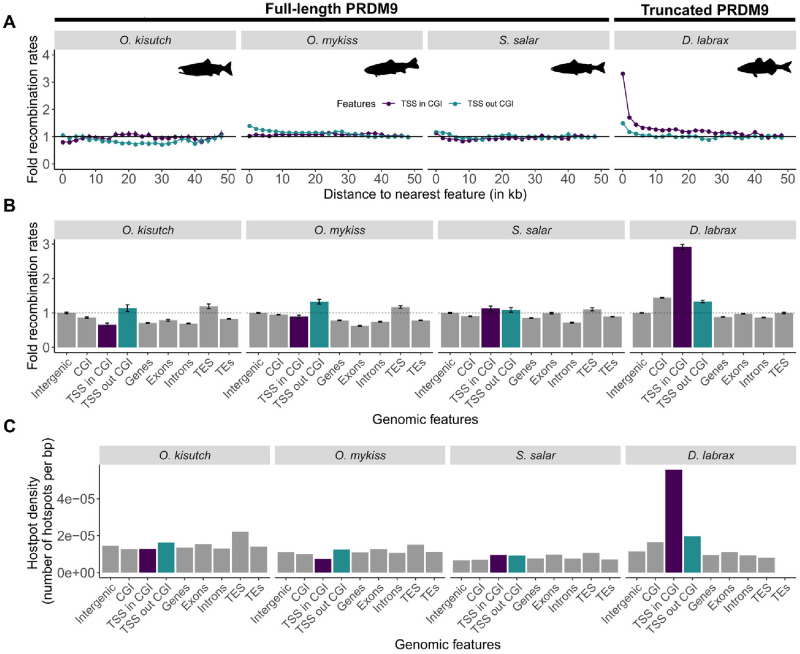
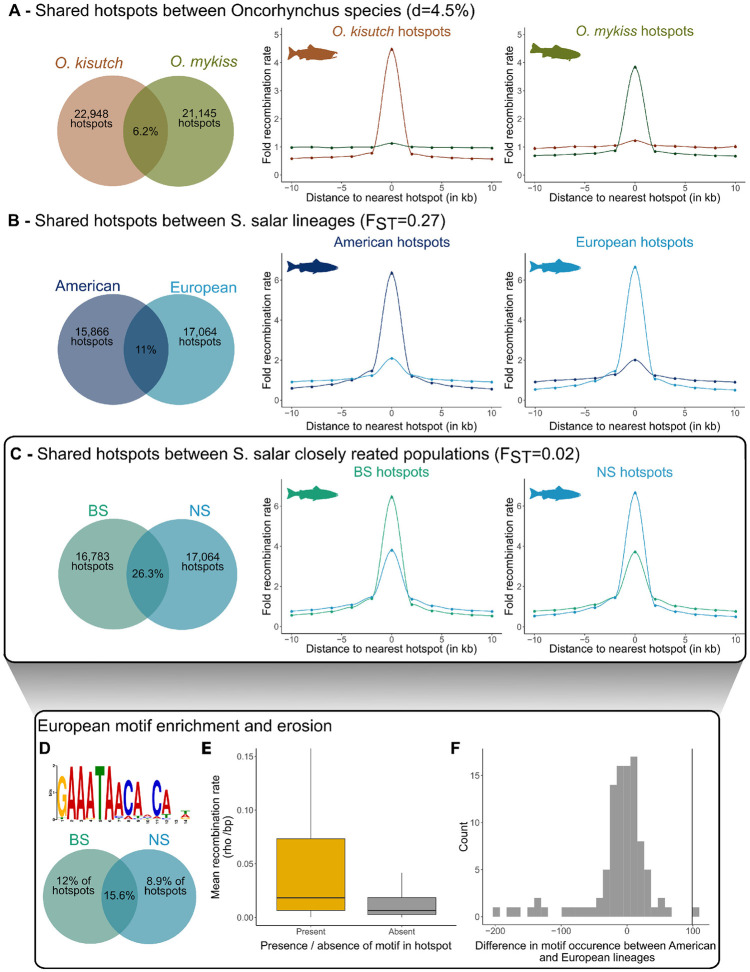
In many eukaryotes, meiotic recombination occurs preferentially at discrete sites, called recombination hotspots. In various lineages, recombination hotspots are located in regions with promoter-like features and are evolutionarily stable. Conversely, in some mammals, hotspots are driven by PRDM9 that targets recombination away from promoters. Paradoxically, PRDM9 induces the self-destruction of its targets and this triggers an ultra-fast evolution of mammalian hotspots. PRDM9 is ancestral to all animals, suggesting a critical importance for the meiotic program, but has been lost in many lineages with surprisingly little effect on meiosis success. However, it is unclear whether the function of PRDM9 described in mammals is shared by other species. To investigate this, we analyzed the recombination landscape of several salmonids, the genome of which harbors one full-length PRDM9 and several truncated paralogs. We identified recombination initiation sites in Oncorhynchus mykiss by mapping meiotic DNA double-strand breaks (DSBs). We found that DSBs clustered at hotspots positioned away from promoters, enriched for the H3K4me3 and H3K36me3 and the location of which depended on the genotype of full-length Prdm9. We observed a high level of polymorphism in the zinc finger domain of full-length Prdm9, indicating diversification driven by positive selection. Moreover, population-scaled recombination maps in O. mykiss, Oncorhynchus kisutch and Salmo salar revealed a rapid turnover of recombination hotspots caused by PRDM9 target motif erosion. Our results imply that PRDM9 function is conserved across vertebrates and that the peculiar evolutionary runaway caused by PRDM9 has been active for several hundred million years.


Conflict of interest statement

The authors have declared that no competing interests exist.

Figures

Fig 1
Fig 1. Prdm9 duplication history in salmonids.
(A) Phylogenetic tree of Prdm9α paralogs in 12 salmonids and northern pike (Esox lucius) as outgroup species. Prdm9β is shown in S1 Fig. The phylogenetic tree was computed on the concatenated 6 exons of the 3 canonical PRDM9 domains KRAB, SSXRD, and SET, with 1,000 bootstrap replicates (values shown). The columns, from left to right, indicate the (i) species name; (ii) annotated paralog copy (in bold: full-length copy without pseudogenization); (iii) Prdm9 copy status. Prdm9α clusters into 2 main groups (α1 and α2) that are divided in 2 subgroups (α1.1/α1.2 and α2.1/α2.2). The scale bar is in unit of substitution per site. The right panel shows the coding potential of each paralog, and indicates the presence of frame-shifting mutations or stop codons, and of substitutions in the catalytic tyrosines of the SET domain (Y276, Y341, and Y357). Canonical (full length) Prdm9 proteins contain 4 key domains: KRAB (encoded by 2 exons), SSXRD (encoded by 1 exon), SET (encoded by 3 exons), and the ZF array (encoded by 1 exon). Complete exons are shown in blue. Missing or truncated exons are shown in pink. Other regions of the protein (upstream of the KRAB domain, and between KRAB and SSXRD) are encoded by additional exons (not shown here), that are not conserved between α1 and α2 clades. Paralogs were classified as “canonical PRDM9” if they contained all exons encoding the 4 key domains, without any frameshift/non-sense mutation (at least up to the first ZF) [NB: some sequences contain frameshifts or non-sense mutations in the ZF array. This leads to a shortened ZF array, but does not necessarily impair the function of PRDM9]. Paralogs were classified as “likely non-functional” if they contained frameshifts or non-sense mutations, or if they missed at least 1 SET exon. Other cases were classified as “truncated.” The 3 last α copies, belonging to O. kisutch, O. tshawytscha, and O. gorbuscha, have lost the 3 domains KRAB, SSXRD, and SET, but have kept their ZF exons, and were therefore added below the phylogenetic tree. The last column indicates the sequence indexes referring to the S1 Table with additional information on the corresponding copy. (B) Consensus history of Prdm9 duplication events in salmonids. After the teleost-specific WGD (Ts3R WDG), the chromosomes of the common ancestor of teleosts were duplicated. Two ohnolog chromosomes arose from the one carrying the ancestral Prdm9 locus: one carrying the Prdm9α copy and the other the Prdm9β copy. GD of the α paralog (referred to as α1) led to the appearance of a new α copy (α2) on another chromosome. The α1 copy (becoming α1.a) then underwent an SD, generating a α1.b copy in tandem on the same chromosome. By this time, the β paralog had lost the KRAB and SSXRD domains. Lastly, the 4 copies were duplicated during the salmonids-specific Ss4R WGD, with the newly formed paralogs (annotated α1.a.2, α1.b.2, α2.2, β2) on ohnolog chromosomes. One full-length copy was retained in each species. The Salmo genus (S. trutta and S. salar) retained the α1.2 copy, whereas all other salmonids retained the α1.1 copy. A second full-length PRDM9 was also retained in C. clupeaformis (α1.2), O. mykiss (α2.2), and S. namaycush (α2.2). Ohnolog chromosomes are represented with similar color shades (i.e., blue, red, and green) and Prdm9 locus in yellow. This global picture of the duplication events in the salmonid history does not show other independent lineage-specific duplication events and losses. The data and codes underlying this figure can be found in https://doi.org/10.5281/zenodo.11083953. GD, gene duplication; WGD, whole genome duplication; ZF, zinc finger.
Fig 2
Fig 2. Zinc finger allelic diversity of full-length PRDM9 in S. salar and O. mykiss.
(A) Structure of the identified PRDM9 alleles in S. salar PRDM9 α1.a.2 and O. mykiss PRDM9 α1.a.1. Colored boxes represent unique ZFs, characterized by the 3 amino acids in contact with DNA (3-letter code). Additional variations relative to the reference sequence are indicated in between brackets. The complete ZF amino acid sequences are shown in S3 Fig. (B) Frequencies of the alleles displayed in panel A among the 26 S. salar and 23 O. mykiss individuals in which Prdm9 was genotyped. (C) Distribution of amino acid diversity among all unique ZFs found in the alleles shown in panel A, following a previously described methodology [19]. The amino acid diversity is plotted as a function of the amino acid position in the ZF array, from position 1 to position 28 (first and last residues) of a ZF. The ratio of amino acid diversity at the DNA-binding residues of the ZF array (−1, 2, 3, and 6), indicated as r, is shown in the upper box of each panel. The data underlying this figure can be found in https://doi.org/10.5281/zenodo.11083953 and in S7 Table. ZF, zinc finger.
Fig 3
Fig 3. Meiotic DSB hotspots are specified by full length PRDM9 in O. mykiss.
(A) DSB hotspots detected by DMC1-SSDS (DMC1), H3K4me3 and H3K36me3 in selected regions of the O. mykiss genome in testes from 2 or 3 (DMC1) individuals. (B) Average profile of H3K4me3 (red) and H3K36me3 (blue) ChIP-seq signal in TAC-1 (Prdm91/5) and TAC-3 (Prdm92/6) testes, at DSB hotspots detected in TAC-1 (Prdm91/5), TAC-3 (Prdm92/6), and RT-52 (Prdm91/2). (C) On top, the PRDM9 allele 1 (E = 5.1e-37) and allele 2 motifs (E = 1.2e-63) discovered in allele 1 (n = 300) and allele 2 DSB sites (n = 254) are shown. Below, the plots depict the distribution of hits for the PRDM9 allele 1 (left) and allele 2 (right) motifs at allele 1 and allele 2 DSB sites from the center of the sequence up to 2.5 kb of distance. The signal is smoothed by weighted moving average, and hits were calculated in a 250 bp sliding window. (D) Violin plot showing the distribution of DSB hotspots from TAC-1 (magenta), TAC-3 (green), and RT-52 (blue) relative to the TSS from RefSeq annotated genes. The data and codes underlying this figure can be found in https://doi.org/10.5281/zenodo.11083953 and https://zenodo.org/records/14198863. ChIP, chromatin immunoprecipitation; DSB, double-strand break; TSS, transcription start site.
Fig 4
Fig 4. Recombination rates at genomic features.
The recombination rates at different genomic features are shown for O. kisutch, O. mykiss, and S. salar (NS population), and compared to those of sea bass (D. labrax) that lacks a full-length PRDM9 copy. (A) Fold recombination rates (scaled to the average recombination rate at 50 kb from the nearest feature) according to the distance to the nearest TSS (overlapping or not with a CGI). (B) Fold recombination rates (scaled to the average recombination rates in intergenic regions) at the indicated genomic features. (C) Hotspot density at the indicated genomic features. TSS in and out CGI are shown in purple and blue, respectively. The data and codes underlying this figure can be found in https://doi.org/10.5281/zenodo.11083953. NS, North Sea; TSS, transcription start site.
Fig 5
Fig 5. Recombination hotspots shared between populations and motif enrichment.
In panels (A–C), the Venn diagrams (left) show the percentages of recombination hotspots shared between pairs of taxa, and the graphs (middle and right) show the recombination rates around hotspots and at orthologous loci in the 2 taxa, for the 2 Oncorhynchus species (A), the American (GP population) and European (BS and NS populations) S. salar lineages (B), and between the 2 closely related European S. salar populations (BS and NS) (C). The percentage of shared hotspots was calculated using the number of hotspots in the population with fewer hotspots as the denominator. (D) Motif found enriched in the hotspots identified in the European populations of S. salar (BS and NS). The Venn diagram shows the percentages of population-specific and shared hotspots where the motif was found. (E) Mean recombination rate at shared hotspots (between the BS and NS populations) that harbor (n = 936 hotspots) or not (n = 3,485 hotspots) the detected motif. The recombination rate was significantly higher at hotspots with the motif (Student’s t test p-value <0.05). (F) Motif erosion in the European S. salar populations. The vertical line represents the observed difference in the occurrence of the motif in panel D between the American and European lineages. The null distribution (in gray) shows the difference for 100 random permutations of the motif. The data and codes underlying this figure can be found in https://doi.org/10.5281/zenodo.11083953. BS, Barents Sea; GP, Gaspesie Peninsula; NS, North Sea.

Comment in

Similar articles

Cited by

References

    1. Hunter N. Meiotic Recombination: The Essence of Heredity. Cold Spring Harb Perspect Biol. 2015;7(12). doi: 10.1101/cshperspect.a016618 - DOI - PMC - PubMed
    1. Zickler D, Kleckner N. Meiosis: Dances Between Homologs. Annu Rev Genet. 2023;57:1–63. doi: 10.1146/annurev-genet-061323-044915 - DOI - PubMed
    1. Nagaoka SI, Hassold TJ, Hunt PA. Human aneuploidy: mechanisms and new insights into an age-old problem. Nat Rev Genet. 2012;13(7):493–504. doi: 10.1038/nrg3245 - DOI - PMC - PubMed
    1. Coop G, Przeworski M. An evolutionary view of human recombination. Nat Rev Genet. 2007;8(1):23–34. doi: 10.1038/nrg1947 - DOI - PubMed
    1. Otto SP, Lenormand T. Resolving the paradox of sex and recombination. Nat Rev Genet. 2002;3(4):252–61. doi: 10.1038/nrg761 - DOI - PubMed

MeSH terms

LinkOut - more resources