. 2025 Jan 6;13(1):e009435.
doi: 10.1136/jitc-2024-009435.

Anti-PD-1 amplifies costimulation in melanoma-infiltrating Th1-like Foxp3+ regulatory T cells to alleviate local immunosuppression

Affiliations

Anti-PD-1 amplifies costimulation in melanoma-infiltrating Th1-like Foxp3+ regulatory T cells to alleviate local immunosuppression

Mikhaël Attias et al. J Immunother Cancer. .

Abstract

Background: Immune checkpoint inhibitors targeting programmed cell death protein-1 (PD-1) are the first line of treatment for many solid tumors including melanoma. PD-1 blockade enhances the effector functions of melanoma-infiltrating CD8+ T cells, leading to durable tumor remissions. However, 55% of patients with melanoma do not respond to treatment. As Foxp3+ regulatory T (Treg) cells play an important role in tumor-induced immunosuppression and express PD-1, we hypothesized that anti-PD-1 also increases the functions of melanoma-infiltrating Treg cells, which could be detrimental to treatment efficacy.

Methods: The cellular and functional dynamics of Treg cells were evaluated in C57Bl/6 Foxp3-reporter mice bearing highly immunogenic and PD-1 blockade-sensitive Yale University Mouse Melanoma Exposed to Radiation 1.7 (YUMMER1.7) tumors. Treg cell responses in tumors and lymphoid compartments were examined throughout tumor growth or therapy and were assessed ex vivo by multiparametric flow cytometry analysis, with in vitro suppression assays using tumor-infiltrating lymphocytes isolated by fluorescence-activated cell sorting (FACS) and in situ through spatial proteomic and transcriptomic profiling.

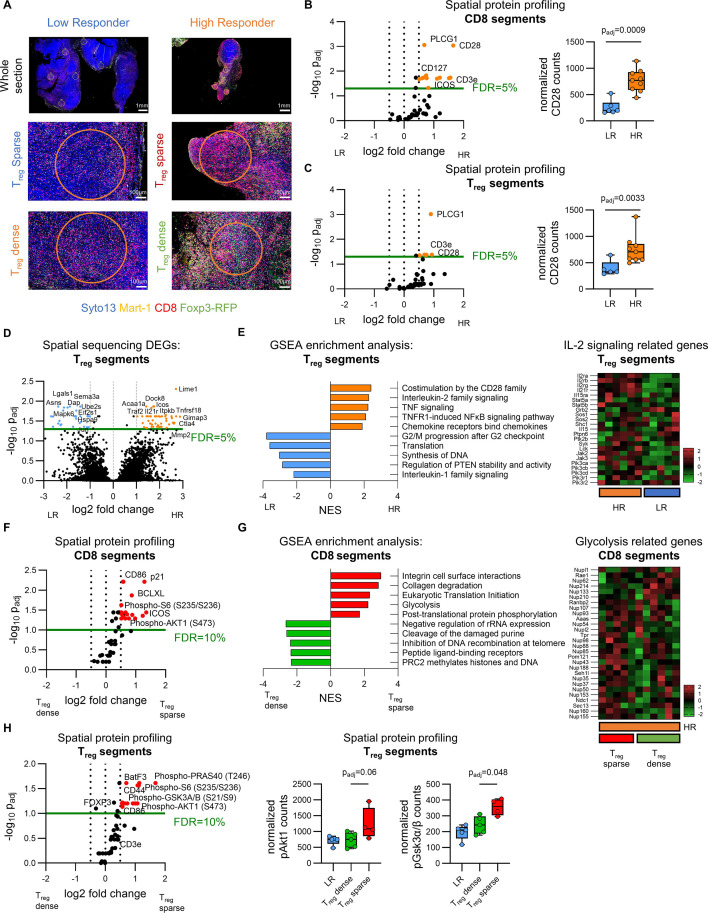
Results: In this highly immunogenic melanoma model, anti-PD-1 monotherapy yielded high responders (HRs) and low responders (LRs). We show that the potent CD8+ T cell responses characteristic of HR tumors paradoxically coincide with the expansion of highly-activated, Helios-expressing Treg cells. In both HRs and LRs, Treg cells co-localize with CD8+ T cells in immunogenic regions of the tumor and display potent suppressive capacity in vitro. Further characterization revealed that melanoma-infiltrating Treg cells progressively acquire T-bet and interferon gamma expression, exclusively in HRs, and induction of this T helper cell 1 (Th1)-like phenotype in vitro led to CD8+ T cell evasion from Treg cell-mediated suppression. Using spatial proteomic and transcriptomic profiling, we demonstrate that Treg cells display an increased activity of PI3K/Akt signaling in regions of HR tumors with an elevated CD8:Treg cell ratio.

Conclusions: PD-1 blockade promotes the expansion of a subset of highly-activated Treg cells coexpressing PD-1 and Helios. While these cells are potently suppressive outside tumor environments, costimulatory and inflammatory signals present in the tumor microenvironment lead to their local acquisition of Th1-like characteristics and loss of suppression of effector T cells.

Keywords: Immune Checkpoint Inhibitors; Melanoma; T cell; T regulatory cell - Treg.


Conflict of interest statement

Competing interests: None declared.

Figures

Figure 1
Figure 1. Helios+ Foxp3+ Treg cells accumulate in melanoma tumors throughout successful response to anti-PD-1 monotherapy. (A) Schematic of the experimental design. At day 8, mice were randomly assigned to a treatment group and received five injections of 250 µg of anti-PD-1 (clone RMP 1–14, Bio X Cell) (bronze, n=46) or PBS (white, n=27) every 48 hours (N=10). (B) Tumor growth curves are shown as boxplots from 2.5th to 97.5th percentile (compiled from N=10). Tumor volumes were fitted with a mixed-effects model and compared using Sidak’s multiple comparisons test. Mice sacked on day 20 for flow cytometry analysis were categorized as HR (orange, n=18) or LR (blue, n=20) based on a cut-off weight of 300 mg. Tumor weights are shown as boxplots from minimum to maximum, each dot represents one mouse. (C) In subsequent experiments, mice were sacrificed either pretreatment, at day 7 (N=3, n=18) or on day 14 (N=2, n=15), before HR and LR can be discriminated in the anti-PD-1 group (bronze). Flow cytometry analysis of CD8, CD4 and Foxp3-RFP expression. (D) Flow cytometry analysis and representative flow plots of IFNγ and TNFα expression by CD8+ TILs. Single cell suspensions were stimulated in the presence of PMA, Ionomycin and GolgiStop for 3 hours. MFIs were normalized using the average MFI in the control group experiment and compiled across N=10 repeats. Frequencies were compared by two-way ANOVA with Sidak’s correction; normalized MFIs were compared by one-way ANOVA with Tukey’s correction. (E) Flow cytometry analysis and representative flow plots of IFNγ and IL-2 expression by CD4+ TILs. Single cell suspensions were stimulated in the presence of PMA, Ionomycin and GolgiStop for 3 hours. Frequencies were compared by two-way ANOVA with Sidak’s correction, normalized MFIs were compared by one-way ANOVA with Tukey’s correction. (F) Flow cytometry analysis and representative flow plots of Foxp3 and Helios expression by CD4+ TILs. Frequencies were compared by two-way ANOVA with Sidak’s correction. (****p<0.0001, ***p<0.001, **p<0.01, *p<0.05). ANOVA, analysis of variance; HR, high responder; IFNγ, interferon gamma; IL-2, interleukin-2; LR, low responder; MFI, median fluorescence intensity; ns, not significant; PBS, phosphate-buffered saline; PD-1, programmed cell death protein-1; PMA, phorbol 12-myristate 13-acetate; Teff, effector T cell; TILs, tumor-infiltrating lymphocytes; TNFα, tumor necrosis factor alpha; Treg, regulatory T cell.
Figure 2
Figure 2. Upregulation of PD-1 by melanoma-infiltrating HeliosHigh Treg cells alters their phenotype at tumor endpoint. (A) Flow cytometry analysis and representative flow plots of Helios, CTLA-4, ICOS and PD-1 expression by Treg cells from tumor-draining lymph nodes (gray) or TILs (pink) at day 7. MFIs were normalized to the average MFI in the draining lymph nodes and shown from one experiment representative of N=3 repeats. Means were compared using a two-way ANOVA with Sidak’s correction. (B) 8–12 week-old, Foxp3RFP reporter mice were inoculated with 2.5×10⁵ YUMMER1.7 cells in 50% Matrigel and were sacrificed as soon as the first mouse in the experiment reached the humane endpoint (tumor volume>1500 mm3) (n=21, N=4). Flow cytometry analysis of Foxp3, CD25, Helios, PD-1, and CTLA-4 expression by Foxp3+ Treg cells. All flow plots from tumor-draining lymph nodes (gray), TILs (pink) are representative of untreated mice bearing a tumor at the humane endpoint volume (>1500 mm3). MFIs were normalized to the average MFI in the draining lymph nodes and shown from one experiment representative of N=4 repeats. Means were compared using a two-way ANOVA with Sidak’s correction. (C) Foxp3RFP mice were injected with YUMMER1.7 cells (2.5×10⁵) and received no treatment until the humane endpoint. Splenic and TIL Foxp3-RFP+ cells were sorted and pooled from n=2 mice, then co-cultured with CTV-labeled splenic CD4+ RFP Tresp cells (5×10⁴), mitomycin-C inactivated feeders (1×10⁵) and soluble anti-CD3 (0.5 µg/mL) for 72 hours. Flow cytometry analysis of Treg Foxp3 expression and Tresp cell proliferation (CTV dilution analysis), when cultured with no Treg cells (black), 1:2 splenic Treg cells (white) or 1:2 Treg TILs (pink). % suppression was calculated by comparing division indexes using 0:1 as a baseline for the absence of suppression. Means were compared using a two-way ANOVA with Sidak’s correction. Data shown from one experiment representative of N=3 repeats. (D) Splenic and TIL RFP+ Treg cells were isolated by FACS from a YUMMER1.7-bearing mouse at tumor endpoint, and co-cultured for 72h with CTV-labeled, splenic RFP- Teff cells in wells previously coated with anti-CD3 (3 µg/mL), anti-CD28 (2 µg/mL),±PD-L1-Fc (5 µg/mL). Representative flow cytometry plots and analysis of Foxp3, CD25 and CTLA-4 expression by Treg cells. Means were compared using a two-way ANOVA with Sidak’s correction. Data shown from one experiment representative of N=2 repeats. (E–F) Representative flow cytometry plots and analysis of PD-1, Foxp3, Helios, and CD25 expression by TIL-Treg cells from control (white, n=24), LR (blue, n=20) and HR (orange, n=18) tumors. MFIs were normalized to the average MFI in the control group and compiled across N=10 repeats. Means were compared using a two-way ANOVA with Sidak’s correction. (****p<0.0001, ***p<0.001, **p<0.01, *p<0.05). ANOVA, analysis of variance; CTLA-4, cytotoxic T-lymphocytes-associated protein 4; CTV, CellTrace Violet; HR, high responder; LNs, lymph nodes; LR, low responder; ns, not significant; PD-1, programmed cell death protein-1; TILs, tumor-infiltrating lymphocytes; Treg, regulatory T cell.
Figure 3
Figure 3. PD-1 blockade promotes the activation and expansion of highly suppressive HeliosHigh Treg cells. (A) Representative flow cytometry plots and analysis of Helios and Ki67 expression by Treg TILs from control (n=24), LR (n=20) and HR (n=18) tumors at endpoint (N=10). Frequencies were compared using a two-way ANOVA with Sidak’s correction. (B) Flow cytometry analysis of Ki67, PD-1 and Helios expression by splenic Treg, Tconv and CD8+ cells at day 14 in control (n=7) or anti-PD-1 (n=8) treated YUMMER1.7-bearing mice (N=2). Frequencies were compared using either a two-way ANOVA with Sidak’s correction or Student’s t-test. (C) Representative flow cytometry plots and analysis of CTLA-4, ICOS and TIGIT expression by Treg TILs from control, LR and HR tumors at endpoint. MFIs were normalized to the average MFI in the control group for each experiment. Means were compared using one-way ANOVA with Sidak’s correction. (D) Flow cytometry analysis of ICOS expression by splenic Treg cells at day 14 in control (n=7) or anti-PD-1 (n=8) treated YUMMER1.7-bearing mice (N=2). MFIs were normalized to the average MFI in the control group for each experiment. Means were compared using Student’s t-test. (E) Splenic and TIL-Treg cells were sorted from two HR and two LR mice and cultured at various ratios with CD4+ RFP Tresp cells, accessory cells and soluble anti-CD3 for 72 hours (N=3). Flow cytometry analysis of CTV expression by CD4+ Tresp cells when co-cultured with no (black), splenic (white), LR (blue) or HR (orange) Treg cells in medium. % suppression of Tresp proliferation was calculated by comparing division indexes using 0:1 as a baseline for the absence of suppression. Means were compared using a two-way ANOVA with Sidak’s correction. Data shown from one experiment representative of N=3 repeats. ANOVA, analysis of variance; CTLA-4, cytotoxic T-lymphocytes-associated protein 4; CTV, CellTrace Violet; HR, high responder; LR, low responder; MFI, median fluorescence intensity; ns, not significant; PD-1, programmed cell death protein-1; TILs, tumor-infiltrating lymphocytes; Tconv, conventional CD4+ T cell; Treg, regulatory T cell; YUMMER1.7, Yale University Mouse Melanoma Exposed to Radiation 1.7.
Figure 4
Figure 4. Successful response to anti-PD-1 favors the Th1-like functional adaptation of HeliosHigh Treg cells. (A) Representative flow cytometry plots and analysis of T-bet expression by Treg cells from untreated mice(n=21, N=4). Representative flow cytometry plots from tumor-draining lymph nodes (gray), Helioslow (pink) and HeliosHigh TILs (red) are shown from a mouse bearing a tumor at humane endpoint volume (>1500 mm3). Raw MFIs (n=8) were compared using a one-way repeated measures ANOVA and shown from one experiment representative of N=4 repeats. (B) Splenic RFP+ Treg cells were isolated by FACS from 8-week-old Foxp3-RFP reporter mice, and co-cultured with CTV-labeled, splenic RFP Tconv cells, soluble IL-12 (10 ng/mL) in wells previously coated with anti-CD3 (3 µg/mL), anti-CD28 (2 µg/mL), and in the absence or presence of PD-L1-Fc (5 µg/mL). Flow cytometric analysis and representative flow plots of T-bet and IFNγ expression by Treg cells are shown. Frequencies were compared using a two-way ANOVA with Sidak's correction. Data shown from one experiment representative of N=2 repeats. (C) Representative flow cytometry plots and analysis of T-bet expression by CD4+ Teff and Treg cells on day 7 (N=3), day 14 (N=2) or day 20 (N=10). Means were compared by pairs using a two-way ANOVA with Sidak’s correction for multiple comparisons. (D) Representative flow plots of T-bet expression by Treg cells from control (white), LR (blue) and HR (orange) mice. MFIs were normalized to the average MFI in the control group of the experiment and compiled across N=10 repeats. Means were compared using a one-way ANOVA with Tukey’s correction. (E) Flow cytometry analysis and representative flow plots of IFNγ and T-bet expression by Treg TILs. Single-cell suspensions were incubated for 3 hours in the presence of PMA, Ionomycin and GolgiStop to assess IFNγ secretion by TIL Treg cells by flow cytometry. Means were compared using a two-way ANOVA with Sidak’s correction. (F) Treg TILs were isolated from an HR tumor and co-cultured at a 1:4 ratio with CD4+ Tresp cells as previously described, in regular or IFNγ or IL-12-supplemented medium (10 ng/mL). Flow cytometry analysis and representative flow plots of T-bet and IFNγ expression by Treg cells. Means were compared by two-way ANOVA with Sidak’s correction. Data shown from one experiment representative of N=2 repeats. (G–H) Splenic and TIL Treg cells were purified from HR and LR mice and co-cultured at a 1:4 ratio with CD8+ Tresp cells, in regular or IL-12-supplemented medium (10 ng/mL). Flow cytometry analysis of IFNγ, GRZB expression, and proliferation (measured by CTV dilution and quantified by proliferation index) by CD8+ Tresp cells when co-cultured with splenic (white) LR (blue) or HR (orange) Treg cells. % suppression of Tresp proliferation was calculated by comparing division indexes using 0:1 as a baseline for the absence of suppression. Means were compared using a two-way ANOVA with Sidak’s correction. Data shown from one experiment representative of N=2 repeats. (****p<0.0001, ***p<0.001, **p<0.01, *p<0.05). ANOVA, analysis of variance; CTV, CellTrace Violet; FACS, fluorescent-activated cell sorting; HR, high responder; IFNγ, interferon gamma; IL-12, interleukin-12; LNs, lymph nodes; LR, low responder; MFI, median fluorescence intensity; ns, not significant; PD-1, programmed cell death protein-1; PD-L1, programmed death-ligand 1; PMA, phorbol 12-myristate 13-acetate; Tconv; conventional CD4+ T cell, Th1, T helper cell 1; TILs, tumor-infiltrating lymphocytes; Treg, regulatory T cell; Tresp, responder T cell.
Figure 5
Figure 5. Treg cells preferentially co-localize with CD8+ T cells in tumor microenvironments. (A–C) At tumor endpoint, control (n=6), HR (n=6) and LR (n=4) tumors were resected and processed into formalin-fixed paraffin embedded blocks (N=2). Slides were deparaffinized and stained for assessment of CD8 and Foxp3-RFP expression. Whole tissue and 10× magnification views of representative tumors. CD4 and Foxp3-RFP were co-stained on adjacent tissue sections. Tissue area, CD8+ and CD4+ Foxp3-RFP Treg cell counts were obtained using QuPath and compared using a one-way ANOVA with Tukey’s correction for multiple comparisons. (D–G) Mart-1 was stained on adjacent tissue sections. Mart-1+ cell counts were compared using a one-way ANOVA with Tukey’s correction. Regions of high Mart-1 expression were annotated and superimposed to the CD8 scan to assess co-localization. CD8+ T cell densities were measured in and out of Mart-1 annotated regions, represented as a heatmap overlayed with Mart-1 regions, and compared using Wilcoxon’s matched-pairs signed rank test. (H–J) The five hotspots of maximal CD4+ Foxp3-RFP+ cell density (radius=300 µm) were localized and represented as white circles, overall Treg density is represented as heatmaps. These hotspots were overlayed onto the CD8 scan and CD8+ T cell counts within these regions were summed up and compared with the whole tissue average using Wilcoxon’s matched-pairs signed rank test and across treatment groups, using a one-way ANOVA with Tukey’s correction. (K) Within each overlayed Treg hotspot, we calculated the distance of each Foxp3-RFP+ Treg cell to the closest CD8+ TIL. Data shown as violin plots and means were compared using a mixed model nested one-way ANOVA with Tukey’s correction. (L) CD8:Treg ratios were derived in each Treg hotspot and means were compared using a mixed model nested one-way ANOVA to account for repeated sampling within individual tumors. (****p<0.0001, ***p<0.001, **p<0.01, *p<0.05). ANOVA, analysis of variance; DAPI, 4',6-diamidino-2-phénylindole; HR, high responder; LR, low responder; TIL, tumor-infiltrating lymphocyte; Treg, regulatory T cell.
Figure 6
Figure 6. Spatial proteomic and transcriptomic profiling reveal increased PI3K/Akt activity in both CD8+ and Treg cells located in Treg sparse regions of high-responder tumors. (A) Selection of Treg sparse and Treg dense ROIs for spatial profiling. ROIs were repeatedly sampled from merged immunofluorescence of LR (n=1) and HR (n=3) samples (SYTO 13: blue, Mart-1: yellow, CD8: red, Foxp3-RFP: green), using a criteria for intermediate (125<Treg/mm2<300) or high Treg cell density (Treg/mm2>300). ROIs selected for protein profiling (n=15) and transcriptomic profiling (n=21) are delimited by orange circles and all spanned between 0.19 and 0.34 mm2. (B–C) Differential protein expression between pooled Treg sparse and Treg dense ROIs from LR (n=6) and HR (n=9) CD8 and Treg segments. One LR Treg sparse segment was removed from the analysis due to insufficient Foxp3 counts. Protein counts were scaled to nuclei count in each segment to allow for comparison of protein expression on a per-cell basis, then normalized to the geometric mean of the pair of housekeeper proteins with the maximal consistency (GAPDH and Histone H3). Orange-colored proteins have a fold-change expression >1.65 and a BH adjusted p value<0.05. Boxplots of CD28 counts in CD8 and Treg segments of HR and LR ROIs are presented as minimum to maximum. (D) Differential gene expression between Treg dense segments from LR (n=5) and HR (n=6) ROIs. Treg cell numbers in Treg sparse segments were below the LOQ to perform whole transcriptome analysis. Gene targets with<90% segments above LOQ were filtered out of the data set, scaled gene counts were then normalized to Q3. Genes colored in orange have a fold-change expression >1.65, and genes colored in blue have a fold-change expression <−1.65, and a BH adjusted p value<0.05. (E) GSEA analysis showing the signaling pathways enriched in LR (blue) or HR (orange) Treg dense segments. The five non-redundant pathways with the highest absolute NES for each group are represented as histograms. Expression levels for each IL-2 family signaling related gene within HR (orange) and LR (blue) Treg segments are represented as a heatmap with red indicating a Z-score>1 and green indicating a Z-score≤1. (F) Differential protein expression between CD8 segments of Treg sparse (n=5) and Treg dense (n=6) ROIs from HR tumors. Red-colored proteins have a fold-change expression >1.65 and a BH adjusted p value<0.1. (G) GSEA analysis showing the signaling pathways enriched in the CD8 segments of Treg sparse (red) or Treg dense (green) ROIs from HR tumors. The five non-redundant pathways with the highest absolute NES for each group are represented as histograms. NES for each glycolysis related gene within CD8 segments of Treg sparse (red) and Treg dense (green) ROIs from HR tumors are represented as a heatmap with red indicating a Z-score>1 and green indicating a Z-score≤1. (H) Differential protein expression between Treg segments of Treg sparse (n=4) and Treg dense (n=5) ROIs from HR tumors. Red-colored proteins have a fold-change expression >1.65 and a BH adjusted p value<0.1. Boxplots of phosphoAkt1 and phosphoGsk3α/β counts in Treg segments of LR (n=5), Treg dense (n=5) and Treg sparse (n=4) HR AOIs are presented as minimum to maximum. AOI, area of interest; BH, Benjamini-Hochberg; DEG, differentially expressed genes; FDR, false discovery rate; GSEA, gene set enrichment analysis; HR, high responder; IL-2, interleukin-2; LOQ, limit of quantitation; LR, low responder; NES, normalized enrichment score; ROI, region of interest; TNF, tumor necrosis factor; Treg, regulatory T cell.

References

    1. Wolchok JD, Chiarion-Sileni V, Gonzalez R, et al. CheckMate 067: 6.5-year outcomes in patients (pts) with advanced melanoma. JCO. 2021;39:9506. doi: 10.1200/JCO.2021.39.15_suppl.9506. - DOI
    1. Champiat S, Dercle L, Ammari S, et al. Hyperprogressive Disease Is a New Pattern of Progression in Cancer Patients Treated by Anti-PD-1/PD-L1. Clin Cancer Res. 2017;23:1920–8. doi: 10.1158/1078-0432.CCR-16-1741. - DOI - PubMed
    1. Galon J, Bruni D. Approaches to treat immune hot, altered and cold tumours with combination immunotherapies. Nat Rev Drug Discov. 2019;18:197–218. doi: 10.1038/s41573-018-0007-y. - DOI - PubMed
    1. Attias M, Al-Aubodah T, Piccirillo CA. Mechanisms of human FoxP3+ Treg cell development and function in health and disease. Clin Exp Immunol. 2019;197:36–51. doi: 10.1111/cei.13290. - DOI - PMC - PubMed
    1. Curiel TJ, Coukos G, Zou L, et al. Specific recruitment of regulatory T cells in ovarian carcinoma fosters immune privilege and predicts reduced survival. Nat Med. 2004;10:942–9. doi: 10.1038/nm1093. - DOI - PubMed

MeSH terms

Substances

LinkOut - more resources