. 2025 Jan 6;16(1):335.
doi: 10.1038/s41467-024-55330-7.

Spatial tumor immune heterogeneity facilitates subtype co-existence and therapy response in pancreatic cancer

Affiliations

Spatial tumor immune heterogeneity facilitates subtype co-existence and therapy response in pancreatic cancer

Lukas Klein et al. Nat Commun. .

Abstract

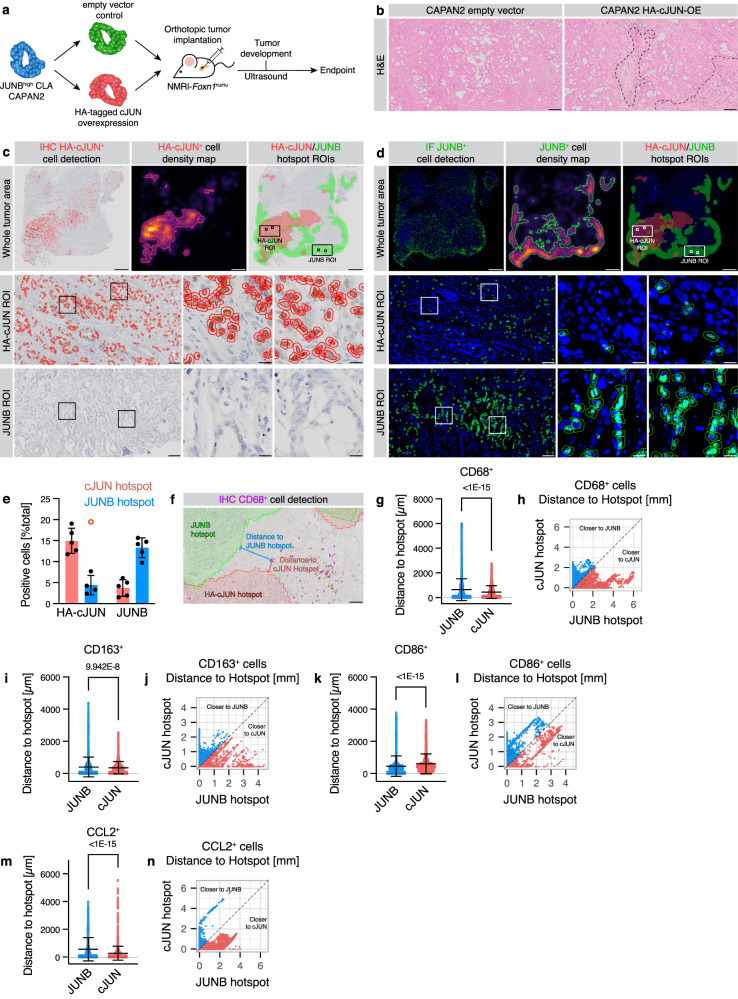
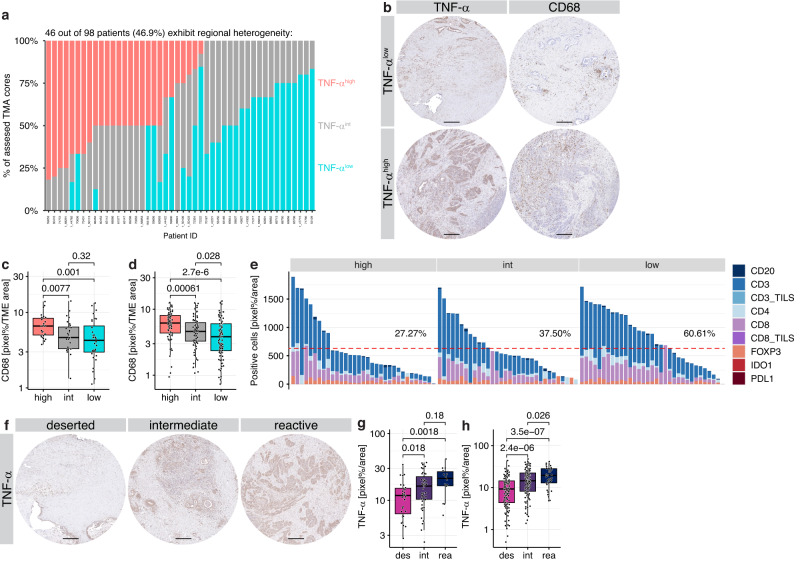
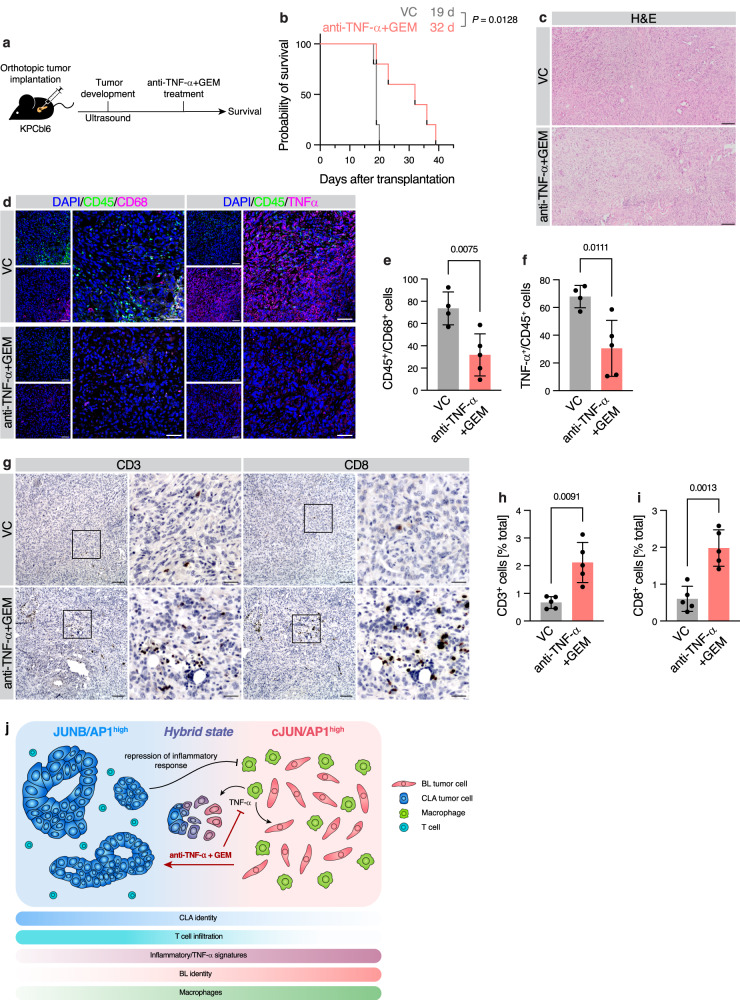
Pancreatic ductal adenocarcinoma (PDAC) displays a high degree of spatial subtype heterogeneity and co-existence, linked to a diverse microenvironment and worse clinical outcome. However, the underlying mechanisms remain unclear. Here, by combining preclinical models, multi-center clinical, transcriptomic, proteomic, and patient bioimaging data, we identify an interplay between neoplastic intrinsic AP1 transcription factor dichotomy and extrinsic macrophages driving subtype co-existence and an immunosuppressive microenvironment. ATAC-, ChIP-, and RNA-seq analyses reveal that JUNB/AP1- and HDAC-mediated epigenetic programs repress pro-inflammatory signatures in tumor cells, antagonizing cJUN/AP1 signaling, favoring a therapy-responsive classical neoplastic state. This dichotomous regulation is amplified via regional TNF-α+ macrophages, which associates with a reactive phenotype and reduced CD8+ T cell infiltration in patients. Consequently, combined preclinical anti-TNF-α immunotherapy and chemotherapy reduces macrophages and promotes CD3+/CD8+ T cell infiltration in basal-like PDAC, improving survival. Hence, tumor cell-intrinsic epigenetic programs, together with extrinsic microenvironmental cues, facilitate intratumoral subtype heterogeneity and disease progression.


Conflict of interest statement

Competing interests: The authors declare no competing interests.

Figures

Fig. 1
Fig. 1. Neoplastic JUNB expression associates with GATA6 in PDAC patients.
a Meta-analysis of enriched pathways in regions accessible in CAPAN1 and CAPAN2 (ATAC-seq) and bound in CAPAN1 by JUNB (ChIP-seq). Node color indicates significance, link width the number of gene overlaps between gene sets. b Epithelial-specific RNA-seq of resected PDAC patients in the Deutsche Krebsforschungszentrum (DKFZ) was generated by fluorescence-activated cell sorting (FACS) of EPCAM+/CD45/CD31 cells. c Gene set enrichment analysis for Chan-Seng-Yue PDAC subtypes in genes correlating with JUNB in epithelial compartment-sorted transcriptomes of b. Normalized enrichment score (NES) and FDR q value are indicated. d Correlation analysis for epithelial-specific JUNB and GATA6. Linear regression with 95% CI, as well as Spearman’s R and associated P value. n = 31 patients. e IF for JUNB, GATA6, and pan-cytokeratin (panCK) in resection tissue of therapy-naive PDAC patients at representative region with high, intermediate, and low epithelial JUNB expression in the University Medical Center Göttingen (UMG) cohort. Epithelial area is overlayed on greyscale images in magenta, based on panCK+ cell classification. In the overlay, blue: DAPI, green: JUNB, magenta: panCK, yellow: GATA6. Scale bar 50 μm. f Quantification of (e) for JUNB+ and GATA6:JUNB double-positive epithelial (panCK+) cells, plotted as in (d). n = 32 patients. gm IHC analysis in 105 PDAC patients of the Princess Margaret Cancer Centre (PMCC) for epithelial JUNB expression. g IHC for JUNB, GATA6 and ECAD in cores classified as JUNBlow and JUNBhigh. Scale bar 200 μm. hm Quantification of (g), for GATA6 (hj) and ECAD (km) in JUNBlow and JUNBhigh expression per patient (h, k), per TMA core across all patients (i, l) and in heterogeneous patients showing matched levels in JUNBlow and JUNBhigh cores (j,m). h,j, high, n = 51; low, n = 52 patients. i, high, n = 106, low, n = 112 cores. k, m, high, n = 51; low, n = 49 patients. l high, n = 123; low, n = 119 cores. Boxplots show 25th to 75th percentile with median as box and highest and lowest value in 1.5 times interquartile range as whiskers. Two-tailed Wilcoxon rank sum test. n Correlation analysis for JUNB and GATA6 in LCM-enriched epithelia of COMPASS trial patients (stage I–IV), plotted as in (d). n = 439 patients. Source data are provided as a Source Data file.
Fig. 2
Fig. 2. Prognostic relevance of JUNB-repressed inflammatory signaling.
Coverage of previously published JUNB ChIP-seq data in CAPAN1, as well as publicly available H3K27ac data, for loci of JUNB (a), GATA6 (b), HNF1B (c), and FOXA1 (d). ChIP-qPCR validation regions are indicated. ChIP-qPCR for regions indicated in (ad), showing signal relative to input for JUNB (e) and H3K27ac (f) pulldown with mean ± s.d. and average IgG isotype control. n = 3 biological replicates. gi Integration of RNA-seq data performed after JUNB silencing (siJUNB; n = 3 biological replicates) or control siRNA (siCtrl; n = 2 biological replicates) in CAPAN1, with ChIP-seq for JUNB. g Violin plot of log2 fold change (FC) in siJUNB RNA-seq data for all (n = 36.740) or JUNB-bound (n = 698) genes. Median and quartiles are indicated. Two-tailed Student’s t-test with Welch’s correction. h As in (g), showing the number of genes that display a significant upregulation (sigUP) or downregulation (sigDN), or no significant change (ns). i Gene ontology analysis of significantly upregulated, JUNB-bound genes following JUNB silencing with –log10(q-value) indicated. Hallmark (H) and curated (C2) signature collections of the Molecular Signature Database (MSigDB) are shown. j Spearman correlation of genes as in (i) with JUNB in 46 PDAC cell lines of the Cancer Cell Line Encyclopedia (CCLE). Negatively associated genes (red) form the JUNB repression signature. k Overall survival, numbers at risk, and hazard ratio in TCGA (n = 150), Puleo (n = 288), QCMG (n = 96), and Zhou (n = 85) patients stratified by JUNB repression signature (j) score. Top: Kaplan-Meier survival analysis for the lower/upper quartiles (n = 155 patients each) and mid-group (n = 309 patients) for JUNB repression signature scores. Median survival (ms) is indicated. Log-rank test. Bottom: Cox proportional hazard. Hazard ratio (to lower quartile) with 95% CI. P values are shown right. l As in (k), for progression-free survival in the TCGA cohort. Source data are provided as a Source Data file.
Fig. 3
Fig. 3. JUNB-HDAC1 complex represses inflammatory signals and cJUN.
a Heatmap showing expression of cytokines present in the core enrichment of the gene sets shown in Supplementary Fig. 3a–d, for JUNB silencing (siJUNB; n = 3 biological replicates) versus control siRNA (siCtrl; n = 2 biological replicates) in CAPAN1 cells. Cell color indicates z score. b qRT-PCR analysis for indicated target genes in siJUNB conditions (red), normalized to siCtrl (gray), in CAPAN1. Relative mRNA expression with mean ± s.d. shown. n = 3 biological replicates. Two-tailed Student’s t-test with Welch’s correction. Coverage of JUNB ChIP-seq data in CAPAN1, as well as publicly available H3K27ac data, for loci of cJUN (c), IL1A/B (d), and CXCL9/10/11 (e). ChIP-qPCR validation regions are indicated. f Gene set enrichment analysis for curated signatures (C2) of the Molecular Signature Database (MSigDB) for siJUNB versus siCtrl in CAPAN1 cells. Normalized enrichment score (NES) and FDR q value are indicated. Immunoblot for JUNB, HDAC1, and β-actin after JUNB pulldown, IgG isotype control or input in CAPAN1 (g) and CAPAN2 (h). n = 3 biological replicates. i, j, ChIP-qPCR for regions indicated in (ce), showing signal relative to input for JUNB (i) and HDAC1 (j) pulldown with mean ± s.d. and average IgG isotype control. n = 3 biological replicates. k, l, ChIP-seq analysis for JUNB in control cells (as in ce) and HDAC1 with siJUNB or siCtrl. k Overlap of JUNB binding regions and regions where HDAC1 is significantly lost upon siJUNB (“HDAC1_DOWN”). l, GREAT analysis of the overlapping regions of (k) with –log10(Padj) for binomial test indicated. Hallmark (H) and C2 signatures of MSigDB are shown. Representative immunoblot for JUNB, cJUN, CCL2, and β-actin in HPAF-II (m) and CFPAC-1 (n) after siJUNB or siCtrl. n = 3 biological replicates. o Dual-luciferase reporter assay for cJUN promoter firefly luciferase (Luc) constructs in CAPAN2 cells with varying concentrations of JUNB overexpression plasmids (or EV controls). Relative Luc activity to Renilla luciferase control with mean ± s.d. shown. One-way ANOVA. n = 3 biological replicates. Immunoblot for JUNB, cJUN, and β-actin in CAPAN1 (p) and CAPAN2 (q) cells with overexpression of cJUN (cJUN-OE) or empty vector (EV) control. n = 3 biological replicates. Source data are provided as a Source Data file.
Fig. 4
Fig. 4. Regional AP1 heterogeneity determines macrophage recruitment.
a NMRI-Foxn1nu/nu mice were orthotopically transplanted with CAPAN2 cells with stable HA-tagged cJUN overexpression (HA-cJUN-OE) or empty vector (EV) control. b H&E staining of CAPAN2 HA-cJUN-OE and EV tumors. Immune infiltrates are indicated. Scale bar 100 μm. n = 8 animals. c-n, QuPath-based analysis of HA-cJUN-OE tumors for HA-cJUN IHC, DAPI-JUNB IF, CD68 IHC, CD163 IHC, CD86 IHC, and DAPI-CCL2 IF. IHC for the HA tag of cJUN (c) or IF for JUNB (d) in serial sections. Nuclear-positive cell detections (red/green) are indicated. Density maps of positive cells were created and thresholded to derive hotspot regions for HA-cJUN+ and JUNB+ cells, respectively, in the same tumors. Whole tumor overviews as well as a HA-cJUN (mid) and a JUNB (bottom) hotspot ROIs are shown. Scale bar: tumor overview, 1 mm; large ROI, 100 µm; ROI insert, 20 µm. e Quantification of (c, d) for HA-cJUN+ and JUNB+ cells relative to the total number of detected cells in cJUN (red) and JUNB (blue) hotspot regions, with mean ± s.d. shown. One outlier is indicated (red circle), which was excluded for mean and s.d. n = 5 tumors. f IHC for CD68 in HA-cJUN-OE tumors, with CD68+ cell detection (purple), as well as JUNB and HA-cJUN hotspots. Exemplary 2D distance measurement strategy which was used in (g-n) is shown. Scale bar 100 µm. Distance analysis of CD68+ (g), CD163+ (i), CD86+ (k), or CCL2+ (m) cells to JUNB or HA-cJUN hotspots. Scatter plots show each individual cell, with mean ± s.d. Two-tailed Student’s t-test with Welch’s correction. g, n = 14774 CD68+ cells from n = 5 tumors, with a total of n = 1,003,639 cells analyzed. i, n = 7691 CD163+ cells from n = 4 tumors, with a total of n = 654,297 cells analyzed. k n = 8384 CD86+ cells from n = 4 tumors, with a total of n = 632,792 cells analyzed. m n = 14,925 CCL2+ cells from n = 5 tumors, with a total of n = 745,208 cells analyzed. h, j, l, n As in (g, i, k, m) showing the shortest distances of each cell towards both the HA-cJUN and JUNB hotspots. Source data are provided as a Source Data file.
Fig. 5
Fig. 5. TNF-α disrupts CLA subtype identity and anti-tumor immunity.
a Heatmap of CLA and BL PDAC identity genes, in previously published RNA-seq data of CAPAN1 cells treated with TNF-α or vehicle control (VC) for 18 h. Cell color indicates z score. n = 3 biological replicates. bf Virtually microdissected RNA-seq data of orthotopically transplanted CAPAN1 tumors in NMRI-Foxn1nu/nu mice treated with TNF-α or VC for 3 weeks. n = 3 tumors; one stroma-specific transcriptome was excluded from the analysis. b Deconvolution of bulk RNA-seq to generate tumor (human) and stromal (murine) cell-specific transcriptomes (Methods). Tumor cell-specific transcriptome. Gene set enrichment analysis (GSEA) for Hallmark signatures of the Molecular signature database (MSigDB) (c) and PDAC subtype signatures (d), for TNF-α versus VC. Normalized enrichment score (NES) and FDR q-value are indicated. e As in (c), for stroma-specific transcriptome. f MCPcounter analysis in stroma-specific transcriptome. Cell color indicates z score. g Relative MCPcounter scores for the indicated lineages in n = 652 patients of the TCGA, QCMG, Puleo, and Zhou cohort, separated into quartiles based on the JUNB repression signature score (as in Fig. 2k, l). MCPcounter scores were min–max normalized and standardized to the mean of the lower JUNB repression signature score group. Mean ± s.d. shown. h As in (g), but applying CIBERSORTx for deconvolution. Mean ± s.d. for CIBERSORTx percentages shown. i IF for JUNB in orthotopically transplanted CAPAN1 tumors treated with TNF-α or VC, with cell detection for nuclear JUNB+ cells. Scale bar 50 μm. j Quantification of i, for per-animal average nuclear JUNB intensity with mean ± s.d. shown. n = 5 animals. k As in (i), for ECAD and GATA6 staining and cell detection for nuclear GATA6+ cells. l Quantification of k for per-animal average ECAD intensity per FOV with mean ± s.d. shown. m As in (l), for nuclear GATA6 intensity. l, m, VC, n = 7 animals; TNF-α, n = 8 animals. n As in (i), for CD163 IHC staining. Arrows indicate positive cells. Scale bar: overview, 100 μm; insert, 25 μm. o Quantification of (n) for per-animal percentage of CD163+ cells with mean ± s.d. shown. n = 7 animals. g, h, j, l, m, o Two-tailed Student’s t-test with Welch’s correction. Source data are provided as a Source Data file.
Fig. 6
Fig. 6. Spatial TNF-α expression promotes macrophage infiltration and T-cell exclusion.
ah IHC analysis in 105 PDAC patients of the Princess Margaret Cancer Centre (PMCC) for TNF-α expression. a Spatial heterogeneity of TNF-α expression within different TMA cores of each patient. b IHC for TNF-α and CD68 in cores classified as TNF-αlow and TNF-αhigh. Scale bar 200 μm. c, d Quantification of (b), in TNF-αlow, TNF-αintermediate (TNF-αint), and TNF-αhigh expression per patient (c) and per TMA core across all patients (d). c TNF-αhigh, n = 30 patients; TNF-αint, n = 28 patients; TNF-αlow, n = 32 patients. d TNF-αhigh, n = 87 cores; TNF-αint, n = 92 cores; TNF-αlow, n = 96 cores. e Lymphoid compartment distribution in TNF-αlow/int/high patients. Line and percentages denote patients above a third of the maximum value. f Representative IHC staining of TMA cores for TNF-α in deserted, intermediate, and reactive subTMEs. Scale bar 200 μm. Quantification for TNF-α per patient (g) or TMA core (h) is classified as deserted (des), intermediate (int), and reactive (rea). g des, n = 41 patients; int, n = 45 patients; rea, n = 11 patients. h des, n = 120 cores; int, n = 134 cores; rea, n = 39 cores. Boxplots show 25th to 75th percentile with median as box and highest and lowest value in 1.5 times interquartile range as whiskers. Two-tailed Wilcoxon rank sum test. Source data are provided as a Source Data file.
Fig. 7
Fig. 7. Targeting of TNF-α during chemotherapy restores anti-tumor immunity and prolongs survival.
a KPC cells were orthotopically implanted into syngeneic C57BL6/J mice and treated with an anti-TNF-α antibody in combination with gemcitabine (GEM) chemotherapy, or vehicle control (VC). b Kaplan-Meier survival analysis of a. Median survival indicated. Log-rank test. VC, n = 5 animals. c H&E staining of anti-TNF-α + GEM and VC tumors. Scale bar 100 μm. d IF for CD45 with CD68, and CD45 with TNF-α, in anti-TNF-α + GEM and VC tumors. Scale bar 50 μm. Quantification of (d) for CD45/CD68 (e) and TNF-α/CD45 (f) double-positive cells. Per-animal average counts per FOV with mean ± s.d. shown. VC, n = 4 animals; anti-TNF-α + GEM, n = 5 animals. g, IHC for CD3 and CD8 in orthotopically transplanted anti-TNF-α + GEM and VC tumors. Scale bar: overview, 100 μm; insert, 30 μm. Quantification of (g) for CD3+ (h) and CD8+ (i) cells. Per-animal average percentage of positive cells with mean ± s.d. shown. n = 5 animals. e, f, h, i Two-tailed Student’s t-test with Welch’s correction. j Model of AP1 dichotomy in PDAC subtype co-existence and immune recruitment. Source data are provided as a Source Data file.

References

    1. Siegel, R. L., Miller, K. D., Wagle, N. S. & Jemal, A. Cancer statistics, 2023. CA A Cancer J. Clin.73, 17–48 (2023). - PubMed
    1. Sohal, D. P. S. et al. Metastatic pancreatic cancer: ASCO guideline update. JCO38, 3217–3230 (2020). - PubMed
    1. Surveillance Research Program, National Cancer Institute. SEER*Explorer: An interactive website for SEER cancer statistics. Data source(s): SEER Incidence Data, November 2022 Submission (1975-2020).
    1. Bailey, P. et al. Genomic analyses identify molecular subtypes of pancreatic cancer. Nature531, 47–52 (2016). - PubMed
    1. Moffitt, R. A. et al. Virtual microdissection identifies distinct tumor- and stroma-specific subtypes of pancreatic ductal adenocarcinoma. Nat. Genet.47, 1168–1178 (2015). - PMC - PubMed

Publication types

MeSH terms

Substances

Associated data