. 2025 Jan 6;15(1):1014.
doi: 10.1038/s41598-024-83775-9.

Spatial transcriptomics unveils estrogen-modulated immune responses and structural alterations in the ectocervical mucosa of depot medroxyprogesterone acetate users

Affiliations

Spatial transcriptomics unveils estrogen-modulated immune responses and structural alterations in the ectocervical mucosa of depot medroxyprogesterone acetate users

Vilde Kaldhusdal et al. Sci Rep. .

Abstract

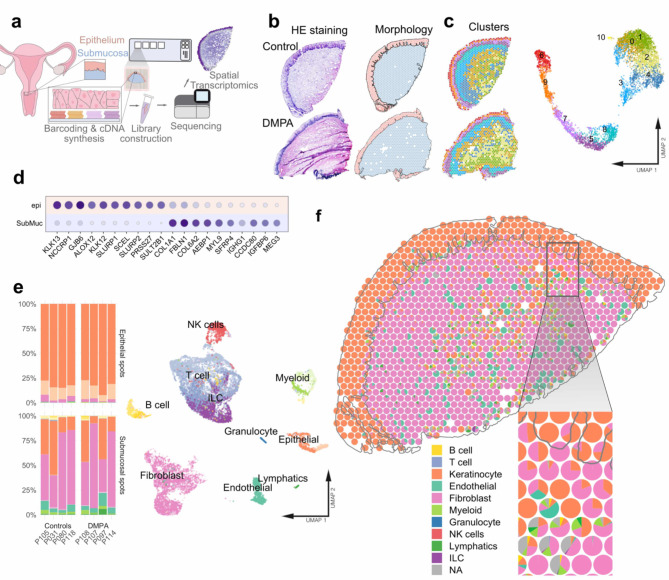
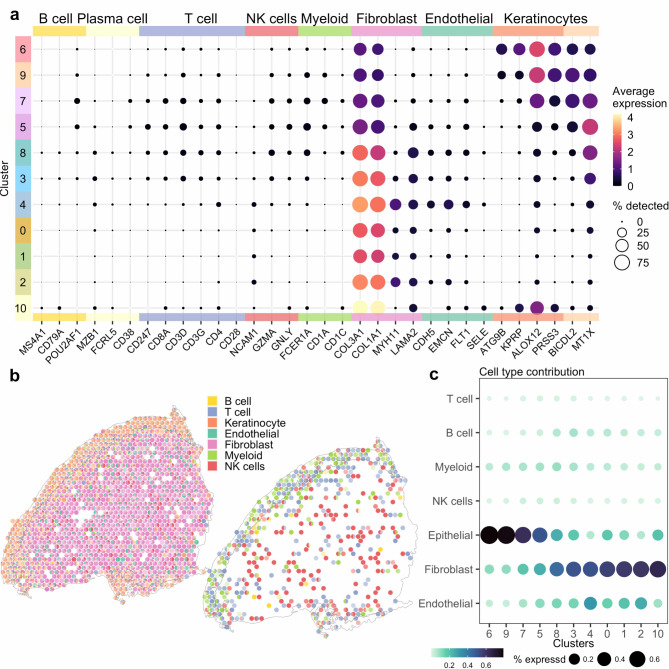
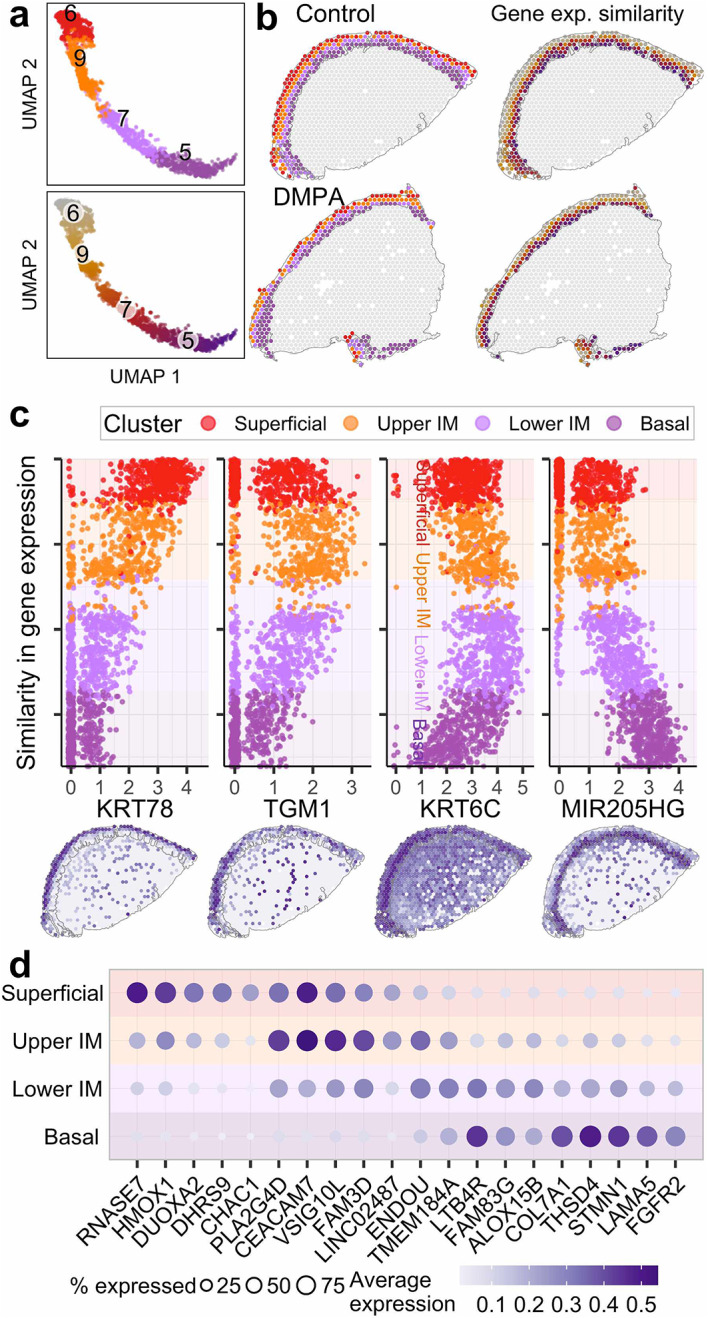
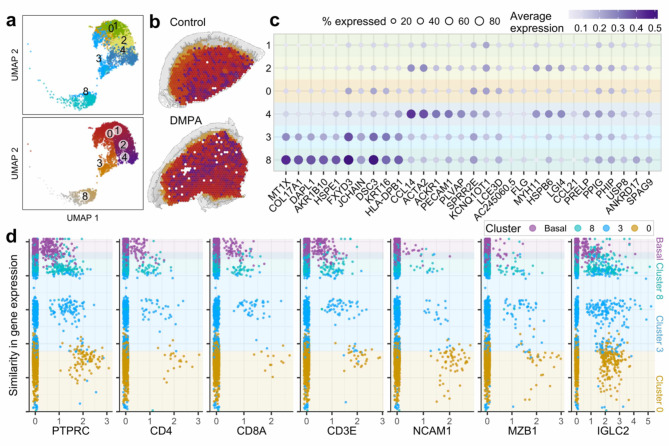
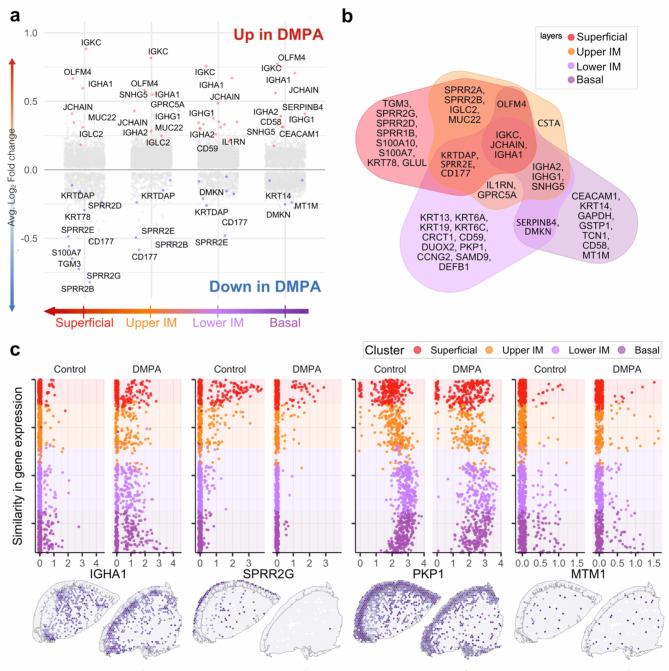
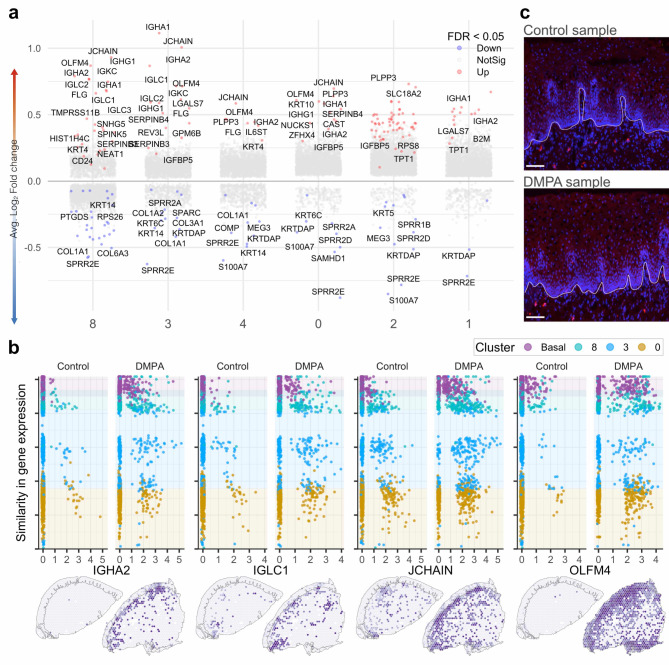
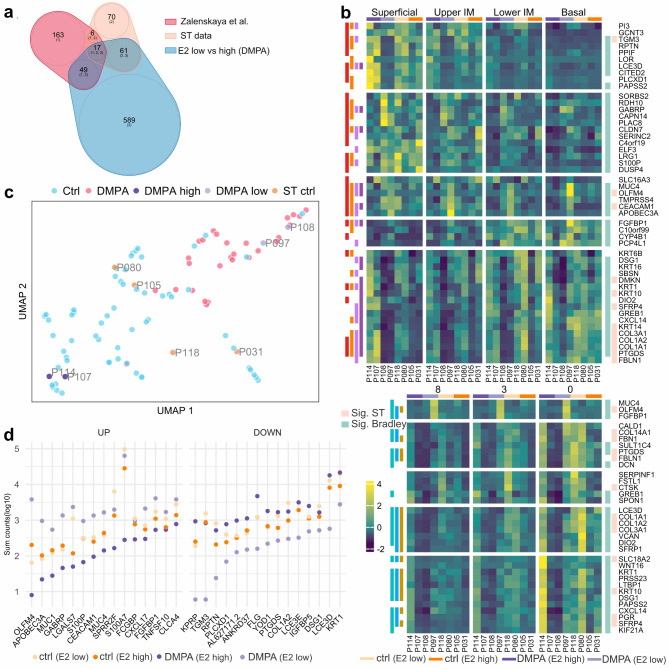
The injectable contraceptive, depot medroxyprogesterone acetate (DMPA), is associated with compromised cervical mucosal barriers. High-resolution spatial transcriptomics is applied here to reveal the spatial localization of these altered molecular markers. Ectocervical tissue samples from Kenyan sex workers using DMPA, or non-hormonal contraceptives, underwent spatial transcriptomics and gene set enrichment analyses. Integrated systemic estradiol levels and bulk tissue gene expression data from a larger cohort enhanced the study's scope. Unsupervised clustering unveiled four epithelial and seven submucosal layers, showcasing spatially restricted and diverse functional epithelial responses, and a less structured submucosal spatial ordering. DMPA associated with mucosal-wide immunoglobulin gene upregulation, verified by CD20+ B-cell immunostaining, and upregulated immune markers adjacent to the basal membrane. Downregulated genes represented spatially restricted disrupted epithelial barrier integrity and submucosal extracellular matrix dysfunction. The transcriptional profile was associated with markers of estrogen regulation. Collectively, our findings reveal estrogen-modulated distinct ectocervical transcriptional profiles associated with DMPA usage. While upregulation of immunoglobulin genes occurs throughout the mucosa, activation of innate immune responses and dysregulation of barrier integrity markers are spatially restricted. These results extend previous analyses using bulk transcriptomics and provide insights into the molecular landscape influenced by DMPA, shedding light on contraceptive effects and health implications.

Keywords: DMPA; Ectocervix; Estrogen; Hypoestrogenemia; Mucosa; Spatial transcriptomics.


Conflict of interest statement

Declarations. Competing interests: The authors declare no competing interests, except for Paulo Czarnewski who currently works at Precisium AI as Chief Executive Officer.

Figures

Fig. 1
Fig. 1
Overview of the study and transcriptional profiles associated with ectocervical morphological structures and cell populations. (a) Eight ectocervical biopsies (controls (n = 4) and DMPA (n = 4)) were cross-sectionally sliced (10 μm) for analysis by spatial transcriptomics (ST). The sections were placed on Visium slides with a spot diameter of 55 and 100 μm distance between spots. After staining with hematoxylin and eosin (HE), images were captioned for each of the sections. Thereafter, the tissue was permeabilized with the enzyme pepsin allowing RNA to be released from the tissue and captured onto probes attached to the ST slide. After library preparation, captured mRNA was sequenced on the Illumina NextSeq 500/550 platform. (b) HE staining and manual annotation of two morphological regions, epithelium (blue) and submucosal (orange) (Pat-ID P118 and P097) (c) Classification by the unsupervised clustering visualized on tissue (left) (Sample-ID P118 and P097) and using Uniform Mani­fold Approximation and Projection (UMAP) (right). A total of 11 clusters (4 epithelial (“epi”) and 7 submucosal (“SubMuc”)) are depicted. (d) Top marker genes across the two morphological structures. (e) Proportion of predicted cell types per sample in the epithelium (top) and submucosa (bottom). (f) Deconvolution results plotted on tissue (Sample-ID P118).
Fig. 2
Fig. 2
Cell populations in the ectocervix (a) Average expression of selected cell marker genes visualized for each of the 11 clusters (cluster 0–10). (b) Relative proportions of marker genes including immune, epithelial, fibroblast and endothelial markers (left) and immune markers only (right) (Sample-Id P097). (c) Estimated cell type contribution per cluster.
Fig. 3
Fig. 3
Gene expression patterns across the ectocervical epithelium (a) Uniform mani­fold approximation and projection (UMAP) of epithelial spots, colored by clustering (top) and the similarity in gene expression/gene expression trajectory (bottom). (b) Clustering (left) and similarity in gene expression (right) plotted on the tissue of control sample P118 and DMPA sample P097. (c) On the y-axis, spots are ordered by similarity in gene expression, resulting in a pseudo measurement (0–20) of distance across the epithelium. The x-axis displays the gene expression for selected marker genes representing the superficial, upper intermediate (IM), lower IM and basal layers of the epithelium, respectively. The same genes highlighted on tissue of control sample P118. (d) Top five marker genes for the four epithelial clusters.
Fig. 4
Fig. 4
Gene expression patterns across the ectocervical submucosa (a) Uniform manifold approximation and projection of submucosal spots, colored by clustering (top) and the similarity in gene expression/gene expression trajectory (bottom). (b) Similarity in gene expression plotted on the tissue of control sample P118 and DMPA sample P097. (c) Top five marker genes for the six submucosal clusters (cluster 10 was excluded from analysis). (d) On the y-axis, spots are ordered by similarity in gene expression, resulting in a pseudo measurement (0–25) of the distance from the basal layer into the submucosa. The x-axis displays the gene expression for selected marker genes representing the basal epithelial layer (purple), cluster 8 (turquoise), cluster 3 (light blue), cluster 0 (mustard).
Fig. 5
Fig. 5
Differentially expressed genes associated with DMPA use across the ectocervical epithelium. (a) Volcano plots of each epithelial cluster on the x-axis and log fold change on the y-axis. (b) Venn diagram of the significant DEGs in the epithelium. (c) The gene expression (x-axis) of selected genes, plotted against the similarity in gene expression/gene trajectory (y-axis), including all samples from the respective study group (top). Gene expression values plotted on tissue slides of control sample P118 and DMPA sample P097 (bottom).
Fig. 6
Fig. 6
Differentially expressed genes associated with DMPA use across the ectocervical submucosa. (a) Volcano plots of each epithelial cluster on the x-axis and log fold change on the y-axis. (b) The gene expression (x-axis) of selected genes, plotted against the similarity in gene expression/gene trajectory (y-axis), including all samples from the respective study group (top). Gene expression values plotted on tissue slides of control sample P118 and DMPA sample P097 (bottom). (c) Immunofluorescent staining of CD20 + B cells (red) in a representative control sample P118 (top) and DMPA sample P097 (bottom). The scale bar is 1000 μm. The apical layer of the epithelial basal membrane is marked in white. Contrast has been enhanced for visualization purposes.
Fig. 7
Fig. 7
Estradiol (E2) low vs. high DEGs analysis and how they relate to bulk transcriptomics data. (a) Venn diagram highlighting the shared DEGs between Zalenskaya et al., and our spatial transcriptomics (ST) data (DMPA vs. controls), and the E2 low vs. E2 high (DMPA samples). (b) Heatmap of ST data showing the average gene expression across epithelial/submucosal clusters for each sample. The selected genes overlap between Zalenskaya et al. and E2 low vs. E2 high significant genes. The vertical lines on the left side of the plot indicate in which epithelial/submucosal layer the DEG reached significance. The vertical lines on the right indicate significance in Bradley et al. (green) and DMPA vs. controls (beige). (c) UMAP of bulk data illustrating how the current study’s samples are positioned within the broader cohort, showing control samples (ST ctrl) in yellow, DMPA (E2 low) in light purple, and DMPA (E2 high) in dark purple. (d) Log-normalized counts of the ST data, summarized across epithelial clusters, showing the top 15 upregulated and downregulated genes in the E2 low vs. E2 high comparisons.

Similar articles

References

    1. United Nation Department of Economic and Social Affairs. 25. Contraceptive use by method 2019: data booklet. Contraception Use by Method (2019).
    1. Butler, A. R. et al. Modelling the global competing risks of a potential interaction between injectable hormonal contraception and HIV risk. AIDS27, 105–113 (2013). - PMC - PubMed
    1. Plummer, F. A. et al. Cofactors in male-female sexual transmission of human immunodeficiency virus type 1. J. Infect. Dis.163, 233–239 (1991). - PubMed
    1. Morrison, C. S. et al. Hormonal contraception and the risk of HIV acquisition: an individual participant data meta-analysis. PLoS Med.12, e1001778 (2015). - PMC - PubMed
    1. Polis, C. B. et al. An updated systematic review of epidemiological evidence on hormonal contraceptive methods and HIV acquisition in women. AIDS30, 2665–2683 (2016). - PMC - PubMed

Publication types

LinkOut - more resources