. 2025 Jan 7;16(1):439.
doi: 10.1038/s41467-024-55788-5.

NPC1 controls TGFBR1 stability in a cholesterol transport-independent manner and promotes hepatocellular carcinoma progression

Affiliations

NPC1 controls TGFBR1 stability in a cholesterol transport-independent manner and promotes hepatocellular carcinoma progression

Shuangyan Li et al. Nat Commun. .

Abstract

Niemann-Pick disease type C protein 1 (NPC1), classically associated with cholesterol transport and viral entry, has an emerging role in cancer biology. Here, we demonstrate that knockout of Npc1 in hepatocytes attenuates hepatocellular carcinoma (HCC) progression in both DEN (diethylnitrosamine)-CCl4 induced and MYC-driven HCC mouse models. Mechanistically, NPC1 significantly promotes HCC progression by modulating the TGF-β pathway, independent of its traditional role in cholesterol transport. We identify that the 692-854 amino acid region of NPC1's transmembrane domain is critical for its interaction with TGF-β receptor type-1 (TGFBR1). This interaction prevents the binding of SMAD7 and SMAD ubiquitylation regulatory factors (SMURFs) to TGFBR1, reducing TGFBR1 ubiquitylation and degradation, thus enhancing its stability. Notably, the NPC1 (P691S) mutant, which is defective in cholesterol transport, still binds TGFBR1, underscoring a cholesterol-independent mechanism. These findings highlight a cholesterol transport-independent mechanism by which NPC1 contributes to the stability of TGFBR1 in HCC and suggest potential therapeutic strategies targeting NPC1 for HCC treatment.


Conflict of interest statement

Competing interests: The authors declare no competing interests.

Figures

Fig. 1
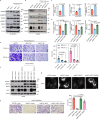
Fig. 1. Up-regulation of NPC1 correlates with poor prognosis of HCC.
ac Upregulation of NPC1 mRNA (a) or protein (b, c) in paired non-tumor tissues (NT) and tumor tissues (T) in TCGA datasets (a) (NT, n = 32; T, n = 375), Jiang et al.’s cohort (b) (NT, n = 98; S-I, n = 36; S-II, n = 32; S-III n = 33) and Gao et al.’s cohort (c) (NT, n = 159; S-Mb, n = 55; S-Me, n = 57; S-Pf, n = 47). di Kaplan–Meier overall survival (d, f, h) and disease-free survival (e, g, i) curves of individuals with high or low NPC1 expression in TCGA datasets (d, e), Jiang et al.’s cohort (f, g) and Gao et al.’s cohort (h, i). j Representative IHC staining of TMA with NPC1 antibodies in an independent cohort of HCC (n = 295 biologically independent samples); scale bars, 100 μm. k Staining intensity of NPC1 between NT and T samples from TMA (n = 295 biologically independent samples). l, m Kaplan–Meier overall survival (l) and disease-free survival (m) curves of individuals with high or low NPC1 expression. In the box plots, the middle bar represents the median, and the box represents the interquartile range; bars extend to 1.5× the interquartile range. Data are presented as the mean ± s.e.m. (a, k). Statistical significance was determined by Mann–Whitney U test (ac, k) or log-rank test (di, l, m). Source data are provided as a Source Data file.
Fig. 2
Fig. 2. NPC1 promotes HCC progression.
a Confirmation of NPC1 overexpression, NPC1 knockdown and re-expression in HCC cells. b-e Transwell assay to examine the effect of NPC1 on HCC cell migration (b, c) or invasion (d, e); scale bars, 100 μm. fi 1×10⁶ Luciferase-expressing HCC cells (MHCC-97H) were injected into NOD SCID mice by tail vein. The mice were euthanized 8 weeks later by a cervical dislocation. Representative images of whole body luminescence monitoring of NOD SCID mice injected via tail vein with HCC cells 8 weeks after injection (f). Lung and liver tissues were isolated for analysis of IVIS imaging (g). Representative H&E staining images of lung tissues are shown; scale bars, 500 μm; insets: fivefold magnification; scale bars, 100 μm (h). The incidence of lung metastasis in mice (i). (n = 8 mice per group). Data are presented as the mean ± s.e.m. n = 3 (be) biologically independent samples (be). Statistical significance was determined by two-tailed unpaired Student’s t-test (be). ae Data were verified in three independent experiments. Source data are provided as a Source Data file.
Fig. 3
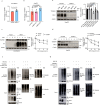
Fig. 3. NPC1 regulates the TGF-β pathway in a cholesterol transport-independent manner.
a, b Immunoblot analysis of TGFBR1, p-SMAD2, p-SMAD3, SMAD2, SMAD3 and NPC1 expression in PLC/PRF/5 cells with NPC1 stable overexpression (a) or HepG2 cells with NPC1 stable knockdown (b). c, d qPCR (n =  3 biological replicates) was used to examine the mRNA level of TGF-β target genes in NPC1-overexpression PLC/PRF/5 cells (c) or in NPC1-knockdown HepG2 cells with/without further overexpression of NPC1 (d). e Transwell assay was performed in NPC1-knockdown HepG2 cells with or without TGF-β1 (10 ng/mL) treatment; scale bars, 100 μm. f Immunoblot analysis of TGFBR1, p-SMAD2, SMAD2, and NPC1 expression in NPC1-knockdown HepG2 cells with further overexpression of NPC1 or NPC1 (P691S). g Cells related to (f) were fixed and stained with filipin to label free cholesterol accumulated in LE/Ly; scale bars, 10 μm. h Transwell assay was performed in cells related to (f); scale bars, 100 μm. Data are presented as the mean ± s.e.m. n = 3 (c, d, e, h) biologically independent samples. Statistical significance was determined by two-tailed unpaired Student’s t-test (c, d, e, h). All experimental data were verified in three independent experiments. Source data are provided as a Source Data file.
Fig. 4
Fig. 4. NPC1 increases protein stability of TGFBR1 and inhibits its ubiquitination.
a, b qPCR analysis of NPC1 and TGFBR1 mRNA levels in NPC1-overexpression PLC/PRF/5 (a) or NPC1-knockdown HepG2 (b) cells. c, d PLC/PRF/5 cells with/without stable overexpression of NPC1 (c) or HepG2 cells with/without stable knockdown of NPC1 (d) were treated with CHX for indicated times and then analyzed by western blot. e HepG2 cells with or without stable knockdown of NPC1 were treated with vehicle, MG132 (10 μM), or NH4Cl (10 mM) for 12 hours. Cell lysates were subjected to immunoblot with TGFBR1 or NPC1 antibody. f, g TGFBR1-mCherry-His stable overexpression PLC/PRF/5 (f) and HepG2 (g) cells with or without NPC1 overexpression (f) or knockdown (g) were pretreated with MG132 (10 μM) for 8 hours before collection. Then TGFBR1-mCherry-His was pulled down by Ni-NTA and immunoblotted with anti-K48-Ubiquitin, anti-K63-Ubiquitin and anti-Ubiquitin antibody. Data are presented as the mean ± s.e.m. n = 3 (ae) biologically independent samples. Statistical significance was determined by two-tailed unpaired Student’s t-test (a, b, e) or two-way analysis of variance (ANOVA) (c, d). All experimental data were verified in three independent experiments. Source data are provided as a Source Data file.
Fig. 5
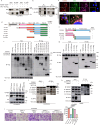
Fig. 5. NPC1 interacts with TGFBR1 and inhibits the binding of TGFBR1 with SMAD7/SMURFs.
a The lysates of PLC/PRF/5 transfected with indicated constructs were subjected to immunoprecipitation with anti-Flag (or GFP) antibody. The immunoprecipitates were then immunoblotted with anti-GFP (or Flag) antibody. b PLC/PRF/5 and HepG2 cell lysates were subjected to immunoprecipitation with control IgG or anti-NPC1 antibodies. c PLC/PRF/5 cells stably overexpressing TGFBR1-mCherry-His and NPC1-HA were immunostained with antibodies against HA and LAMP1 to determine the colocalization among TGFBR1, NPC1 and LAMP1 in PLC/PRF/5 cells. Representative images from three independent experiments are shown; scale bars, 10 µm. d, e A schematic representation of NPC1 (d) or TGFBR1 (e) WT and deletion mutants. f PLC/PRF/5 cells stably overexpressing TGFBR1-mCherry-His were transfected with various plasmids encoding NPC1-His-Flag or NPC1 deletion mutants as indicated. Cell lysates were subjected to immunoprecipitation with anti-Flag magnetic beads and immunoblot with mCherry or Flag antibody. g PLC/PRF/5 cells were transfected with various combinations of plasmids encoding NPC1-His-Flag and TGFBR1-Myc or TGFBR1 deletion mutants as indicated. Cell lysates were subjected to immunoprecipitation with anti-Myc magnetic beads and immunoblot with Flag or Myc antibody. h Immunoblot analysis of TGFBR1 and NPC1 expression in NPC1-knockdown PLC/PRF/5 cells with further overexpression of NPC1, NPC1 (P691S), or NPC1 (Δ692-854). i Transwell assay was performed in cells related to (h); scale bars, 100 μm. j, k TGFBR1-mCherry-His stable overexpression PLC/PRF/5 (j) and HepG2 (k) cells with or without NPC1 overexpression (j) or knockdown (k) were subjected to immunoprecipitation with anti-His antibody. The lysates and immunoprecipitates were then blotted. Data are presented as the mean ± s.e.m. n = 3 (i) biologically independent samples. Statistical significance was determined by two-tailed unpaired Student’s t-test (i). All experimental data were verified in three independent experiments. Source data are provided as a Source Data file.
Fig. 6
Fig. 6. TGFBR1 is crucial for NPC1-mediated promotion of HCC progression.
a Representative images from IHC staining of NPC1 and TGFBR1 in HCC tissues (n = 286 biologically independent samples); scale bars, 50 µm. b The Pearson correlation analysis between NPC1 level and TGFBR1 level in HCC tissues. c The analysis of TGFBR1 IHC score in HCC tissues with low (n = 174 biologically independent samples) or high (n = 112 biologically independent samples) NPC1 level. d Representative images from Immunofluorescence staining of NPC1 and TGFBR1 in HCC tissues (n = 10 biologically independent samples); scale bars, 20 µm. e The Pearson correlation analysis between NPC1 positive area and TGFBR1 positive area in HCC tissues (n = 50 regions). These multiplexed IF staining were performed on ten HCC tissue sections from HCC patients, qualifying an average of five regions per sample. f The analysis of the percentages of TGFBR1 positive area in HCC tissues with low (n = 13 regions) or high (n = 37 regions) NPC1 level. g Immunoblot analysis of TGFBR1 and NPC1 expression in NPC1-overexpression PLC/PRF/5 cells with or without TGFBR1 inhibitor LY2157299 (10 μM) treatment. h Transwell assay was performed in cells related to (g); scale bars, 100 μm. i-l 1×10⁶ Luciferase-expressing HCC cells (MHCC-97H) were injected into NOD SCID mice by tail vein. The mice were euthanized 8 weeks later by a cervical dislocation. Representative images of whole body luminescence monitoring of NOD SCID mice injected via tail vein with HCC cells 8 weeks after injection (i). Lung and liver tissues were isolated for analysis of IVIS imaging (j). Representative H&E staining images of lung tissues are shown; scale bars, 500 μm; insets: fivefold magnification; scale bars, 100 μm (k). The incidence of lung metastasis in mice (l) (n = 6 mice per group). Data are presented as the mean ± s.e.m. n = 3 (h) biologically independent samples. In the box plots, the middle bar represents the median, and the box represents the interquartile range; bars extend to 1.5× the interquartile range. Statistical significance was determined by two-sided Pearson correlation test (b, e), two-sided Mann–Whitney U test (c, f) or two-tailed unpaired Student’s t-test (h). g, h Data were verified in three independent experiments. Source data are provided as a Source Data file.
Fig. 7
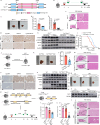
Fig. 7. Hepatic NPC1 deficiency inhibits HCC tumorigenesis and progression and TGF-β pathway.
a Construction of Npc1-conditional knockout (CreAlbNpc1F/F) mice. b, Npc1F/F and CreAlbNpc1F/F mice were treated with DEN followed by twenty injections of CCl4 to construct HCC mouse model. c Representative images of Npc1F/F and CreAlbNpc1F/F mouse livers with HCC. d, e liver to body weight ratio (n = 8 mice) (d) numbers of nodules per liver (n = 21 mice in Npc1F/F and n = 13 mice in CreAlbNpc1F/F groups) (e) of the indicated mice. f, g Representative H&E staining images (f), Representative IHC staining images of EpCAM, GPR78 and Cytokeratin19 (g) of the indicated mouse livers. H&E staining scale bars: left panels, 2.5 mm; right panels, 500 μm. IHC staining scale bars, 50 μm. h TGFBR1, p-SMAD2, SMAD2, and NPC1 protein expression in the indicated mouse non-tumor and tumor tissues. i Kaplan–Meier survival curves for Npc1F/F (n = 35) or CreAlbNpc1F/F (n = 23). j Scheme used to establish the model of spontaneous HCC with targeted Myc knock-in and Npc1 knockout in the liver. k Representative images of CreAlbMyc and CreAlbNpc1F/FMyc mouse livers with HCC. l liver to body weight ratio (n = 5) in the indicated mice. m, n Representative H&E staining images (m), Representative IHC staining images of EpCAM, GPR78 and Cytokeratin19 (n) of the indicated mouse livers. H&E staining scale bars: left panels, 2.5 mm; right panels, 500 μm. IHC staining scale bars, 50 μm. o TGFBR1, p-SMAD2, SMAD2, and NPC1 protein expression in WT, CreAlbMyc and CreAlbNpc1F/FMyc mouse liver tissues. p Schematic diagram of tamoxifen-induced liver-specific Npc1 knockout mouse generation and the treatment plan in the DEN-CCl4-induced HCC model. q Representative liver images of the indicated group. r, s liver to body weight ratio (r), numbers of nodules per liver (s) of Npc1F/F mice treated with coil (CO) (n = 5), CreERT2AlbNpc1F/F mice treated with coil or tamoxifen (TAM) (n = 8). t Representative H&E staining images of the indicated mouse livers. Scale bars: left panels, 2.5 mm; right panels, 500 μm. u NPC1 protein expression in the indicated mouse tissues. Data are presented as means ± s.e.m. Statistical significance was determined by two-tailed unpaired Student’s t-test (d, e, l, r, s) or log-rank test (i). These experiments (f, g, h, mo, t, u) were repeated three times independently with similar results. Source data are provided as a Source Data file.
Fig. 8
Fig. 8. Schematic representation of the proposed mechanism by which NPC1 modulates the TGF-β pathway in HCC cells.
NPC1 interacts with TGFBR1, preventing the binding of SMAD7 and SMURFs to TGFBR1. This interaction reduces TGFBR1 ubiquitylation and degradation, enhancing its stability and promoting TGF-β pathway activation in HCC cells.

References

    1. Llovet, J. M. et al. Hepatocellular carcinoma. Nat. Rev. Dis. Prim.7, 6 (2021). - PubMed
    1. Villanueva, A. Hepatocellular carcinoma. Reply. N. Engl. J. Med381, e2 (2019). - PubMed
    1. Vogel, A., Meyer, T., Sapisochin, G., Salem, R. & Saborowski, A. Hepatocellular carcinoma. Lancet400, 1345–1362 (2022). - PubMed
    1. Rumgay, H. et al. Global burden of primary liver cancer in 2020 and predictions to 2040. J. Hepatol.77, 1598–1606 (2022). - PMC - PubMed
    1. Sung, H. et al. Global cancer statistics 2020: GLOBOCAN estimates of incidence and mortality worldwide for 36 cancers in 185 countries. CA Cancer J. Clin.71, 209–249 (2021). - PubMed

MeSH terms