. 2025 Jan 6;15(1):887.
doi: 10.1038/s41598-025-85121-z.

Interpretable machine learning for predicting sepsis risk in emergency triage patients

Affiliations

Interpretable machine learning for predicting sepsis risk in emergency triage patients

Zheng Liu et al. Sci Rep. .

Abstract

The study aimed to develop and validate a sepsis prediction model using structured electronic medical records (sEMR) and machine learning (ML) methods in emergency triage. The goal was to enhance early sepsis screening by integrating comprehensive triage information beyond vital signs. This retrospective cohort study utilized data from the MIMIC-IV database. Two models were developed: Model 1 based on vital signs alone, and Model 2 incorporating vital signs, demographic characteristics, medical history, and chief complaints. Eight ML algorithms were employed, and model performance was evaluated using metrics such as AUC, F1 Score, and calibration curves. SHapley Additive exPlanations (SHAP) and Local Interpretable Model-agnostic Explanations (LIME) methods were used to enhance model interpretability. The study included 189,617 patients, with 5.95% diagnosed with sepsis. Model 2 consistently outperformed Model 1 across most algorithms. In Model 2, Gradient Boosting achieved the highest AUC of 0.83, followed by Extra Tree, Random Forest, and Support Vector Machine (all 0.82). The SHAP method provided more comprehensible explanations for the Gradient Boosting algorithm. Modeling with comprehensive triage information using sEMR and ML methods was more effective in predicting sepsis at triage compared to using vital signs alone. Interpretable ML enhanced model transparency and provided sepsis prediction probabilities, offering a feasible approach for early sepsis screening and aiding healthcare professionals in making informed decisions during the triage process.

Keywords: Emergency; Interpretable machine learning; Sepsis; Triage; Warning mode.


Conflict of interest statement

Declarations. Competing interests: The authors declare no competing interests. Ethics declarations: The data for this study came from a public database. The study design was approved by the appropriate ethics review board. Informed consent was not necessary because the database used was anonymized.

Figures

Fig. 1
Fig. 1
Flow Chart. MIMIC Medical Information Mart for Intensive Care, SBP systolic blood pressure, DBP diastolic blood pressure, o2sat oxygen saturation, AUC area under the receiver operating characteristic curve, AUC-PR area under the precision-recall curve, PPV positive predictive value, NPV negative predictive value, SHAP SHapley Additive exPlanations, LIME Local Interpretable Model-agnostic Explanations.
Fig. 2
Fig. 2
Comparison of ROC Curves of Different Algorithms on Two Models. (a) Logistic Regression; (b) Decision Tree; (c) Extra Tree; (d) Gradient Boosting; (e) k-Nearest Neighbor: (f) Naive Bayes; (g) Random Forest; (h) Support Vector Machine. ROC receiver operating characteristic curve, AUC area under the receiver operating characteristic curve.
Fig. 3
Fig. 3
Calibration Curves and Decision Curve Analysis Curves for the Four Best-Performing Algorithms in Model 2. (a) Calibration Curves; (b) Decision Curve Analysis Curves; SVM Support Vector Machine.
Fig. 4
Fig. 4
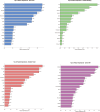
Feature Importance of Four Algorithms in Model 2.
Fig. 5
Fig. 5
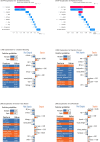
Interpretation of Four Algorithms in Model 2. SHAP SHapley Additive exPlanations, LIME Local Interpretable Model-agnostic Explanations. In the SHAP method, f (X) represented the final prediction result, which equaled the baseline value E [f (X)] plus the sum of all variable SHAP values. The SHAP values quantified the quantity and direction of each variable’s influence on predicting the outcome. Blue and red respectively represented decreases or increases in risk, with longer arrows indicating greater effects. The baseline value E [f (X)] was equivalent to the average risk in the dataset. The LIME method provided the overall prediction probability of the model and the prediction weight for each variable. Orange indicated an increase in risk, while blue indicated a decrease in risk.

Similar articles

Cited by

References

    1. Yealy, D. M. et al. Early care of adults with suspected sepsis in the emergency department and out-of-hospital environment: A consensus-based task force report. Ann. Emerg. Med.78, 1–19. 10.1016/j.annemergmed.2021.02.006 (2021). - PubMed
    1. Rhodes, A. et al. Surviving sepsis campaign: International guidelines for management of sepsis and septic shock: 2016. Intensive Care Med.43, 304–377. 10.1007/s00134-017-4683-6 (2017). - PubMed
    1. Kalich, B. A. et al. Impact of an antibiotic-specific sepsis bundle on appropriate and timely antibiotic administration for severe sepsis in the emergency department. J. Emerg. Med.50, 79-88.e71. 10.1016/j.jemermed.2015.09.007 (2016). - PubMed
    1. Levy, M. M., Evans, L. E. & Rhodes, A. The Surviving Sepsis Campaign Bundle: 2018 update. Intensive Care Med.44, 925–928. 10.1007/s00134-018-5085-0 (2018). - PubMed
    1. Wang, H. E., Jones, A. R. & Donnelly, J. P. Revised national estimates of emergency department visits for sepsis in the United States. Crit. Care Med.45, 1443–1449. 10.1097/ccm.0000000000002538 (2017). - PMC - PubMed

Publication types