Clinical Trial
. 2025 Jan;31(1):105-115.
doi: 10.1038/s41591-024-03361-4. Epub 2025 Jan 6.

Selumetinib in adults with NF1 and inoperable plexiform neurofibroma: a phase 2 trial

Affiliations
Clinical Trial

Selumetinib in adults with NF1 and inoperable plexiform neurofibroma: a phase 2 trial

Andrea M Gross et al. Nat Med. 2025 Jan.

Abstract

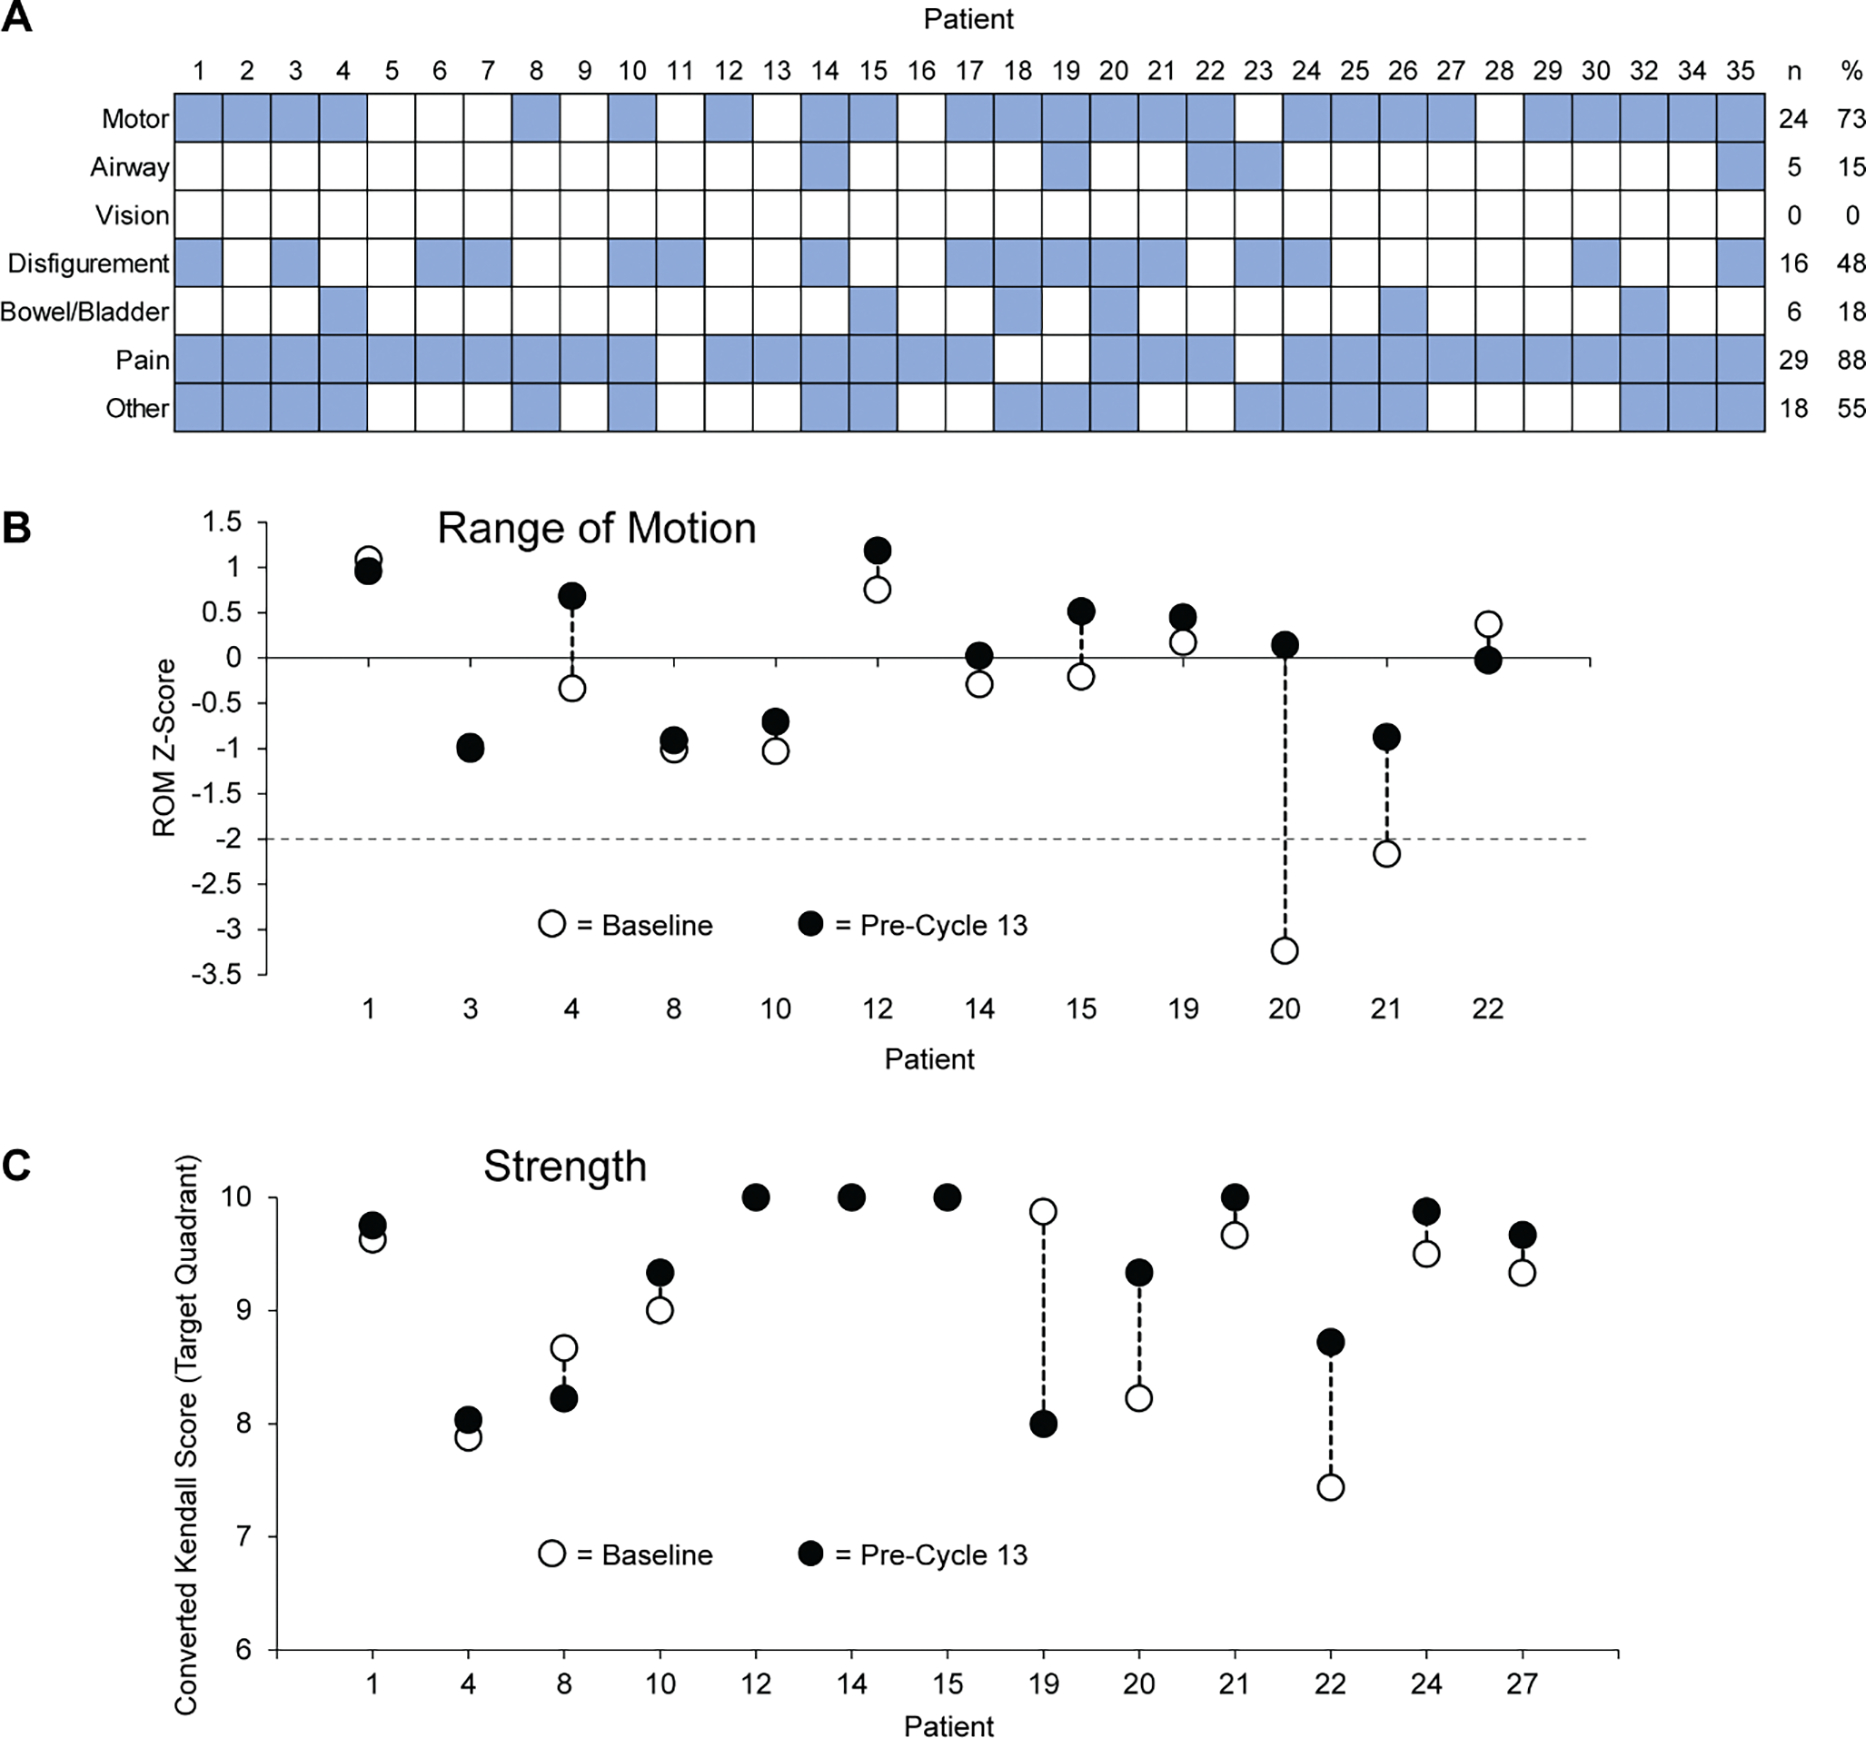
The MEK inhibitor selumetinib induces objective responses and provides clinical benefit in children with neurofibromatosis type 1 (NF1) and inoperable plexiform neurofibromas (PNs). To evaluate whether similar outcomes were possible in adult patients, in whom PN growth is generally slower than in pediatric patients, we conducted an open-label phase 2 study of selumetinib in adults with NF1 PNs. The study was designed to evaluate objective response rate (primary objective), tumor volumetric responses, patient-reported outcomes and pharmacodynamic effects in PN biopsies. The objective response rate was 63.6% (21/33 participants). Median maximal PN volume decrease was 23.6% (range: -48.1% to 5.5%). No disease progression relative to baseline PN volumes occurred before data cutoff, with a median of 28 cycles completed (range: 1-78, 28 d per cycle). Participants experienced decreased tumor pain intensity and pain interference. Adverse events (AEs) were similar to those of the pediatric trial; acneiform rash was the most prevalent AE. Phosphorylation ratios of ERK1/2 decreased significantly (ERK1 median change: -64.6% (range: -99.5% to 90.7%), ERK2 median change: -57.3% (range: -99.9% to 84.4%)) in paired PN biopsies (P ≤ 0.001 for both isoforms) without compensatory phosphorylation of AKT1/2/3. The sustained PN volume decreases, associated improvement in pain and manageable AE profile indicate that selumetinib provides benefit to adults with NF1 and inoperable PNs. ClinicalTrials.gov identifier: NCT02407405 .


Conflict of interest statement

Competing interests: The authors declare no competing interests.

Figures

Extended Data Figure 1:
Signaling pathway overview. Inactive Ras-GDP can release GDP and become activated by binding GTP. Ras-GTP activates signaling via the RAF/MEK/ERK and PI3K pathways. Neurofibromin functions as a negative regulator of this signaling by maintaining the inactive Ras-GDP. When neurofibromin is mutated (i.e., in patients with neurofibromatosis), that regulation of the RAF and PI3K pathways is lost. Selumetinib does not inhibit MEK phosphorylation. When MEK is inhibited by selumetinib, phosphorylation of its enzymatic substrate ERK is inhibited. Phosphorylation of rpS6 can still be achieved via PI3K/AKT/mTOR despite MEK inhibition by selumetinib. Other factors involved in these pathways and other pathways regulated by Ras have been omitted for clarity.
Extended Data Figure 2:
(A) PN-related morbidities present during baseline evaluation are presented by category. Comorbidities present during baseline evaluation (blue squares) were assigned to one of 7 categories. Several participants had more than one morbidity in the “Other” category; those morbidities included sensory deficit (n=14), abnormal gait (n=2), hearing loss (n=2), facial dysfunction (n=1), inability to carry pregnancy to term (n=1), kyphosis (n=1), leg asymmetry (n=1), nocturia (n=1), post-surgery neurogenic bladder (n=1), pes cavus (n=1), and sexual dysfunction (n=1). (B) Z-score change from baseline to pre-cycle 13 evaluations demonstrates that 2 participants (20 and 21) had significant ROM impairment at baseline (Z-score <−2) that was no longer significant at the later timepoint; no participants experienced significant ROM worsening by this evaluation. (C) While some participants (20 and 22) demonstrated modest improvement, no statistically significant change in converted Kendall Score as measured.
Extended Data Figure 3:
(A) Spider plot showing tumor volume change from baseline for each participant through DCO. Percent tumor volume changes for each participant at each re-staging scan are shown using unique combinations of marker shape and color for each participant as indicated. Participants 31 and 33 did not meet screening criteria and participants 5 and 18 came off study prior to their first re-staging scans; no data are available for these participants. Participant 1 (black circles) continues to experience sPR after 78 cycles (approximately 6 years on study, PR lasting ≥48 cycles). Participant 14 (gray squares) achieved the greatest reduction in tumor volume (48.1%). Participant 7 (blue triangles) had a prolonged drug hold prior to cycle 66 and their data are censored at the time of this hold; they resumed treatment and remain on study at DCO. (B) Participant 14 (gray squares in part A) had archival images available from participation in the NIH natural history study. MRI images are shown from the prior study at age 15.5 years (left image), at the time of enrollment on this study (age 21.6 years, center image), and at the last re-staging prior to DCO (age 25.6 years, right image). Tumor volumes are graphed versus age during both studies with the natural history study indicated as a black line and the current study as a red line.
Extended Data Figure 4:
Plasma concentrations and percent changes in total analyte levels and phosphorylation ratios as a function of time since last dose. (A) Plasma concentrations tended to decrease as sampling time progressed further from the time of the last dose. Colors and shapes of data markers indicate individual participants and correspond to the markers used to indicate tumor volume in Extended Data Figure 3. Not all participants had blood collected for PK analysis and only those from whom samples were collected are indicated in the legend. (B) Total MEK1 (blue) and MEK2 (orange) remained near or above baseline across most time points. (C) Mean phosphorylated:total MEK1 (blue) and MEK2 (orange) ratios increased with selumetinib treatment, but neither achieved statistical significance across all quantifiable paired biopsies (P=0.153 and 0.137, respectively). (D) No significant changes were measured in total ERK1 (blue) or ERK2 (orange) concentrations. (E) ERK1 (blue) and ERK2 (orange) phosphorylation ratios were consistently suppressed from approximately 2 to 12 hours after dosing (P=0.0003 and 0.0002 for ERK1 and ERK2, respectively, for all quantifiable paired biopsies).
Extended Data Figure 5:
Isoform-specific total MEK, ERK, AKT, and rpS6 levels. Total protein levels from all quantifiable pre-treatment biopsies (n values indicated in figure) are shown regardless of whether paired biopsies were available or quantifiable. Black bars indicate mean values and error bars indicate 95% confidence intervals. (A) Total MEK1 was significantly more abundant than MEK2 (P=0.0006); total ERK2 was not significantly different from total ERK1 (P=0.414). P-values were calculated using ordinary one-way ANOVA analyses and Šidák’s multiple comparisons test. (B) Total AKT1 and AKT2 were not significantly different from each other (P=0.888), while total AKT3 was significantly more abundant than either AKT1 or AKT2 (P=0.0009 and 0.0001, respectively). P-values were calculated using ordinary one-way ANOVA and Sidák’s multiple comparisons test; F values were 8.046 for the MEK/ERK analysis and 11.07 for the AKT1/2/3 analysis. (* = P<0.05, ** = P<0.01, *** = P<0.001)
Extended Data Figure 6:
Comparison of isoform-specific total AKT and site-specific phosphorylated:total analyte ratios. Total levels of AKT1, −2, and −3 (panels A, B, and C, respectively) were normalized to total protein levels in tumor lysates. Phosphorylation ratios for each isoform at the phospho-T site (panels D, E, and F) and the phospho-S site (panels G, H, and I) are shown as the ratio of phosphorylated to total analyte. Pre-treatment (i.e., baseline) and on-treatment (prior to cycle 2 or cycle 3) values are indicated as black diamonds; lines connect paired pre- and on-treatment data points for each biopsy pair. The differences between pre- and on-treatment values are shown as blue diamonds. Error bars represent mean values with 95% confidence intervals. Samples sizes (i.e., n values) indicate the number of biopsy pairs for which quantifiable data were collected for each analyte in both pre-treatment and on-treatment biopsies. P-values were determined using two-tailed paired t-tests. Total AKT3 decreased significantly from the pre-treatment to on-treatment biopsies (P=0.0034). No significant changes were measured in phosphorylation ratios at the phospho-T and phospho-S sites for AKT1 (panels D and G), AKT2 (panels E and H), and AKT3 (panels F and I). The number of paired biopsies that yielded quantifiable data for AKT1 was limited due to low total and phosphorylated analyte levels. (* = P<0.05, ** = P<0.01, *** = P<0.001)
Extended Data Figure 7:
Total rpS6 (A) and phosphorylated:total ratios for the Ser235 and Ser240/244 phosphorylation sites (B and C, respectively). Samples sizes (i.e., n values) indicate the number of biopsy pairs for which quantifiable data were collected for each analyte in both pre-treatment and on-treatment biopsies. Error bars represent mean values with 95% confidence intervals. P-values were determined using two-tailed paired t-tests. No significant changes in total rpS6 or phosphorylation ratio were measured. (* = P<0.05, ** = P<0.01, *** = P<0.001)
Extended Data Figure 8:
H&E, CD68, vimentin, and alpha-smooth muscle actin (α-SMA) staining of pre- and on-treatment biopsies. (A) Representative H&E demonstrated stable histologic findings between baseline and on-treatment samples and anti-CD68 staining images from participants 8 and 21 demonstrated diminished CD68+ cells, likely macrophages, in the on-treatment samples, consistent with the RNA-Seq result. A total of 16 biopsy pairs were analyzed. (B) Representative anti-vimentin (yellow) and anti-α-SMA (green) staining images from participants 6 and 9 demonstrated increased vimentin+ cells, likely fibroblasts, in the on-treatment samples, consistent with RNA-Seq data. A total of 6 biopsy pairs were analyzed.
Figure 1:
Figure 1:
CONSORT-style flow diagram. Left column: Four participants were screened but did not enroll in the study; reasons for not enrolling included lack of growing tumor or PN-related co-morbidity (n=2), baseline ophthalmologic condition (n=1), and clinical judgement of the investigator (n=1). All 33 participants who were eligible received at least one dose of selumetinib and were considered evaluable for toxicity. Two participants came off study before the first re-staging scan prior to cycle 5. All 33 evaluable participants completed patient-reported outcome measures at baseline, although only 31 completed them prior to cycle 5, 30 prior to cycle 9, and 28 prior to cycle 13. These numbers reflect that some participants came off study between each PRO assessment. Of the 24 participants from whom biopsy pairs were collected, multiple biopsy pairs were collected from several participants (i.e., a biopsy pair each from a target and non-target lesion) and other participants only had biopsies collected from non-target lesions. Right column: A total of 26 paired core biopsies were collected. All available biopsy tissue from some participants was used for pMEK/pERK analysis; RNA-Seq and kinome analyses could only be performed on remaining biopsy cores and therefore had fewer paired biopsies analyzed.
Figure 2:
Figure 2:
Best responses, numbers of cycles completed, and PFS. (A) Target lesion volume change from baseline is shown at time of best response. The dashed line indicates the threshold for partial response. Bar colors indicate disease progression status at baseline for each participant. (B) The numbers of cycles completed by each participant at DCO are shown. Arrows indicate that a participant remains on study at DCO. White circles denote times of initial partial response, orange circles denote times of best response, and split white/orange circles denote instances where initial partial response and best response occurred simultaneously. Bars are colored based on selumetinib dose as indicated. Participants 1 and 2 initiated selumetinib treatment at 75 mg BID and were reduced to 50 mg BID after developing grade 3 acneiform rashes during cycle 1; the protocol was amended such that 50 mg BID was the initial dose for all subsequent participants. (C) PFS was calculated per protocol based on the proportion of participants whose tumor volumes increased at least 20% above baseline values (black line); PFS after 60 cycles (4.6 years) was 100%. The previously published pediatric trial of selumetinib for the treatment of PNs (SPRINT) defined progression as tumor growth of at least 20% above tumor volume at the time of best response. Using that definition of progression, PFS after 60 cycles was 72.9% (2-sided 95% CI 52.7–100%) in this study (red line). The two definitions of PFS led to differing numbers of participants at risk at several time points; the numbers of participants at risk are indicated below the x-axis and color-coded according to their respective curves.
Figure 3:
Figure 3:
Patient-reported outcome measures. Participants completed the Numeric Rating Scale-11 (A) and Pain Interference Index (B) at baseline (n=32), then prior to cycles 5 (n=30), 9 (n=30), and 13 (n=28); Global Impression of Change (C) assessments were completed prior to cycles 5, 9, and 13. NRS-11 and PII data were analyzed by two-sided repeated measures ANOVA (NRS-11: F=8.690, P<0.001; PII: F=8.645, P<0.001). (A) NRS-11 rating decreased significantly from baseline prior to cycles 9 and 13 (P=0.013 and 0.002, respectively). (B) Pain Interference Index decreased significantly from baseline prior to cycles 5, 9, and 13 (P=0.006, 0.027, and 0.002, respectively). No other individual contrasts between timepoints were statistically significant. (C) The Global Impression of Change assessment indicated that tumor pain was minimally improved or better in 82.1% of participants (23 of 28 participants) prior to cycle 13. No participants reported that tumor pain was very much worse at any time point. Error bars indicate mean values ± standard deviations. * P<0.05, ** P<0.01.
Figure 4:
Figure 4:
Changes in total analyte and phosphorylation ratios of MEK1, MEK2, ERK1, and ERK2 isoforms. Total MEK1, MEK2, ERK1, and ERK2 levels were normalized to total protein levels in tumor lysates (panels A, C, E, and G, respectively). Phosphorylation ratios of each isoform (pSer218/222-MEK1, pSer222/226-MEK2, pThr202/Tyr204-ERK1, or pThr185/Tyr187-ERK2) are shown as the ratio of phosphorylated to total analyte (panels B, D, F, and H). Pre-treatment (i.e., baseline) and on-treatment (prior to cycle 2 or cycle 3) values are indicated as filled black diamonds; unfilled black diamonds indicate that values were outside the range of the assay’s standard curve and were extrapolated. Lines connect paired pre- and on-treatment data points for each biopsy pair. The differences between pre- and on-treatment values are shown as blue diamonds. Error bars represent 95% confidence intervals. Samples sizes (i.e., n values) indicate the number of biopsy pairs for which quantifiable data were collected for each analyte in both pre-treatment and on-treatment biopsies. Error bars represent mean values with 95% confidence intervals. P-values were determined using two-tailed paired t-tests. No significant changes in expression level were measured for any isoform. Apparent increases in phosphorylation ratios of MEK1 and MEK2 were not statistically significant (P=0.153 and 0.137, respectively, panels B and D), while phosphorylation ratios of both ERK1 and ERK2 decreased significantly (P=0.0005 and 0.0002, respectively, panels F and H).
Figure 5:
Figure 5:
Kinome and RNA-Seq analyses of tumor biopsies. (A) Kinase log2 LFQ intensities were analyzed using two-sample, unpaired student’s t-test. The most significant change in MIB binding was measured for MEK2. The log2 fold change for MEK1 MIB binding did not decrease significantly. (B) Kinase-specific changes in MIB binding varied between participants. The 20 kinases with the largest sum MIB binding differences are shown. Participant-specific components of each kinase’s sum are color coded as indicated. (C) Correlation between MEK2 expression and tumor volume. MIB binding values for all kinases from paired biopsy samples (n=13) were used for analysis with tumor volumetric measurements using the arsenal package in R. Baseline and pre-cycle 5 tumor volumes were used, while MIB binding values were obtained from biopsies collected at baseline and at either pre-cycle 2 or pre-cycle 3. The correlation between log2 fold change MIB binding of MEK2 and the percent change in tumor volume from baseline to pre-cycle 5 was determined to be significant using Pearson’s correlation coefficient. (* = P<0.05, ** = P<0.01, *** = P<0.001) (D) Ras pathway genes are significantly downregulated in paired PN biopsies after 1 or 2 cycles of selumetinib treatment. Center lines indicate median GSVA scores, box limits indicate the 25th and 75th percentiles as determined by R software, whiskers extend 1.5-times the interquartile range (25th to 75th percentiles). Significance was determined using two-sided paired t-tests (***: P=0.001). (E) Contractions of the macrophage populations were measured in these biopsies, while the fibroblast populations expanded

References

    1. Ferrari A, et al. Non-metastatic unresected paediatric non-rhabdomyosarcoma soft tissue sarcomas: results of a pooled analysis from United States and European groups. Eur J Cancer 47, 724–731 (2011). - PMC - PubMed
    1. Gross AM, et al. Association of plexiform neurofibroma volume changes and development of clinical morbidities in neurofibromatosis 1. Neuro Oncol 20, 1643–1651 (2018). - PMC - PubMed
    1. Kershner LJ, et al. Multiple Nf1 Schwann cell populations reprogram the plexiform neurofibroma tumor microenvironment. JCI Insight 7(2022). - PMC - PubMed
    1. Nguyen R, Kluwe L, Fuensterer C, Kentsch M, Friedrich RE & Mautner VF Plexiform neurofibromas in children with neurofibromatosis type 1: frequency and associated clinical deficits. J Pediatr 159, 652–655 e652 (2011). - PubMed
    1. Canavese F & Krajbich JI Resection of plexiform neurofibromas in children with neurofibromatosis type 1. J Pediatr Orthop 31, 303–311 (2011). - PubMed

Publication types

Associated data