. 2025 Feb;31(2):552-564.
doi: 10.1038/s41591-024-03345-4. Epub 2025 Jan 6.

Burdens of type 2 diabetes and cardiovascular disease attributable to sugar-sweetened beverages in 184 countries

Collaborators, Affiliations

Burdens of type 2 diabetes and cardiovascular disease attributable to sugar-sweetened beverages in 184 countries

Laura Lara-Castor et al. Nat Med. 2025 Feb.

Erratum in

Abstract

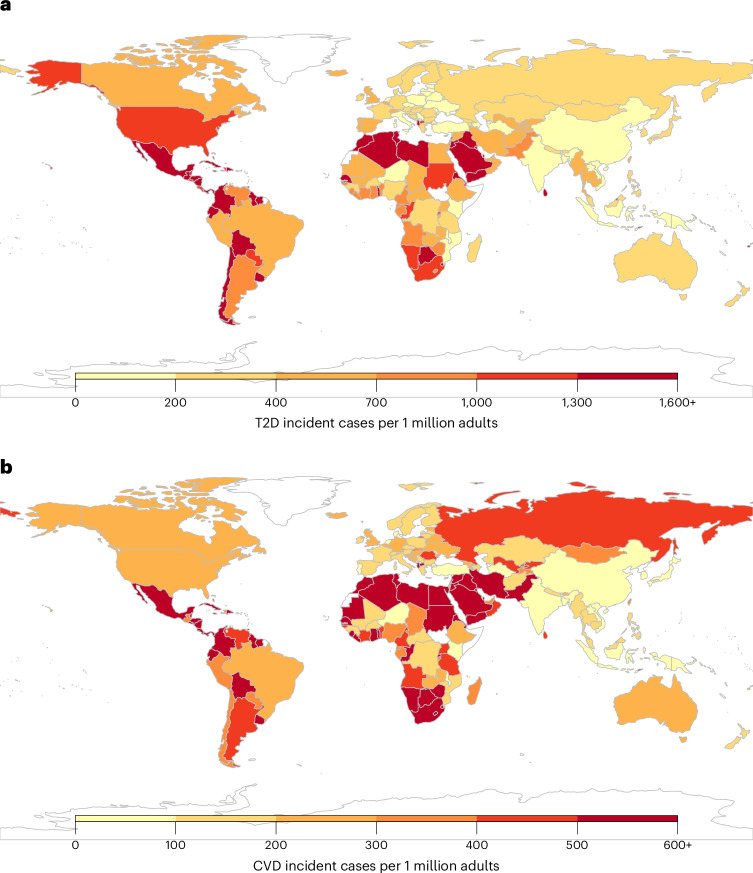
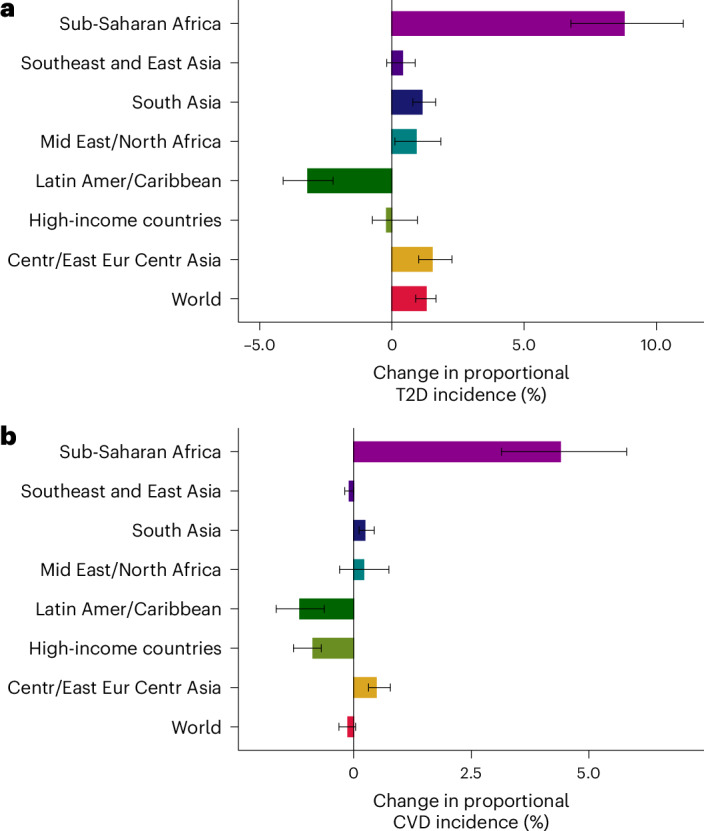
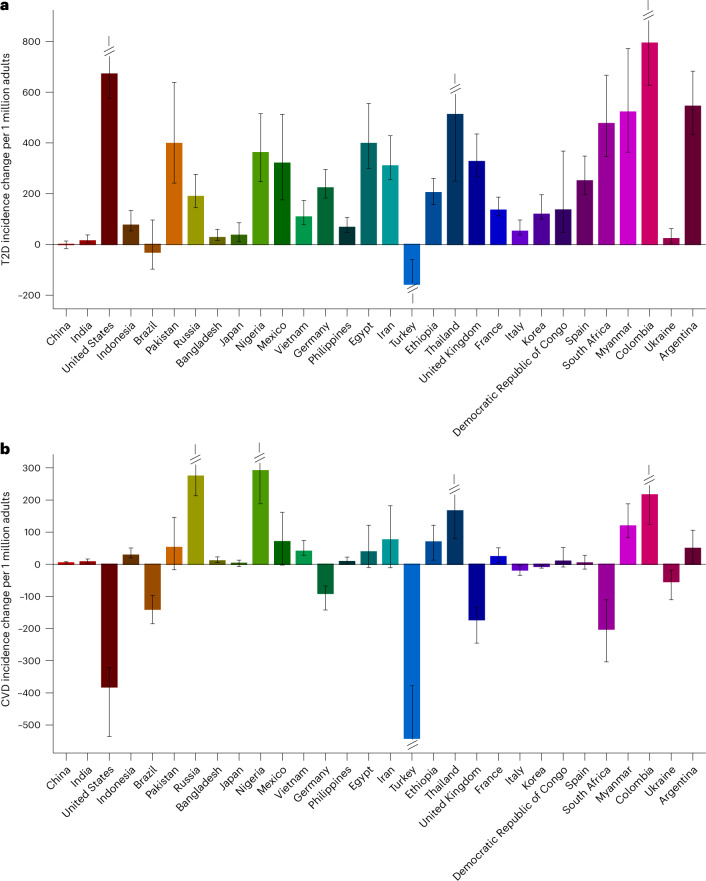
The consumption of sugar-sweetened beverages (SSBs) is associated with type 2 diabetes (T2D) and cardiovascular diseases (CVD). However, an updated and comprehensive assessment of the global burden attributable to SSBs remains scarce. Here we estimated SSB-attributable T2D and CVD burdens across 184 countries in 1990 and 2020 globally, regionally and nationally, incorporating data from the Global Dietary Database, jointly stratified by age, sex, educational attainment and urbanicity. In 2020, 2.2 million (95% uncertainty interval 2.0-2.3) new T2D cases and 1.2 million (95% uncertainty interval 1.1-1.3) new CVD cases were attributable to SSBs worldwide, representing 9.8% and 3.1%, respectively, of all incident cases. Globally, proportional SSB-attributable burdens were higher among men versus women, younger versus older adults, higher- versus lower-educated adults, and adults in urban versus rural areas. By world region, the highest SSB-attributable percentage burdens were in Latin America and the Caribbean (T2D: 24.4%; CVD: 11.3%) and sub-Saharan Africa (T2D: 21.5%; CVD: 10.5%). From 1990 to 2020, the largest proportional increases in SSB-attributable incident T2D and CVD cases were in sub-Saharan Africa (+8.8% and +4.4%, respectively). Our study highlights the countries and subpopulations most affected by cardiometabolic disease associated with SSB consumption, assisting in shaping effective policies and interventions to reduce these burdens globally.


Conflict of interest statement

Competing interests: The investigators did not receive funding from a pharmaceutical company or other agency to write this report. L.L.-C. reports research funding from the Gates Foundation, the American Heart Association and Consejo Nacional de Ciencia y Tecnología in Mexico (CONACyT), outside of the submitted work. M.O. reports previous research funding from the Gates Foundation, as well as the National Institutes of Health and employment with Food Systems for the Future, outside of the submitted work. R.M. reports research funding from the Gates Foundation and (ended) the US National Institutes of Health, Danone and Nestle. She also reports consulting from Development Initiatives and as IEG chair for the Global Nutrition Report, outside of the submitted work. F.C., J.Z. and P.S. report research funding from the Gates Foundation, as well as the National Institutes of Health, outside of the submitted work. V.M. reports research funding from the Canadian Institutes of Health Research and from the American Heart Association, outside the submitted work. J.R.S. reports research funding from the Gates Foundation, as well as the National Institutes of Health, Nestlé, Rockefeller Foundation and Kaiser Permanent Fund at East Bay Community Foundation, outside of the submitted work. S.B. reports funding from Bloomberg Philanthropies, CONACyT, United Nations International Children’s Emergency Fund (UNICEF) and Fundación Rio Arronte, all outside the submitted work. S.B.C. reports research funding from the US National Institutes of Health, US Department of Agriculture, the Rockefeller Foundation, US Agency for International Development and the Kaiser Permanente Fund at East Bay Community Foundation, outside the submitted work. D.M. reports research funding from the US National Institutes of Health, the Gates Foundation, the Rockefeller Foundation, the Kaiser Permanente Fund at East Bay Community Foundation and the National Association of Chain Drug Stores Foundation; scientific advisory board membership for Beren Therapeutics, Brightseed, Calibrate, Elysium Health, HumanCo, Instacart, January Inc., Season Health and the Validation Institute; equity in Calibrate and HumanCo; and chapter royalties from UpToDate, all outside the submitted work.

Figures

Fig. 1
Fig. 1. Incidence of T2D and CVD per 1 million adults attributable to SSB intake among adults (20+ years) in 184 countries in 2020.
a,b, Absolute SSB-attributable T2D incidence (a) and absolute SSB-attributable CVD incidence (b). The SSB-attributable absolute burden per 1 million adults was calculated by dividing the country absolute number of SSB-attributable cases by the country adult population (20+ years) in that same year and multiplying by 1 million. Values were truncated at 1,600 for a and at 600 for b to better reflect the absolute case distribution globally for T2D and CVD. The analysis of the data was done using the rworldmap package (v1.3-6). Source data are provided in Source Data Fig. 1. Source data
Fig. 2
Fig. 2. Incidence of T2D and CVD attributable to SSB intake by key sociodemographic factors at the global level and by world region in 2020.
ad, The bars represent the central estimate (median) of the proportional SSB-attributable T2D incidence (a), the absolute SSB-attributable T2D incidence per 1 million adults (b), the proportional SSB-attributable CVD incidence (c) and the absolute SSB-attributable CVD incidence per 1 million adults (d). The error bars represent the 95% UI derived from the 2.5th and 97.5th percentiles of 1,000 multiway probabilistic Monte Carlo model simulations. The SSB-attributable absolute burden per 1 million adults was calculated by dividing the stratum absolute number of SSB-attributable cases by the stratum adult population (20+ years) in that same year and multiplying by 1 million. In previous GDD reports, the region ‘Central and Eastern Europe and Central Asia’ was referred to as ‘Former Soviet Union’, and ‘Southeast and East Asia’ was referred to as ‘Asia’. See Supplementary Table 2 for a list of countries included in each world region. Source data are provided in Source Data Fig. 2. Centr/East Eur Centr Asia, Central or Eastern Europe and Central Asia; Latin Amer/Caribbean, Latin America and the Caribbean; Mid East/North Africa, Middle East and North Africa. Source data
Fig. 3
Fig. 3. Proportional incidence of T2D and CVD attributable to SSB intake among adults (20+ years) jointly stratified by world region, area of residence and education level in 2020.
a,b, The bars represent the central estimate (median) of the proportional SSB-attributable T2D incidence (a) and CVD incidence (b). The error bars represent the 95% UI derived from the 2.5th and 97.5th percentiles of 1,000 multiway probabilistic Monte Carlo model simulations. Values were truncated at 35 for a, and 95% UIs above 35 are shown with diagonal lines. Source data are provided in Source Data Fig. 3. Source data
Fig. 4
Fig. 4. Change in proportional incidence of T2D and CVD attributable to intake of SSBs among adults (20+ years) from 1990 to 2020 by world region.
a,b, The bars represent the central estimate (median) of the difference between 1990 and 2020 for the proportional T2D incidence (a) and CVD incidence (b) attributable to SSB. The error bars represent the 95% UI derived from the 2.5th and 97.5th percentiles of 1,000 multiway probabilistic Monte Carlo model simulations. Source data are provided in Source Data Fig. 4. Source data
Fig. 5
Fig. 5. Change in incident cases per 1 million adults of T2D and CVD attributable to SSB intake among adults (20+ years) from 1990 to 2020 among the 30 most populous countries.
a,b, The bars represent the central estimate (median) of the difference between 1990 and 2020 of the absolute SSB-attributable T2D incidence (a) and CVD incidence (b) per 1 million adults. The error bars represent the 95% UI derived from the 2.5th and 97.5th percentiles of 1,000 multiway probabilistic Monte Carlo model simulations. Values were truncated from −200 to 870 for T2D (a) and from −545 to 300 for CVD (b). The 95% UIs above or below these values are shown with diagonal lines. The SSB-attributable absolute burden per 1 million adults was calculated by dividing the country absolute number of SSB-attributable cases by the country adult population (20+ years) in that same year and multiplying by 1 million. The difference in the absolute burden per 1 million adults was calculated by subtracting per 1 million adult burdens in 1990 from per 1 million adult burdens in 2020. From left to right, the countries are ordered from most to least populous based on 2020 adult (20+ years) population data. Source data are provided in Source Data Fig. 5. Source data
Extended Data Fig. 1
Extended Data Fig. 1. Global disease burden attributable to intake of sugar-sweetened beverages among adults (20+ years) in 2020.
Bars represent the estimated proportional SSB-attributable burden in the top panel (a) and the estimated SSB-attributable absolute cases per 1 million adults in the bottom panel (b) of T2D and CVD incidence, deaths, and DALYs. Data are presented as central estimate (median) and the corresponding 95% UI, derived from the 2.5th and 97.5th percentiles of 1,000 multiway probabilistic Monte Carlo model simulations. The SSB-attributable absolute burden per 1 million adults was calculated by dividing the absolute number of SSB-attributable cases by the total adult population (20+ years) in that year and multiplying it by 1 million. Source data are provided in Source Data file 6. CVD, cardiovascular disease; SSBs, sugar sweetened beverages; T2D, type 2 diabetes; UIs, uncertainty intervals. Source data
Extended Data Fig. 2
Extended Data Fig. 2. Proportional incidence of T2D and CVD attributable to SSBs intake among adults (20+ years) jointly stratified by world region and age in 2020.
The filled circles represent the central estimate (median) of the proportional SSB-attributable diabetes incidence in the top panel (a) CVD incidence in the bottom panel (b). The error bars represent the 95% UI derived from the 2.5th and 97.5th percentiles of 1,000 multiway probabilistic Monte Carlo model simulations. The age groups are 20-24, 25-29, 30-34, 35-39, 40-44, 45-49, 50-54, 55-59, 60-64, 65-69, 70-74, 75-79, 80-84, 85+ years. In prior GDD reports, the region Central/ Eastern Europe and Central Asia was referred as Former Soviet Union, and Southeast and East Asia was referred as Asia. See Supplementary Table 1 for a list of countries included in each world region. Source data are provided in Source Data file 7. Centr/East Eur Centr Asia, Central/Eastern Europe and Central Asia; CVD, cardiovascular disease; GDD, Global Dietary Database; Latin Amer/Caribbean, Latin America/Caribbean; SSBs, sugar sweetened beverages; T2D, type 2 diabetes; UIs, uncertainty intervals. Source data
Extended Data Fig. 3
Extended Data Fig. 3. National correlation of proportional SSB-attributable T2D incidence and SDI in 1990 and 2020.
(a) 1990 and (b) 2020. Points represent the 184 countries included in this analysis (labeled with their ISO3 code and colored based on world region). The gray line represents the overall linear association, with Spearman correlation coefficient and associated P value (two-tailed) provided. No adjustments were made for multiple comparisons. SDI is a measure of a nation’s development expressed on a scale of 0 to 1 sourced from the Global Burden of Disease study, based on a compositive average of the rankings of income per capita, average educational attainment and fertility rates. In prior GDD reports, the region Central/ Eastern Europe and Central Asia was referred as Former Soviet Union, and Southeast and East Asia was referred to as Asia. See Supplementary Table 1 for a list of countries included in each world region. Source data are provided in Source Data file 8. Source data
Extended Data Fig. 4
Extended Data Fig. 4. National correlation of proportional SSB-attributable CVD incidence and SDI at the national level in 1990 and 2020.
(a) 1990 and (b) 2020. Points represent the 184 countries included in this analysis (labeled with their ISO3 code and colored based on world region). The gray line represents the overall linear association, with Spearman correlation coefficient and associated p value (two-tailed) provided. No adjustments were made for multiple comparisons. SDI is a measure of a nation’s development expressed on a scale of 0 to 1 sourced from the Global Burden of Disease study, based on a compositive average of the rankings of income per capita, average educational attainment and fertility rates. In prior GDD reports, the region Central/ Eastern Europe and Central Asia was referred as Former Soviet Union, and Southeast and East Asia was referred to as Asia. See Supplementary Table 1 for a list of countries included in each world region. Source data are provided in Source Data file 8. Centr/Eastern Eur Centr Asia, Central/Eastern Europe and Central Asia; CVD, cardiovascular disease; GDD, Global Dietary Database; Latin Amer/Caribbean, Latin America/Caribbean; SDI, sociodemographic development index; SSBs, sugar sweetened beverages; UIs, uncertainty intervals. Source data

References

    1. Malik, V. S. & Hu, F. B. The role of sugar-sweetened beverages in the global epidemics of obesity and chronic diseases. Nat. Rev. Endocrinol.18, 205–218 (2022). - PMC - PubMed
    1. Miller, V. et al. Evaluation of the quality of evidence of the association of foods and nutrients with cardiovascular disease and diabetes: a systematic review. JAMA Netw. Open5, e2146705 (2022). - PMC - PubMed
    1. Singh, G. M. et al. Estimated global, regional, and national disease burdens related to sugar-sweetened beverage consumption in 2010. Circulation132, 639–666 (2015). - PMC - PubMed
    1. Murray, C. J. L. et al. Global burden of 87 risk factors in 204 countries and territories, 1990–2019: a systematic analysis for the Global Burden of Disease Study 2019. Lancet396, 1223–1249 (2020). - PMC - PubMed
    1. Beal, T., Herforth, A., Sundberg, S., Hess, S. Y. & Neufeld, L. M. Differences in modelled estimates of global dietary intake. Lancet397, 1708–1709 (2021). - PubMed

LinkOut - more resources