. 2025 Mar;31(3):869-880.
doi: 10.1038/s41591-024-03398-5. Epub 2025 Jan 6.

Prediction of checkpoint inhibitor immunotherapy efficacy for cancer using routine blood tests and clinical data

Affiliations

Prediction of checkpoint inhibitor immunotherapy efficacy for cancer using routine blood tests and clinical data

Seong-Keun Yoo et al. Nat Med. 2025 Mar.

Abstract

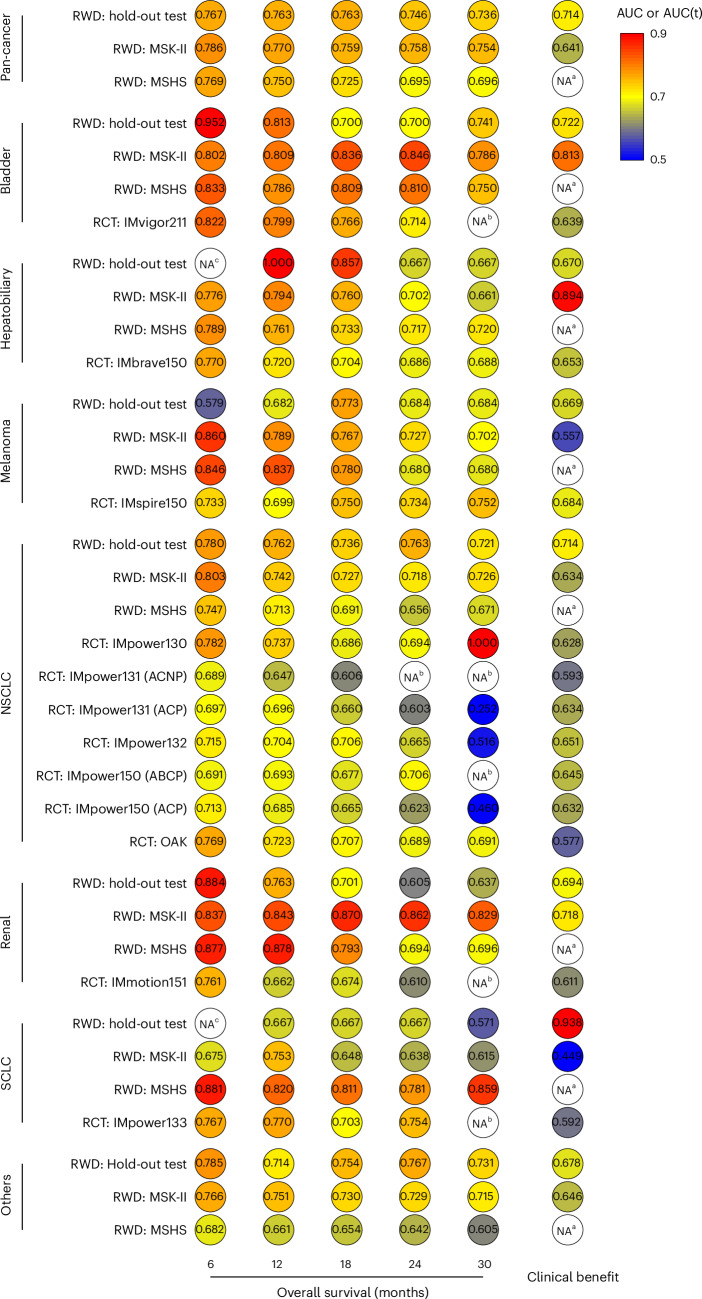
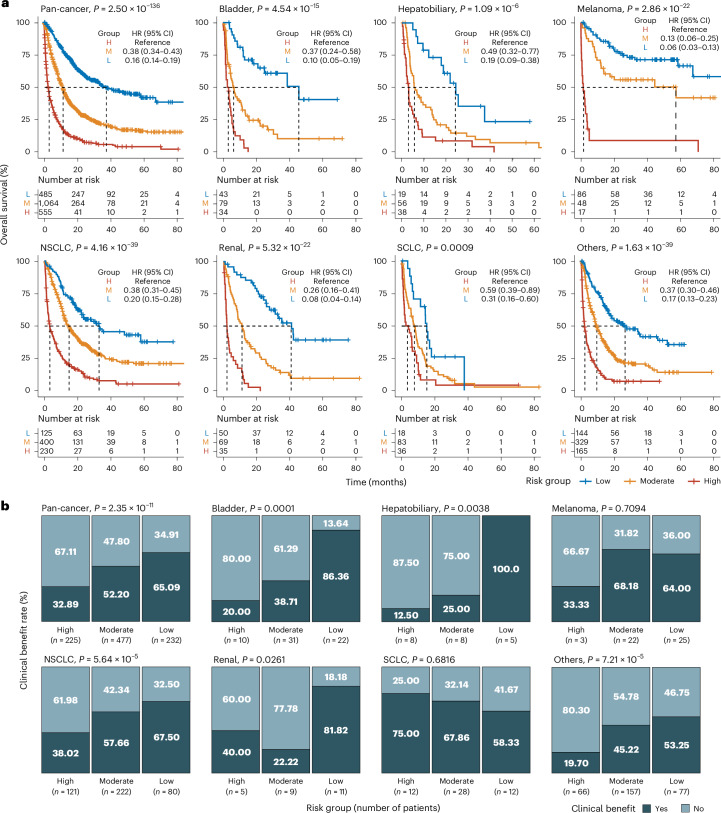
Predicting whether a patient with cancer will benefit from immune checkpoint inhibitors (ICIs) without resorting to advanced genomic or immunologic assays is an important clinical need. To address this, we developed and evaluated SCORPIO, a machine learning system that utilizes routine blood tests (complete blood count and comprehensive metabolic profile) alongside clinical characteristics from 9,745 ICI-treated patients across 21 cancer types. SCORPIO was trained on data from 1,628 patients across 17 cancer types from Memorial Sloan Kettering Cancer Center. In two internal test sets comprising 2,511 patients across 19 cancer types, SCORPIO achieved median time-dependent area under the receiver operating characteristic curve (AUC(t)) values of 0.763 and 0.759 for predicting overall survival at 6, 12, 18, 24 and 30 months, outperforming tumor mutational burden (TMB), which showed median AUC(t) values of 0.503 and 0.543. Additionally, SCORPIO demonstrated superior predictive performance for predicting clinical benefit (tumor response or prolonged stability), with AUC values of 0.714 and 0.641, compared to TMB (AUC = 0.546 and 0.573). External validation was performed using 10 global phase 3 trials (4,447 patients across 6 cancer types) and a real-world cohort from the Mount Sinai Health System (1,159 patients across 18 cancer types). In these external cohorts, SCORPIO maintained robust performance in predicting ICI outcomes, surpassing programmed death-ligand 1 immunostaining. These findings underscore SCORPIO's reliability and adaptability, highlighting its potential to predict patient outcomes with ICI therapy across diverse cancer types and healthcare settings.


Conflict of interest statement

Competing interests: S.-K.Y., B.A.C., C.W.F., C.H., L.G.T.M. and D.C. have a provisional patent application for using routine blood tests and clinical variables to predict cancer immunotherapy response. D.C., R.M.S. and L.G.T.M. are co-inventors on a patent (US11230599/EP4226944A3) filed by MSKCC for using TMB to predict immunotherapy response, licensed to Personal Genome Diagnostics (PGDx). S.-K.Y., C.V., L.G.T.M. and D.C. are co-inventors on a patent (US20240282410A1) filed jointly by Cleveland Clinic and MSKCC for a multi-modal machine learning model to predict immunotherapy response, licensed to Tempus. S.G. reports grants from Boehringer Ingelheim, Bristol Myers Squibb, Celgene, Genentech, Regeneron and Takeda not related to this study and personal fees from Taiho outside the submitted work. M.D.G reports grants from Bristol Myers Squibb, AstraZeneca, Merck and Genentech, and serves as an advisory board/consultant for Astellas, Bristol Myers Squibb, Merck, Genentech, AstraZeneca, Pfizer, EMD Serono, SeaGen, Janssen, Numab, Dragonfly, GlaxoSmithKline, Basilea, UroGen, Rappta Therapeutics, Alligator, Silverback, Fujifilm, Curis, Gilead, Bicycle, Asieris, Abbvie, Analog Devices, Veracyte, Daiichi and Aktis. E.E.S is an executive officer at Pathos, a clinical-stage oncology drug development and information company, and owns equity in this company. The other authors declare no competing interests.

Figures

Fig. 1
Fig. 1. Schematic of the study design and analysis.
a, Cohort collection. Top: a real-world cohort (MSK-I) from MSKCC was used for model development. Middle: two real-world cohorts from MSKCC (MSK-II) and MSHS were used. Bottom: 10 global phase 3 clinical trials were used. ITT, intention-to-treat. b, Feature selection analysis. Top: number of features collected in the MSK-I cohort for model development. Bottom: 47 features were tested for the association with overall survival using the Cox proportional hazards regression or clinical benefit using the Cochran-Mantel-Haenszel test. Systemic therapy history was adjusted as a confounding factor in both tests. c, Machine learning analysis. Top: model construction with separate models for predicting overall survival and clinical benefit. Middle: model performance comparison using ROC and AUC (receiver operating characteristic and area under the receiver operating characteristic curve). Bottom: model performance evaluation. Among the two machine learning models, the one that performed the best on the hold-out test set was subjected to the analyses.
Fig. 2
Fig. 2. Performance of SCORPIO across all real-world cohorts, phase 3 clinical trials and different tumor types.
Dot plot summarizing SCORPIO’s performance in prognosticating overall survival at 6, 12, 18, 24 and 30 months and predicting clinical benefit in the three real-world cohorts and 12 experimental arms from 10 phase 3 clinical trials. RWD, real-world data; RCT, randomized clinical trials. aThe calculation of AUC was not feasible due to the absence of clinical benefit data in the MSHS cohort. bThe calculation of AUC(t) was not feasible, as all patients had died by this time point. cThe calculation of AUC(t) was not feasible, as all patients remained alive at this time point.
Fig. 3
Fig. 3. Performance of SCORPIO on the MSK-II cohort (internal test set).
a, Kaplan-Meier plots showing overall survival for the three risk groups stratified by SCORPIO. Tick marks indicate censored data. Black vertical and horizontal dashed lines represent the median survival time for each risk group. Two-sided P values were calculated using the log-rank test. Correction for multiple testing was not applied. b, Bar charts displaying clinical benefit rates for the three risk groups stratified by SCORPIO. Two-sided P values were calculated using the Fisher’s exact test. Correction for multiple testing was not applied.
Fig. 4
Fig. 4. Model interpretability.
a, Global model explanation using a dot plot of aggregated SHAP values for SCORPIO features. A higher value in a feature with a negative aggregated SHAP value (yellow) lowers the risk score value, whereas a higher value in a feature with a positive aggregated SHAP value (purple) increases it. Features were sorted by absolute aggregated SHAP value. WBC, white blood cell; RBC, red blood cell; AGAP, anion gap; PROT, total protein; LYM%, lymphocyte proportion among WBCs; NEUT%, neutrophil proportion among WBCs; Smoking, smoking history; NEUT, neutrophil count; CREAT, creatinine; LYM, lymphocyte count; HCT, hematocrit; GLU, glucose; MONO, monocyte count; ALT, alanine aminotransferase; Age, age at ICI; AST, aspartate aminotransferase; MCHC, mean corpuscular HGB concentration; Stage, tumor stage at ICI; MLR, monocyte-to-lymphocyte ratio; RDW, red blood cell distribution width; ALK, alkaline phosphatase; BASO%, basophil proportion among WBCs; eGFR, estimated glomerular filtration rate; PLT, platelet; BILI, total bilirubin; BLR, basophil-to-lymphocyte ratio. be, Local model explanation in (b and c) two representative cases with a CR to ipilimumab/nivolumab and atezolizumab, respectively, and (d and e) two representative cases with PD to atezolizumab and pembrolizumab, respectively. Each case is depicted with a bar chart in the left panel, displaying the aggregated SHAP values that indicate the magnitude and the direction of each feature’s impact on the predicted risk score. The right panel shows pre- and post-treatment radiographic images. Feature values of the corresponding features in a given patient are provided in the bar charts. The best overall tumor response and survival of each patient are also shown. Density plots show the distribution of the risk scores in the training set, and black dashed lines indicate each patient’s predicted risk score. MSS, microsatellite stable. The yellow arrows in b and c indicate liver and lung metastases, respectively, in the pre-immunotherapy scan (‘Pre-ICI’). The corresponding post-therapy scan (‘Post-ICI’) demonstrates complete response, with no visible lesions. The yellow lines in d represent the bidirectional diameters of malignant pleural effusion in pre- and post-immunotherapy scans, reflecting progressive disease despite treatment. The yellow dashed line in e outlines a new malignant pleural effusion that developed during ICI therapy, indicating progressive disease. f,g, Heatmaps displaying the association between 14 immune cell types and the top five features, along with the predicted risk score from SCORPIO in (f) patients with NSCLC and (g) patients with head and neck (H&N) cancer. NK, natural killer. Two-sided P values were calculated using the Spearman’s rank correlation test. * False discovery rate (FDR) adjusted P < 0.05. ** FDR adjusted P < 0.01. Number in each cell denotes Spearman’s ρ.
Fig. 5
Fig. 5. Performance of SCORPIO on the 10 global phase 3 clinical trial cohorts (external test sets).
a, Kaplan-Meier plots showing overall survival for the three risk groups stratified by SCORPIO in the 12 experimental arms from the 10 clinical trial cohorts. Tick marks indicate censored data. Black vertical and horizontal dashed lines represent the median survival time for each risk group. Two-sided P values were calculated using the log-rank test. Correction for multiple testing was not applied. HCC, hepatocellular carcinoma. b, Bar charts showing clinical benefit rates for the three risk groups stratified by SCORPIO in the 12 experimental arms from the 10 clinical trial cohorts. Two-sided P values were calculated using the Fisher’s exact test. Correction for multiple testing was not applied.
Fig. 6
Fig. 6. Performance of SCORPIO on the MSHS cohort (external test set).
Kaplan-Meier plots showing overall survival for the three risk groups stratified by SCORPIO. Tick marks indicate censored data. Black vertical and horizontal dashed lines represent the median survival time for each risk group. Two-sided P values were calculated using the log-rank test. Correction for multiple testing was not applied.

References

    1. Boussiotis, V. A. Molecular and biochemical aspects of the PD-1 checkpoint pathway. N. Engl. J. Med.375, 1767–1778 (2016). - PMC - PubMed
    1. Havel, J. J., Chowell, D. & Chan, T. A. The evolving landscape of biomarkers for checkpoint inhibitor immunotherapy. Nat. Rev. Cancer19, 133–150 (2019). - PMC - PubMed
    1. Topalian, S. L., Taube, J. M., Anders, R. A. & Pardoll, D. M. Mechanism-driven biomarkers to guide immune checkpoint blockade in cancer therapy. Nat. Rev. Cancer16, 275–287 (2016). - PMC - PubMed
    1. Subbiah, V., Solit, D. B., Chan, T. A. & Kurzrock, R. The FDA approval of pembrolizumab for adult and pediatric patients with tumor mutational burden (TMB) ≥10: a decision centered on empowering patients and their physicians. Ann. Oncol.31, 1115–1118 (2020). - PubMed
    1. Samstein, R. M. et al. Tumor mutational load predicts survival after immunotherapy across multiple cancer types. Nat. Genet.51, 202–206 (2019). - PMC - PubMed

Substances