

Identification of Quantitative Trait Loci (QTLs) and candidate genes for trichome development in Brassica villosa using genetic, genomic, and transcriptomic approaches
- PMID: 39762458
- PMCID: PMC11703928
- DOI: 10.1007/s00438-024-02223-5
Identification of Quantitative Trait Loci (QTLs) and candidate genes for trichome development in Brassica villosa using genetic, genomic, and transcriptomic approaches
Abstract
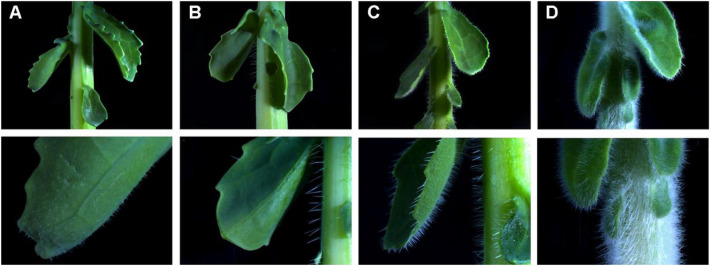
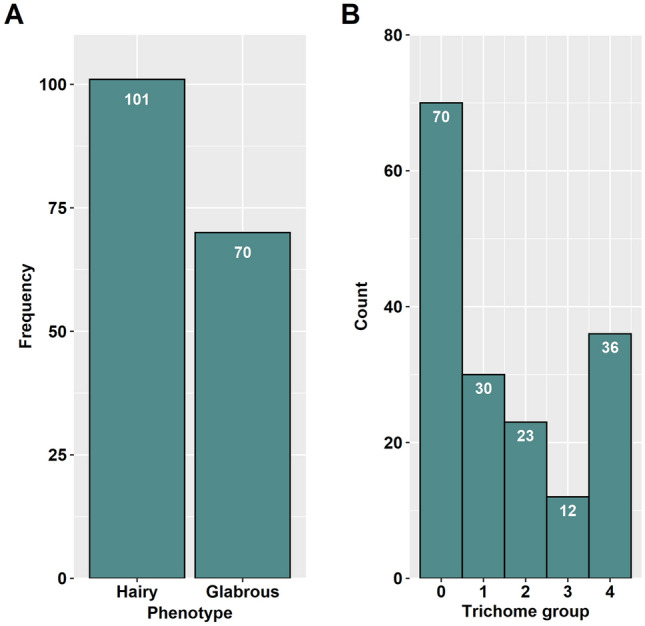
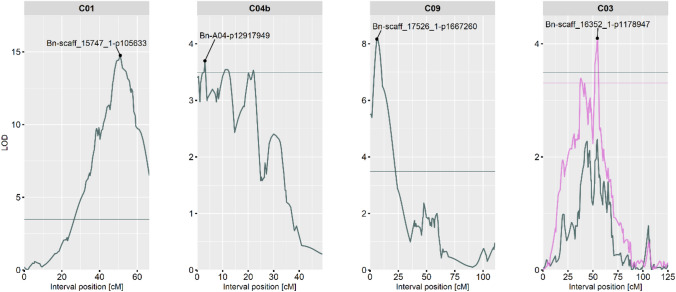
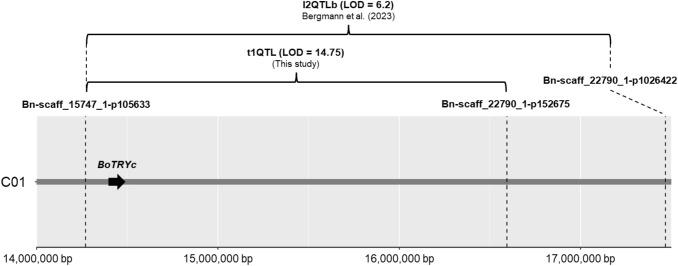
Brassica villosa is characterized by its dense hairiness and high resistance against the fungal pathogen Sclerotinia sclerotiorum. Information on the genetic and molecular mechanisms governing trichome development in B. villosa is rare. Here, we analyzed an F2 population, derived from a cross between B. villosa and the glabrous B. oleracea by QTL mapping and transcriptomic analyses. As a result, the phenotyping of 171 F2 progenies revealed a wide range of variation in trichome development. Subsequent genotyping with the 15-k Illumina SNP array resulted in a genetic map with 970 markers and a total length of 812 cM. Four QTLs were identified, which explained phenotypic variation from 3.2% to 40.3%. Interestingly, one of these was partially co-localized with the major QTL for Sclerotinia-resistance previously detected in the same F2 population. However, only a moderate correlation between trichomes and Sclerotinia-resistance was observed. In total, 133 differentially expressed genes (DEGs) associated with trichome development were identified, from which only BoTRY, an orthologue of Arabidopsis TRY encoding a MYB transcription factor negatively regulating trichome development, was located within the major QTL. Expression of BoTRY was tissue-specific and highly variable between the hairy and glabrous species, suggesting that BoTRY may also act as a master-switch regulator of trichome development in B. villosa. This study provides valuable data for further understanding the genetic architecture of trichome development and identifying related genes and mechanisms in Brassica species. Molecular markers can be developed to facilitate the introgression and selection of this trait in oilseed rape breeding.
Keywords: Brassica villosa; TRY; Genetic mapping; Genomics and transcriptomics of Brassica; QTL analysis; Trichomes.
© 2025. The Author(s).
Conflict of interest statement
Declarations. Competing of interest: The authors declare that they have no known competing financial interests or personal relationships that could have appeared to influence the work reported in this paper.
Figures


Similar articles
-
QTL mapping and transcriptome analysis identify novel QTLs and candidate genes in Brassica villosa for quantitative resistance against Sclerotinia sclerotiorum.Theor Appl Genet. 2023 Mar 26;136(4):86. doi: 10.1007/s00122-023-04335-9. Theor Appl Genet. 2023. PMID: 36966424 Free PMC article.
-
Comparison of five major trichome regulatory genes in Brassica villosa with orthologues within the Brassicaceae.PLoS One. 2014 Apr 22;9(4):e95877. doi: 10.1371/journal.pone.0095877. eCollection 2014. PLoS One. 2014. PMID: 24755905 Free PMC article.
-
Mapping of genetic locus for leaf trichome in Brassica oleracea.Theor Appl Genet. 2017 Sep;130(9):1953-1959. doi: 10.1007/s00122-017-2936-y. Epub 2017 Jun 20. Theor Appl Genet. 2017. PMID: 28634808
-
Status and advances in mining for blackleg (Leptosphaeria maculans) quantitative resistance (QR) in oilseed rape (Brassica napus).Theor Appl Genet. 2021 Oct;134(10):3123-3145. doi: 10.1007/s00122-021-03877-0. Epub 2021 Jun 9. Theor Appl Genet. 2021. PMID: 34104999 Free PMC article. Review.
-
Exploration of the Sclerotinia sclerotiorum-Brassica pathosystem: advances and perspectives in omics studies.Mol Biol Rep. 2024 Oct 26;51(1):1097. doi: 10.1007/s11033-024-10043-4. Mol Biol Rep. 2024. PMID: 39460825 Review.
References
-
- Altschul SF, Gish W, Miller W et al (1990) Basic local alignment search tool. J Mol Biol 215:403–410. 10.1016/S0022-2836(05)80360-2 - PubMed
-
- Balkunde R, Pesch M, Hülskamp M (2010) Trichome patterning in Arabidopsis thaliana. In: Current topics in developmental biology. Elsevier, pp 299–321 - PubMed
-
- Benjamini Y, Hochberg Y (1995) Controlling the false discovery rate: a practical and powerful approach to multiple testing. J R Stat Soc Ser B Stat Methodol 57:289–300. 10.1111/j.2517-6161.1995.tb02031.x
MeSH terms
Substances
Supplementary concepts
Grants and funding
LinkOut - more resources
Full Text Sources
Research Materials
Miscellaneous
