. 2025 Jan 6;8(1):14.
doi: 10.1038/s42003-024-07350-8.

The identification of a SARs-CoV2 S2 protein derived peptide with super-antigen-like stimulatory properties on T-cells

Affiliations

The identification of a SARs-CoV2 S2 protein derived peptide with super-antigen-like stimulatory properties on T-cells

Thai Hien Tu et al. Commun Biol. .

Abstract

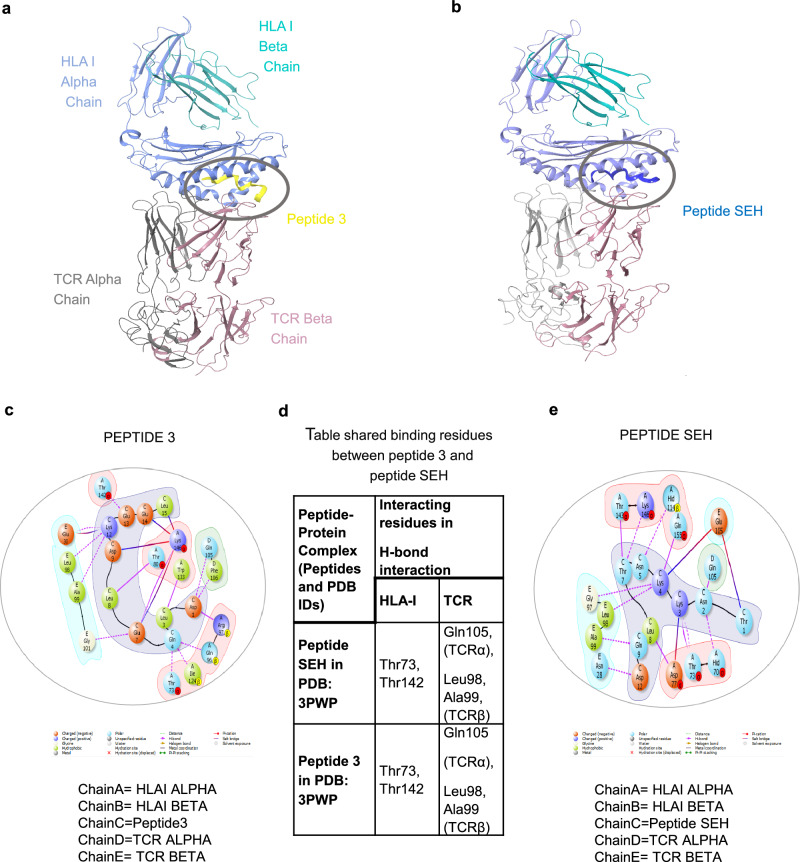
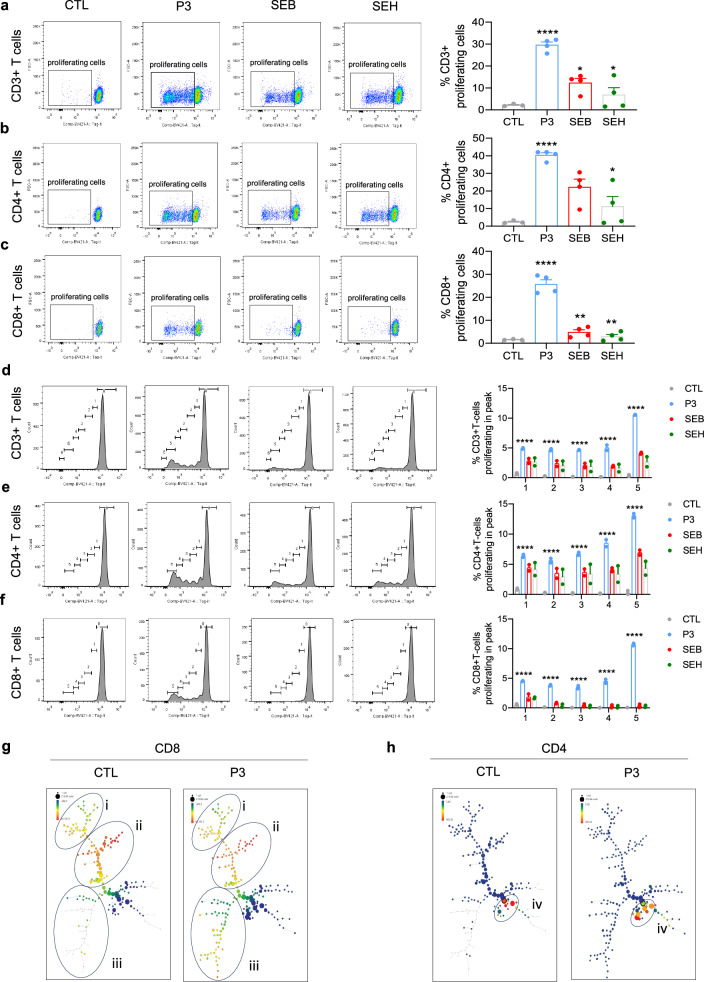
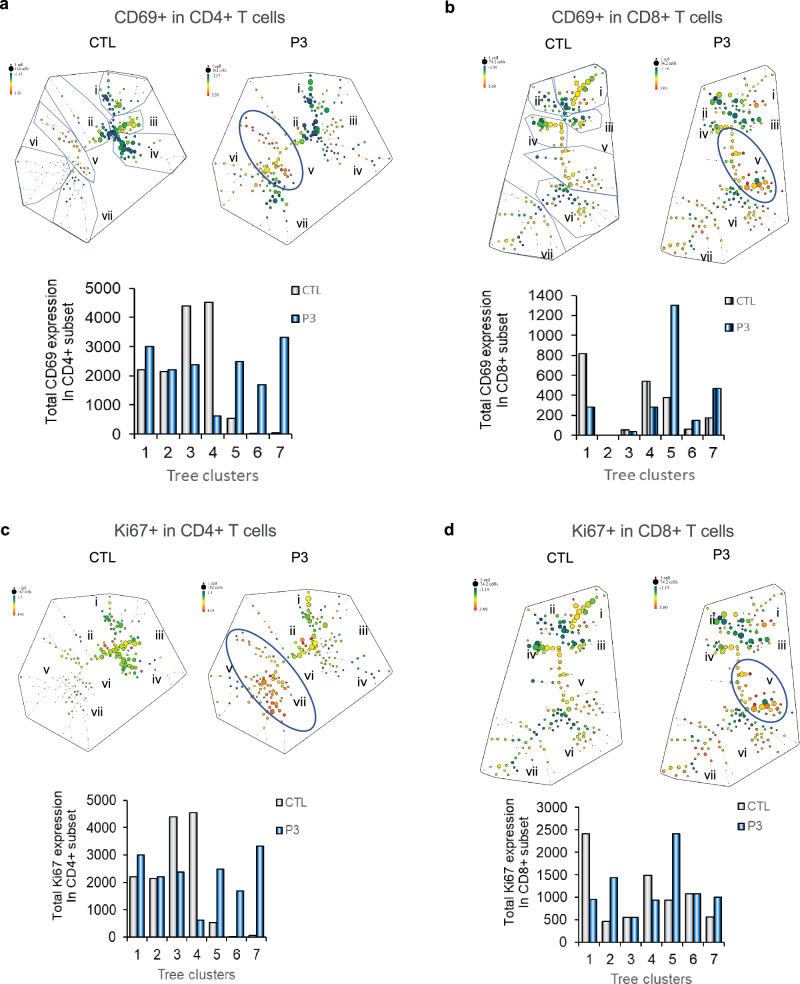
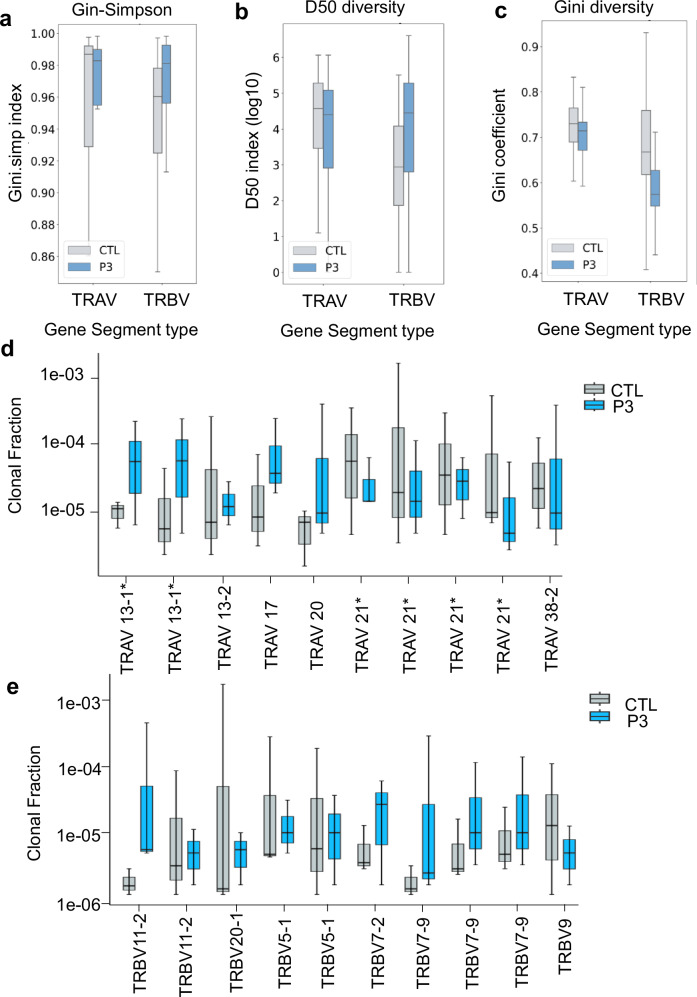
Severe COVID-19 can trigger a cytokine storm, leading to acute respiratory distress syndrome (ARDS) with similarities to superantigen-induced toxic shock syndrome. An outstanding question is whether SARS-CoV-2 protein sequences can directly induce inflammatory responses. In this study, we identify a region in the SARS-CoV-2 S2 spike protein with sequence homology to bacterial super-antigens (termed P3). Computational modeling predicts P3 binding to sites on MHC class I/II and the TCR that partially overlap with sites for the binding of staphylococcal enterotoxins B and H. Like SEB and SEH derived peptides, P3 stimulated 25-40% of human CD4+ and CD8 + T-cells, increasing IFN-γ and granzyme B production. viSNE and SPADE profiling identified overlapping and distinct IFN-γ+ and GZMB+ subsets. The super-antigenic properties of P3 were further evident by its selective expansion of T-cells expressing specific TCR Vα and Vβ chain repertoires. In vivo experiments in mice revealed that the administration of P3 led to a significant upregulation of proinflammatory cytokines IL-1β, IL-6, and TNF-α. While the clinical significance of P3 in COVID-19 remains unclear, its homology to other mammalian proteins suggests a potential role for this peptide family in human inflammation and autoimmunity.


Conflict of interest statement

Competing interests: The authors declare no competing interests.

Figures

Fig. 1
Fig. 1. Overview of three- and two-dimensional structure of the complex docking TCR– HLA-1 peptides complex (PDB ID 3PWP).
a Complex docking of peptide 3 with TCR and human class MHC (HLA) I antigen displayed in cartoon style for HLA-I_TCR and peptide 3 is yellow ribbon, showing binding at the interface connecting TCR to HLA-I. Peptide 3 makes 14 H-bond interactions and 6 salt-bridge interactions. b Complex docking of peptide SEH with TCR and human class MHC (HLA) antigen displayed in cartoon style for HLA-I_TCR. Peptide is shown as a dark blue ribbon with binding at the interface connecting TCR to HLA-I. c 2D diagram of interaction of peptide 3 and SEH with MHC-class 1 and TCR residues showing binding residues for P3. d Table showing the H bond binding to residues for peptide 3 and peptide SEH binding to the complex HLA-I. e colored diagram showing binding residues for peptide SEH. SEH makes 11 H-bond interactions and 3 salt-bridge interactions.
Fig. 2
Fig. 2. Overview of three- and two-dimensional structure of the complex docking TCR– HLA-II peptides complex (PDB ID 2XN9).
a Complex docking of peptide 3 with TCR and human class MHC (HLA) II antigen displayed in cartoon style for HLA-II_TCR and peptide 3 is yellow ribbon, showing binding at the interface connecting TCR to HLA-II. Peptide 3 makes 20 H-bond interactions and 3 salt-bridge interactions. b Complex docking of peptide SEH with TCR and human class MHC (HLA) II antigen displayed in cartoon style for HLA-II_TCR and peptide SEH is dark blue ribbon, showing binding at the interface connecting TCR to HLA-II. SEH makes 11 H-Bond interaction and 3 salt-bridge interactions. c 2D diagram of interaction of peptide 3 and SEH with MHC-class II and TCR residues showing binding residues for P3; d Table showing the H bond binding to residues for peptide 3 and peptide SEH binding to the complex HLA-II. Both P3 and SEH make H-bond and salt bridge on Arg98. e colored diagram showing binding residues for SEH.
Fig. 3
Fig. 3. P3 peptide spike protein peptide enhances human T-cell proliferation.
PBMCs cells from 4 donors were stained with Tag-it before incubating with peptide 3, SEB, and SEH; media only without adding peptide was used as negative control group. The percentage of proliferating cells was measured with Tag-it proliferation assay after 6-day incubation. Left panel: Representative flow cytometry plots displaying gating for proliferating cells in T-cells (a), CD4+ (b), and CD8+ (c) T-cells. Proliferating cells are gated (left gates). Right panel: Histogram data show the percentage of proliferating cells. Data are presented as Mean ± SEM from 4 human PBMCs samples, significant at p ≤ 0.05 *, p ≤ 0.01 **, and p ≤ 0.001 ****. Left panel: The number of divisions was determined in proliferating T-cells (d), CD4+ (e), and CD8+ (f) T-cells. The gate “0” capturing the Tag-it undivided cells on the right and Tag-it divided cells on the left is identified with 5 divisions. The gate labeled as “0,1,2,3,4,5” indicate the numbers of cell division. Right panel: Histogram showing the percentage of proliferating cells in 5 divisions; CD3 + T-cells, CD4 + T-cells, CD8 + T-cells. Data are presented as Mean ± SEM from 2 human PBMCs samples, significant at p ≤ 0.001 ****. g, h SPADE analysis shows the increasing CD8 and CD4 population in CD3 + T-cells, with peptide 3 treatment. The fluorescence intensity of different markers for each node is represented by color (green to red), while the size of node represents the number of cells. Peptide increases the node in tree grouping iii (CD8+ cells) and tree grouping iv (CD4+ cells). The SPADE analysis was run with concatenated samples from 4 human PBMCs samples.
Fig. 4
Fig. 4. P3 spike peptide activates CD4+ and CD8+ human T-cells.
Human PBMCs (n = 4) were incubated with peptide 3, SEB, and SEH for 6 days, followed by an analysis of activation markers by flow cytometry. a CD69 expression on CD4 + T-cells. SPADE patterns show the increase of CD69 expression in CD4 + T-cells with peptide 3 treatment. The fluorescence intensity of different markers for each node is represented by color (green to red), while the size of node represents the number of cells. Histogram showing the total MFI level of CD69 expression in each tree cluster in CD4 + T-cells. Data is presented as Mean value of 4 human PBMCs concatenated sample. b SAPE analysis for CD69 expression on CD8 + T-cells. Histogram showing the total MFI level of CD69 expression in each tree cluster in CD8 + T-cells. Data is presented as Mean value from 4 human PBMCs concatenated sample. c SAPE analysis showed Ki67 expression on CD4 + T- cells. Histogram showing the total MFI level of Ki67 expression in each tree cluster in CD4 + T- cells. Data is presented as Mean value from 4 human PBMCs concatenated sample. d Ki67 expression on CD8 + T-cells by SPADE analysis and Histogram showing the total MFI level of Ki67 expression in each tree cluster in CD8 + T-cell. Data is presented as Mean value of 4 human PBMCs concatenated sample. The analysis incorporates concatenated data from 4 human samples in each condition. Equal numbers of cells in each condition were analyzed.
Fig. 5
Fig. 5. P3 spike peptide induces the expression of effector molecules in CD4+ and CD8+ human T-cells.
Human PBMCs (n = 4) were incubated with peptide 3, SEB, and SEH for 6 days, followed by an analysis of activation markers by flow cytometry. a IFNg expression on CD4 + T- cells. SPADE patterns show the increase of IFNg expression in CD4 + T-cells with peptide 3 treatment. Histogram showing the expression levels of IFNg+ cells in each tree cluster in CD4+ population due to incubation with the peptide 3. Data is presented as Mean value of 4 human PBMCs concatenated sample. b IFNγ expression on CD8 + T-cells. SPADE patterns show the increase of IFNg expression in CD8 + T-cells with peptide 3 treatment. Histogram showing the expression levels of IFNg+ cells in each tree cluster in CD8+ population due to incubation with the peptide 3. Data is presented as Mean value of 4 human PBMCs concatenated sample. c Percent of granzyme B (GZMB) expression on CD8 + T-cells. Description same as (b). The analysis incorporates concatenated data from 4 human samples in each condition. Equal numbers of cells in each condition were analyzed.
Fig. 6
Fig. 6. P3 induces proinflammatory cytokines in CD8+ human T-cells and in vivo in mice.
a Human PBMCs were incubated with peptide 3 for 6 days, and CD8 + T-cells were isolated (n = 3). Total RNA was extracted, followed by RT-PCR analysis. Expression of inflammatory cytokines IL6 and IL1b in peptide 3-treated cells. Cytokine mRNA levels were measured by real-time PCR, then normalized to the level of human 18S mRNA. Data are presented with fold change differences as compared with control sample. Data represents the mean ± SEM of technical duplicate. p ≤ 0.05 *, p ≤ 0.01 **. b Schematic representation of in vivo experiment. C57BL/6 mice were injected with P3 or SEB once a week for 3 weeks. At the end of experiment, spleen was harvested after 1 week of last injection for investigation. The mRNA levels of cytokines (IFNg, TNFa, IL6, GzmB, IL1b) in spleen of experimental mice were measured by real-time PCR, then normalized to the level of housekeeping gene b-actin. Data are presented fold change differently as compared with control sample. The significant differences were compared between P3-treated mice or SEB-treated mice with control group (no peptide treatment). c Secretion protein levels of IFNg, GzmB, IL1b, IL6, TNFa cytokines in splenocytes of mice immunized with peptide 3 or SEB. The levels of cytokines were determined by using flow cytometry, showing the percentage of CD8 + T-cell expressing each cytokine. Data was analyzed and presented as mean ± SEM from 5 mice in CTL group, n = 4 mice in P3-injected group, and n = 5 in SEB-injected group; significant at p ≤ 0.01 ** and p ≤ 0.001 ****.
Fig. 7
Fig. 7. TCR profiling of S2-derived peptide-activated CD8 + T-cells.
Human PBMCs were isolated from peripheral blood of three healthy donors and were incubated with peptide 3. After 6 days, CD8 + T-cells were isolated and followed the TCR repertoire profiling. Gini-Simpson (a), D50 diversity (b), and Gini diversity (c) significance analysis were performed to compare the diversity of TCR repertoires between CTL and P3-treated cells. d, e The concatenated TCR repertoire NGS results from 3 human PBMCs donors were analysed with packages dplyr and tidyr in the environment of R (4.4.1). Co-expressing α and β chain clones by three individuals were counted for clonal fraction and diversity analyse. Top 10 expressing clones for TRVA and TRVB were visualized with ggplot.c. d Common and distant repertoire results for the TCR-alpha chain. e Common and distant repertoire results for the TCR-beta chain. Data was analyzed and presented as mean ± SEM from 3 healthy human PBMCs donors.

Update of

References

    1. Amanat, F. & Krammer, F. SARS-CoV-2 vaccines: status report. Immunity52, 583–589 (2020). - PMC - PubMed
    1. Tay, M. Z., Poh, C. M., Renia, L., MacAry, P. A. & Ng, L. F. P. The trinity of COVID-19: immunity, inflammation and intervention. Nat. Rev. Immunol.20, 363–374 (2020). - PMC - PubMed
    1. Coperchini, F., Chiovato, L., Croce, L., Magri, F. & Rotondi, M. The cytokine storm in COVID-19: an overview of the involvement of the chemokine/chemokine-receptor system. Cytokine Growth Factor Rev.53, 25–32 (2020). - PMC - PubMed
    1. Weiskopf D. et al. Phenotype and kinetics of SARS-CoV-2-specific T cells in COVID-19 patients with acute respiratory distress syndrome. Sci. Immunol.5, eabd2071 (2020). - PMC - PubMed
    1. Premkumar L. et al. The receptor binding domain of the viral spike protein is an immunodominant and highly specific target of antibodies in SARS-CoV-2 patients. Sci. Immunol.5, eabc8413 (2020). - PMC - PubMed