. 2025 Feb;27(2):218-231.
doi: 10.1038/s41556-024-01574-w. Epub 2025 Jan 6.

Metabolic rewiring in skin epidermis drives tolerance to oncogenic mutations

Affiliations

Metabolic rewiring in skin epidermis drives tolerance to oncogenic mutations

Anupama Hemalatha et al. Nat Cell Biol. 2025 Feb.

Abstract

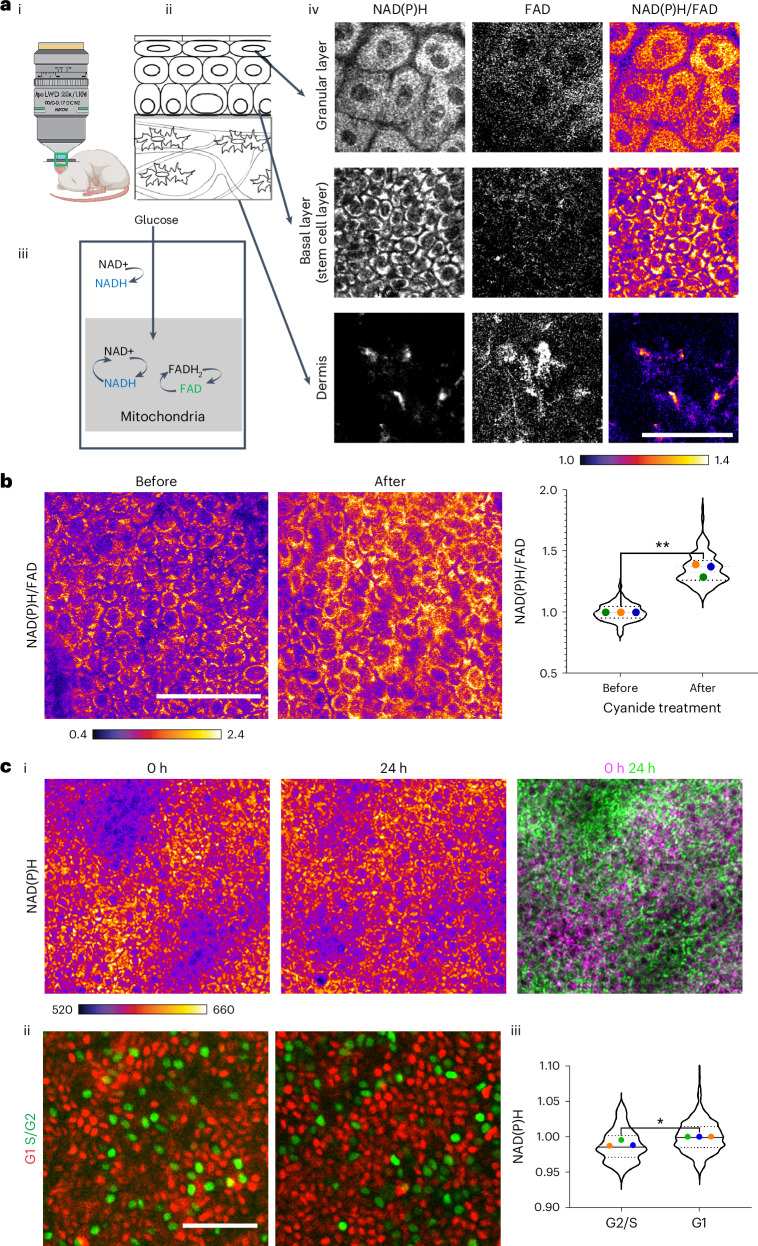
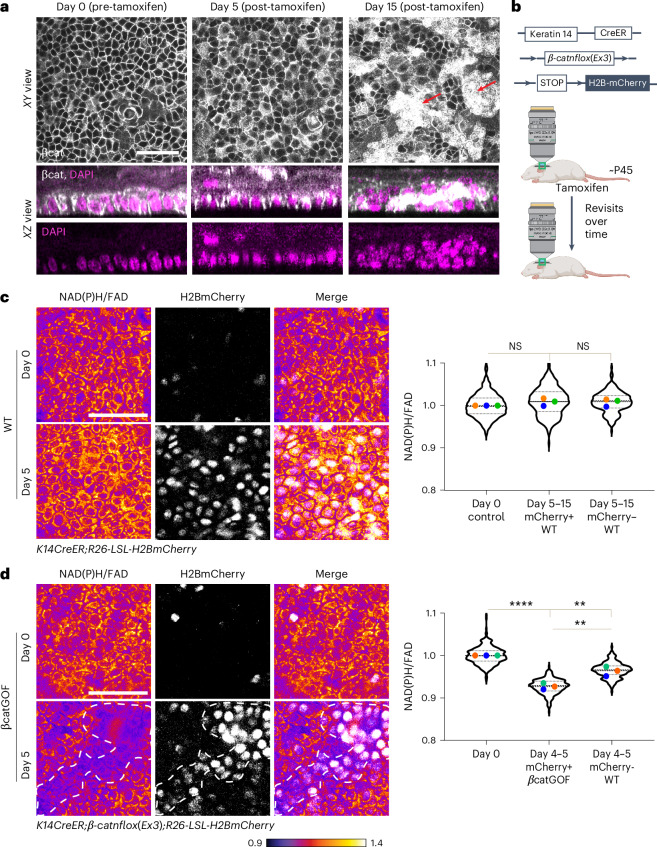
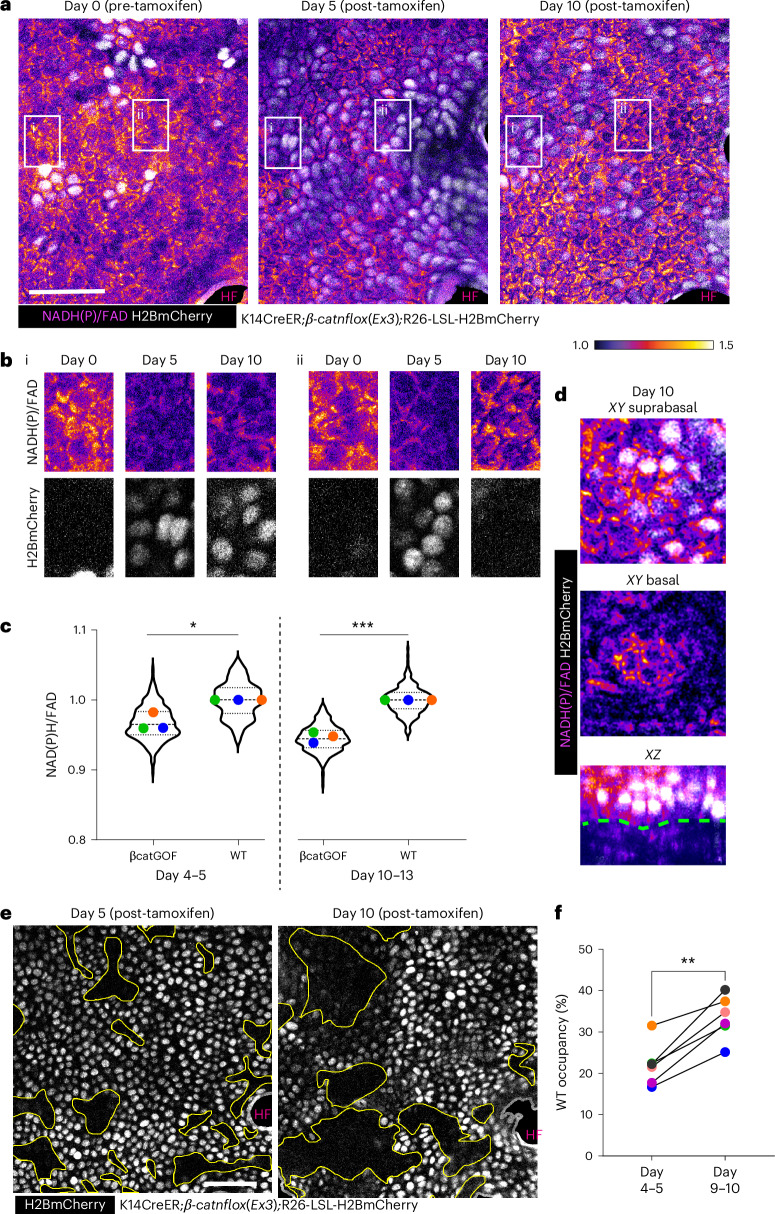
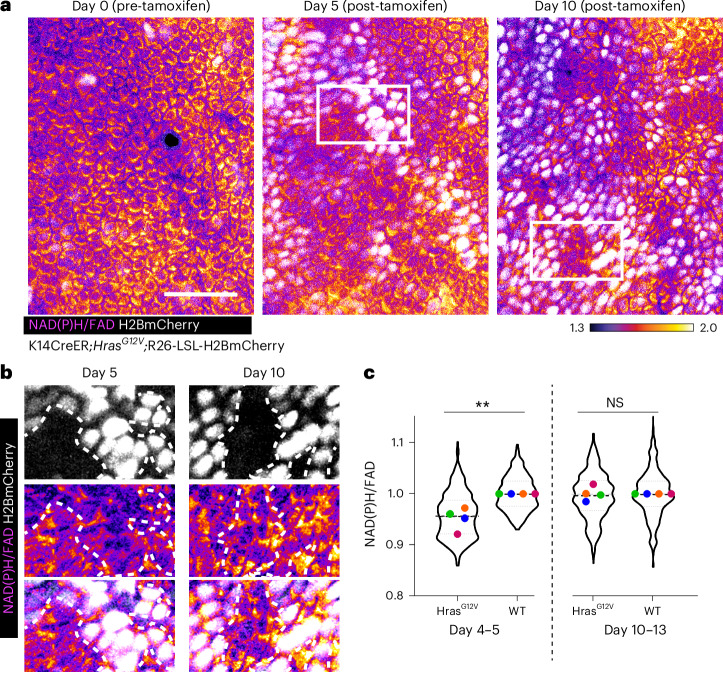
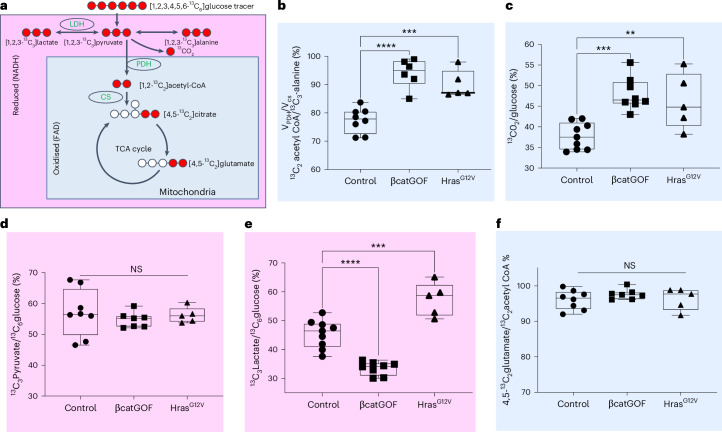
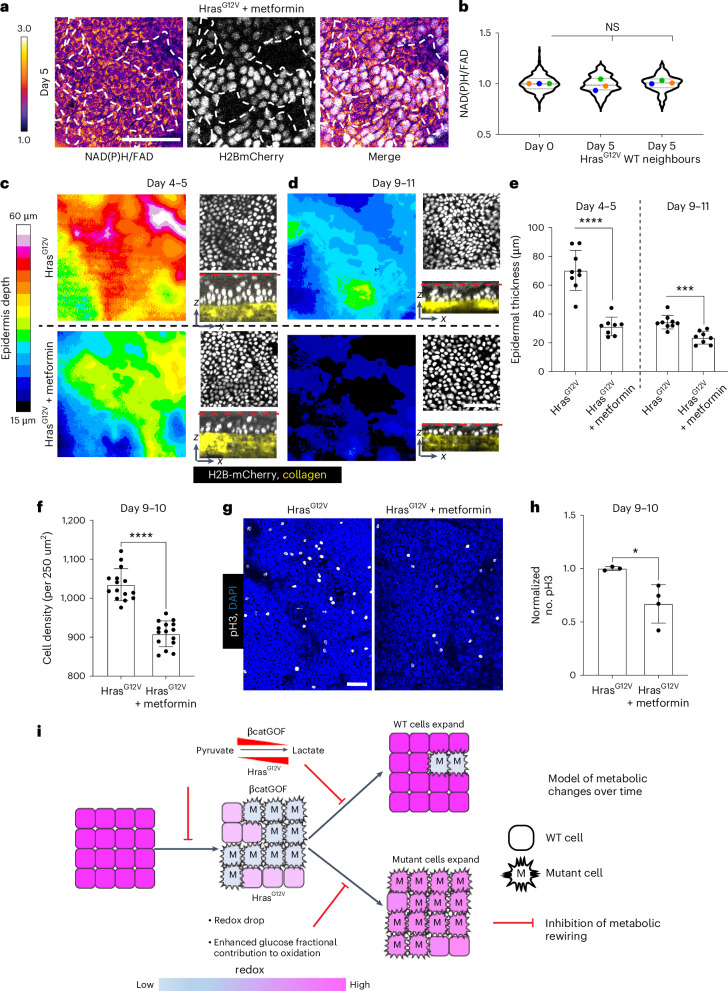
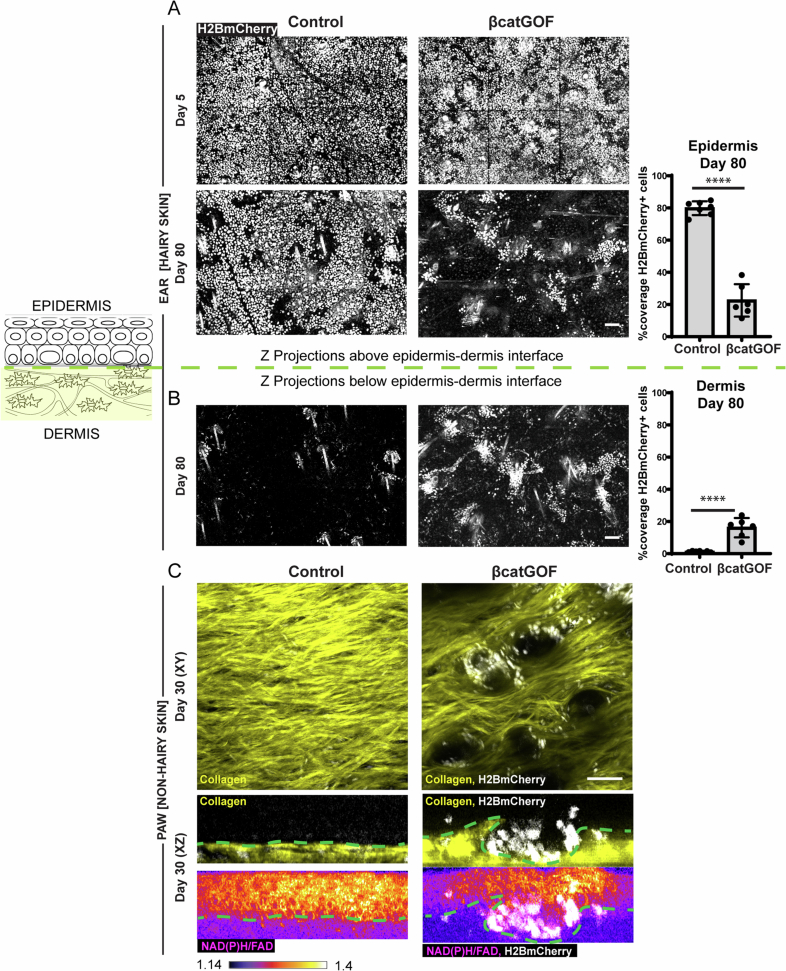
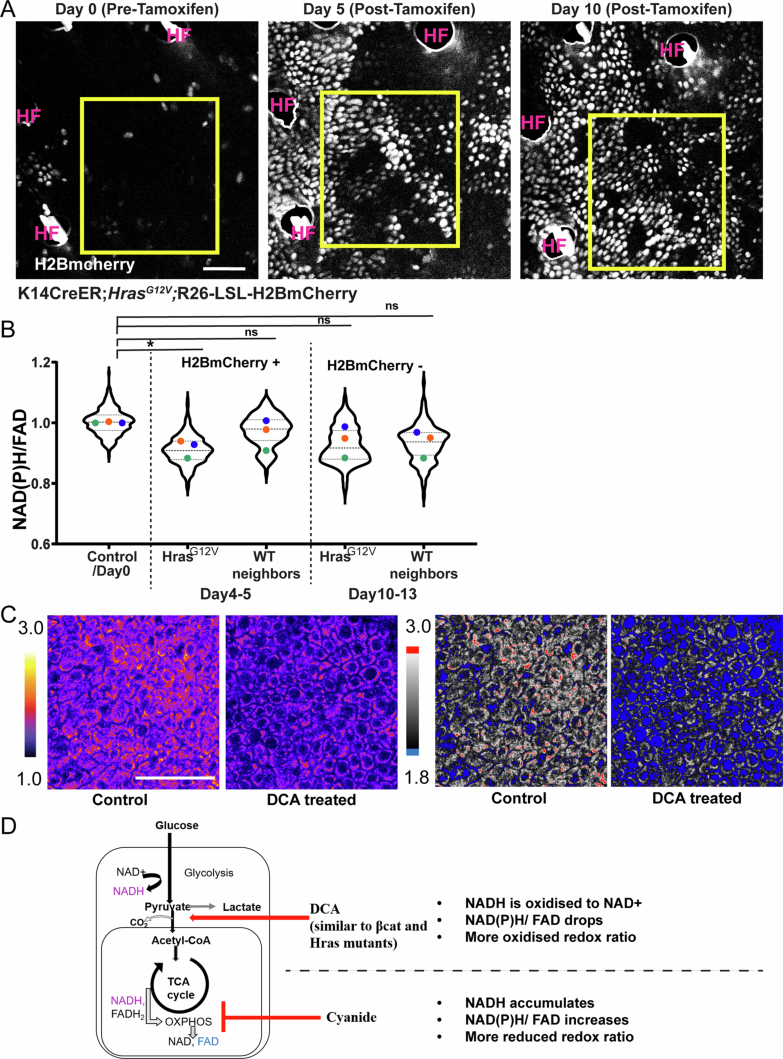
Skin epithelial stem cells correct aberrancies induced by oncogenic mutations. Oncogenes invoke different strategies of epithelial tolerance; while wild-type cells outcompete β-catenin-gain-of-function (βcatGOF) cells, HrasG12V cells outcompete wild-type cells. Here we ask how metabolic states change as wild-type stem cells interface with mutant cells and drive different cell-competition outcomes. By tracking the endogenous redox ratio (NAD(P)H/FAD) with single-cell resolution in the same mouse over time, we discover that βcatGOF and HrasG12V mutations, when interfaced with wild-type epidermal stem cells, lead to a rapid drop in redox ratios, indicating more oxidized cellular redox. However, the resultant redox differential persists through time in βcatGOF, whereas it is flattened rapidly in the HrasG12Vmodel. Using 13C liquid chromatography-tandem mass spectrometry, we find that the βcatGOF and HrasG12V mutant epidermis increase the fractional contribution of glucose through the oxidative tricarboxylic acid cycle. Treatment with metformin, a modifier of cytosolic redox, inhibits downstream mutant phenotypes and reverses cell-competition outcomes of both mutant models.


Conflict of interest statement

Competing interests: The authors declare no competing interests.

Figures

Fig. 1
Fig. 1. Epidermal stem cells have a unique and constrained metabolic signature at homoeostasis.
a, (i) Label-free imaging of NAD(P)H and FAD in the skin of live mice reveals (ii) the dynamic metabolic signature of (iii) the stem cell compartment. Only the reduced and oxidized counterparts NADH, NADPH and FAD are fluorescent and together they report on the redox ratio of the cell. (iv) Two-photon images of various epidermal layers and cell types in skin epithelia capture the endogenous autofluorescence of the metabolic cofactors NAD(P)H and FAD. NAD(P)H/FAD levels in the epidermal stem cell compartment (basal layer) are high compared to cells in dermis. Redox ratio (NAD(P)H/FAD) is represented as an intensity plot (scale below). (iii) Schematic showing how changes in glycolysis or mitochondrial metabolism rates influence the redox ratio. b, NAD(P)H/FAD ratios from the basal layer before and 5–10 min after sodium cyanide injection locally. Rapid increase in NAD(P)H/FAD is plotted on the right. The coloured dots represent average redox ratios per mouse from three mice, revisited before and after injection. **P = 0.0082 (paired t-test two-sided). Violin plot, n = 222 (before) and n = 187 (after) cells from three mice. c, (i) Basal layer when revisited after 24 h shows altered distribution of NAD(P)H intensity patterns. The underlying second harmonic signal patterns used to identify the same regions are shown in Extended Data Fig. 1b. (ii) Fucci (cell cycle reporter)-labelled stem cells. Green-labelled nuclei represent Geminin-containing nuclei (S/G2 cell cycle stage) and red-labelled nuclei represent Cdt1-containing nuclei (G1 stage). (iii) NAD(P)H intensities per cell measured from G1 nuclei show an increase in mean intensity compared with S/G2 nuclei. Violin plot, n = 120 (S/G2) and n = 490 (G1) cells from three mice. The average value from each mouse is labelled with a different colour. *P = 0.0063 (two-sided nested t-test). Scale bar, 50 µm. Panel a(i) created with BioRender.com. Source data
Fig. 2
Fig. 2. βcatGOF-induced stem cells shows rapid changes in redox (NAD(P)H/FAD) ratio before the emergence of other morphological aberrancies.
a, β-catenin immunofluorescence staining in basal layer of epidermis from K14CreER; βcatGOF mice 0, 5 and 15 days post-tamoxifen-induced recombination and expression of βcatGOF. The xy (top) and xz (bottom) sections show that the 3D structure of the basal layer is unperturbed at 5 days, unlike the multiple rows of nuclei found in aberrant placodes at 15 days (red arrows; z-stack for day 0, 5 and 15 in Supplementary Videos 3–5; images in Extended Data Fig. 2b). b, Schematic showing that similar regions from the same animal were imaged before and after tamoxifen-induced recombination and expression of βcatGOF and H2BmCherry (c,d). c, In control littermates (K14CreER; LSL-H2BmCherry), recombination post-tamoxifen leads to the expression of H2BmCherry (white nuclei). These recombined cells or their neighbours show no significant reduction in NAD(P)H/FAD ratio when imaged at 5, 9 or 15 days after tamoxifen administration. The average value from each mouse is labelled with a different colour for all graphs. Averages not significantly different (n = 3 each). Violin plot n (in order x axis) = 423, 250 and 221 cells from three mice. d, In βcatGOF mice (K14CreER; βcatGOF; LSL-H2BmCherry), mutant cells are indicated by coexpression of nuclear H2BmCherry (white, outlined by white dashed line). Despite there being no other morphological aberrancy, the NAD(P)H/FAD ratio of mutant cells (H2BmCherry-positive) steeply drops after 5 days when compared to values at day 0. The neighbouring WT cells (H2BmCherry-negative) also show a drop in redox ratio (NAD(P)H/FAD), although to a higher range than the mutant cells. Average redox P value from one-way analysis of variance (ANOVA); multiple comparisons; day 0 versus day 4–5 βcatGOF, ****P < 0.0001; day 0 versus day 4–5 WT, **P = 0.0027; day 4–5 βcatGOF versus day 4–5 WT, **P = 0.0032. n = 3 mice each. Violin plot n (in order x axis) = 336, 231 and 198 cells from three mice. Scale bar, 50 µm. NS, not significant. Panel b created with BioRender.com. Source data
Fig. 3
Fig. 3. βcatGOF and WT neighbour cells have different trajectories of redox recovery over time.
a, NAD(P)H/FAD intensities and H2BmCherry expression (white; indicates βcatGOF cells) from same region (outlined in yellow from larger regions shown in as Extended Data Fig. 3a) in K14CreER; βcatGOF; LSL-H2BmCherry mice revisited 5 days and 10 days after tamoxifen administration. b, Insets outlined in white from panel A, highlighting regions across time wherein (i) βcatGOF cells at day 5 and day 10 show little change of redox ratio and (ii) βcatGOF cells (H2BmCherry-positive) are replaced with WT cells (H2BmCherry-negative), which have recovering redox ratios. c, Redox differential between mutant βcatGOF cells (H2BmCherry-positive) normalized to neighbouring WT cells (H2BmCherry-negative) at day 4–6 and day 9–11 post-tamoxifen shows that redox differential between βcatGOF cell and neighbouring WT cells increases between 5 and 10 days because of the selective recovery of WT cells. Extended Data Fig. 2e shows same data plotted with respect to day 0. P value (two-sided t-test) from n = 3 mice each. *P = 0.012; ***P = 0.0002 Violin plot n (in order x axis) = 323, 198, 273 and 227 cells. d, At day 10 post-tamoxifen, the βcatGOF cells (H2BmCherry-positive) are pushed to the suprabasal region, indicating differentiation (top), whereas WT cells occupy the basal layer (middle). Both layers can be see seen in the xz section (bottom) with the blue outline indicating the epidermal–dermal interface. e, The βcatGOF mosaic basal stem cell layer 5 days post-tamoxifen harbours adjacent patches of WT (H2BmCherry-negative; yellow outline) and mutant cells (H2BmCherry-positive), which were revisited 10 days post-tamoxifen; WT patches (regions outlined in yellow) expanded between day 5 and day 10. f, Graph shows area occupied by WT cells from the same 300 × 300 µm2 regions (n = 6) from three mice quantified and shows an increase in coverage between day 5 and day 10. P = 0.0015 (paired t-test, two-sided). Scale bar, 50 µm. Source data
Fig. 4
Fig. 4. Cells with HrasG12V mutation first show a drop in NAD(P)H/FAD which recovers over time.
a, NAD(P)H/FAD intensities from same epidermal regions (outlined in yellow from larger regions shown in Extended Data Fig. 4a) revisited at 0, 5–6 and 10–13 days post-tamoxifen and expression of HrasG12V and H2BmCherry (white) from K14CreER; HrasG12V; LSL-H2BmCherry mice. b, Insets from white outlined regions in a. Regions consisting of HrasG12V and WT cells side by side show that at day 5 (left) HrasG12V (H2BmCherry-positive; outlined by white dotted line) cells have a lower NAD(P)H/FAD intensity than WT cells (H2BmCherry-negative). At day 10 (right), HrasG12V (H2BmCherry-positive) cells have increased and recovered their NAD(P)H/FAD intensities to be similar to neighbouring WT cells (H2BmCherry-negative). c, Quantification of NAD(P)H/FAD intensities from HrasG12V (H2BmCherry-positive) cells normalized to their WT neighbours (H2BmCherry-negative) at day 4–5 (left) and day 10–13 (right) to show that redox differential day 4–5 is flattened by day 10–13. This is in contrast with βcatGOF epidermis in which the redox differential between mutant and WT increases (Fig. 3c). The average value from each mouse is labelled with a different colour. Average redox P value (two-sided t-test) from four mice, **P = 0.0044 for day 4–5 HrasG12V versus WT; not significantly (NS) different for day 10–13 HrasG12V versus WT. Violin plot n (in order x axis) = 425, 228, 560 and 226 cells from four mice. Extended Data Fig. 4b shows the same data plotted with respect to day 0. Scale bar, 50 µm. Source data
Fig. 5
Fig. 5. Changes in glucose catabolic fluxes underlie altered NAD(P)H and FAD changes in mutant conditions.
a, Schematic showing the labelling of carbon (red) in downstream metabolites when mice are infused with 13C6 glucose. The readouts which pertain to reduced NADH in the cytosol are labelled in pink and those pertaining to mitochondrial metabolism are labelled in blue. b, The ratio of 13C2-acetyl-coA/13C3-alanine, also called VPDH/VCS, represents the percentage of TCA cycle fuelled by glucose. When compared with WT control, this ratio increase to almost a 100% showing that the βcatGOF and HrasG12V are utilizing glucose maximally for TCA cycle and downstream glucose oxidation. n = 8 (control), 6 (βcatGOF) and 5 (HrasG12V) mice, P values, ****P < 0.0001; ***P = 0.0005. c, Another measure of TCA flux, 13CO2 normalized to 13C6 glucose, also increases in both mutants. n = 9 (control), 8 (βcatGOF) and 5 (HrasG12V) mice P value, ***P = 0.0003; **P = 0.0058. d, In contrast, labelled pyruvate normalized to labelled glucose is unchanged in both mutants. n = 8 (control), 7 (βcatGOF) and 5 (HrasG12V) mice. e, Labelled lactate relative to glucose, is decreased in βcatGOF, whereas in the HrasG12V epidermis, the 13C3 labelled lactate to 13C6 glucose ratio is increased. Hence the mutant HrasG12V epidermis makes more lactate from pyruvate when compared to the βcatGOF tissue, in which this conversion is lower than WT controls. n = 9 (control), 8 (βcatGOF) and 5 (HrasG12V) mice, P values, ****P < 0.0001;***P = 0.0002. f, 13C2-labelled glutamate to acetyl-CoA is a measure of the dilution of the label due to glutamine entry into the TCA cycle. n = 8 (control), 7 (βcatGOF) and 5 (HrasG12V) mice. The nearly 100% ratios suggest that there is not much entry of glutamine. This is not significantly different in either mutant epidermis when compared with WT epidermis. All graphs use a one-way ANOVA (multiple comparisons with respect to control). Each point represents epidermis (ear) from one mouse. All box plots show all points with whiskers going from minimum to maximum with a line at the median. Source data
Fig. 6
Fig. 6. Metformin treatment inhibits βcatGOF mutant-induced epidermal outgrowths and reverses cell-competition outcome.
a,b, In βcatGOF mice (K14CreER; βcatGOF; LSL-H2BmCherry), treated with metformin, 5 days post-induction of mutation in a mosaic manner, there is no change in redox ratio in both recombined H2BmCherry-positive (white nuclei) βcatGOF mutant cells and WT neighbours (H2B-mCherry-negative), when compared with day 0 (before recombination; images in Extended Data Fig. 7e), plotted in b. One-way ANOVA of averages and nested with multiple comparisons shows no significant changes. Violin plot: n (in order x axis) = 326, 228 and 201 cells from three mice. Extended Data Fig. 7f plots the same data with mutant and WT neighbours compared with each other. Scale bar, 10 µm. c, Maximum projection of z-stacks from epidermis and dermis with epidermal H2BmCherry-positive βcatGOF mutant cells (white) and collagen through second harmonic imaging (SHG; yellow) in vivo (magnified in red insets). In βcatGOF mutant animal epidermal outgrowths are visible at week 3 post-induction (day 19–21) protruding into the dermis (video through the z-section also in Supplementary Video 6). Upon metformin treatment, these epidermal protrusions are no longer visible in the maximum projections through dermis (see i for schematic). d, The depth of epidermal protrusion from the top of the cornified layer from fixed epidermal preps from βcatGOF mice compared with βcatGOF mice given metformin. The depth is colour-coded according to the lookup table (LUT) bar on the left and quantified in the graph in g. While the βcatGOF epidermis has deeper (yellow/red) epidermal outgrowths at week 3, these outgrowths are either absent or greatly reduced in size when mice are given metformin. Scale bar, 100 µm (c,d). e, When the βcatGOF animals are revisited after 2.5 months, H2B-mCherry-positive βcatGOF cells (white nuclei) are largely absent from regions they previously occupied at week 3. f, In contrast, βcatGOF animals treated with metformin when revisited at 2 months, still retained most of the H2B-mCherry-positive βcatGOF cells. Both e and f are zoomed-in regions cropped from larger ~1.8 mm2 regions in Extended Data Fig. 9a,b where these differences in mutant cell occupancy can be observed too. g, Thickness from the top of the epidermis to the bottom plotted (images in D) showing reduction in the depth of outgrowths βcatGOF mutant epidermis when treated with metformin. n, average thickness from nine regions per mouse of size 400–500 µm2 from five mice for mutant and metformin-treated. P value ****P<0.0001 (two-sided t-test). h, Percentage of the area occupied by mutant (H2BmCherry-positive cells) quantified (images in e,f; Extended Data Fig. 9a,b) n = 3-4 regions per mice (size 700–1,200 µm2) from three mice each. P value ****P < 0.0001 (two-sided t-test) Data are presented as mean ± s.d. (g,h). Scale bar, 50 µm (e,f). i Schematic showing temporal sequence of events in βcatGOF mutant epidermis where mutant cells are contained in epidermal outgrowths at weeks 2–3 (leading to expansion of WT cells in the basal layer; Fig. 3e,f), followed by extensive elimination of mutant cells by 2–2.5 months. Source data
Fig. 7
Fig. 7. Metformin treatment inhibits HrasG12V mutant-induced tissue phenotypes and reverses cell-competition outcome.
a,b, In HrasG12V mice (K14CreER; HrasG12V; LSL-H2BmCherry), treated with metformin, 5 days post-induction of mutation in a mosaic manner, there is no change in redox ratio in both recombined H2BmCherry-positive (white nuclei); HrasG12V mutant cells and WT neighbours (H2B-mCherry-negative), when compared to day 0 (before recombination; images in Extended Data Fig. 7g); plotted in b. A one-way ANOVA of averages and nested with multiple comparisons shows no significant changes. Violin plot, n (in order x axis) = 307,196 and 136 cells from three mice. Extended Data Fig. 7h plots same data with mutant and WT neighbours compared to each other. c,d, The increase in epidermal thickness (colour-coded in the LUT bar on left) in HrasG12V mutant epidermis is inhibited upon treatment with metformin both 4–5 days (thickest) and 9–11 days post-mutation induction. xz sections showing epidermal nuclei between cornified layer (red dotted line) and collagen imaged through second harmonic signal in yellow shows hyper-thickening in HrasG12V mutant mice compared to metformin-treated mutant mice, compare top (HrasG12V) to bottom (HrasG12V + metformin). The hyper-thickening is mostly resolved by day 9–11 in HrasG12V mice. e, Graph quantifying epidermal thickness shown in images in c,d. The same regions were revisited between days 4–5 and day 9–11. n = 3 regions of interest each of 300 µm2 from three mice for mutant and metformin-treated. P value (two-sided t-test) ****P < 0.0001; ***P = 0.0002. f, Cell density in the basal stem cell layer quantified at day 9–10 from epidermal preps shows metformin treatment inhibiting the enhanced density in HrasG12V mice; also seen in the xy panels shown in d; compare top (HrasG12V) to bottom (HrasG12V + metformin), n = five 250-µm2 regions from three mice each. P value (two-sided t-test) ****P < 0.0001. g,h, pH3-positive dividing cells in HrasG12Vmice and HrasG12V mice treated with metformin show a decrease in the proliferation rate quantified in h. n = 3, 4 mice each for Hras and Hras + metformin (normalized from 900–1,200 µm2 regions). P value (two-sided t-test) *P = 0.026. Data are presented as mean ± s.d. (e,f,h). Scale bar, 50 µm (ag). i, Model showing metabolic rewiring drives tissue phenotypes that result in opposite cell-competition outcomes. Upon induction of βcatGOF and HrasG12V mutations there is a rapid reduction in NAD(P)H/FAD of epidermal stem cells in both mutant and WT cells at early time points, indicating a more-oxidized redox ratio. The mutant epidermis also enhances relative flux of glucose through the TCA cycle and mitochondrial oxidation consistent with more-oxidized cellular redox. Revisits over time reveal that in the βcatGOF mutant model, the redox differential between winner WT cells neighbouring the mutant cells is maintained, whereas in the HrasG12V mutant model, the redox differential is only transient and flattens over time. In parallel, the βcatGOF mutant cells are outcompeted by WT cells and the HrasG12V cells expand in the basal stem cell layer of the epidermis. Upon mild inhibition of mitochondrial oxidation by metformin, the redox drop in the mutant mosaic epidermis is inhibited and tissue phenotypes downstream are also inhibited, leading to inhibition of the cell-competition outcome, the elimination of βcatGOF cells and proliferative advantage of HrasG12Vcells. Source data
Extended Data Fig. 1
Extended Data Fig. 1. Imaging NAD(P)H and FAD.
a. NAD(P)H/FAD intensities from HEK293T cells treated with 4 mM Sodium cyanide imaged after 5 minutes of adding cyanide. NAD(P)H/FAD ratio rapidly increases in response to the inhibition of Complex IV and oxidative phosphorylation, as expected, because blockage of mitochondrial electron transport leads to accumulation of NAD(P)H in the cells. n(In order x axis) = 86, 78 cells. representative of 2 independent replicates b. Revisits- Skin area to be imaged (ear) is flattened under a coverslip and a tattoo (made 5 days before imaging) placed at a stereo-typical distance from visible landmarks like blood vessels is used to identify the larger (1800×1800 µm2 6 by 6 stitched tiles of 300 µm2) regions. The characteristic pattern of hair follicles (please see numbers labelled in Day 0 and Day 5 images for easier identification of the same follicles) in relation to the tattoo is used to identify the same region of skin and imaged as a revisit. Scale bar = 100 µm c. The same region of the basal epidermis is imaged over 2 hours from non-hairy epidermis (paw) to show that pattern of NAD(P)H per-cell intensity are stable in their spatial distribution although there are small fluctuations in intensity. d. The second harmonic signal (SHG) from collagen in regions from Fig. 1c and d at 0 hours and revisited after 24 hours. The collagen fibrils and blood vessels (outlined in red dotted line) are used to identify the same region of epidermis. e. 3D projection from the Imaris software used to isolate the basal layer. After thresholding and surfacing the second harmonic signal (SHG) using the Distance-Transform function in Imaris, pixels from selected distances from the epidermal-dermal interface are isolated and projected to isolate the basal layer. f. NAD(P)H from Basal (left) and suprabasal (right) layers isolated at different distances from the epidermal-dermal interface as described in A-F. cf, Scale bar, 50 µm. Source data
Extended Data Fig. 2
Extended Data Fig. 2. Morphological and Behavioural changes in the βcatGOF mutant epidermis follow redox changes.
a. β-catenin immunofluorescence staining (grayscale) in the basal layer of epidermis from large regions in mice of genotype K14CreER; βcatGOF 5 and 15 days’ post-tamoxifen-induced recombination and expression of βcatGOF, similar to Fig. 2a. Control shown is from littermate without mutation 5 days post-tamoxifen. The morphology of the basal layer is indistinguishable between Day 0 and Day 5. However, at Day 15, several aberrant structures (placodes) are visible (examples: red arrows) in the basal layer with stacked layers of nuclei enriched in β-catenin. More magnified images of these regions are in Fig. 2a. b. phosho-Histone 3 (pH3-green) and β-catenin staining in epidermis at Day 0 (before tamoxifen), Day 5, and Day 15 post-tamoxifen. c. pH3 positive nuclei were counted and quantified from 400×400 µm2 regions averaged from multiple mice. n = 8 (Control), 5(Day 5 βcatGOF), 6 (Day 15 βcatGOF). **** = p value < 0.0001, ns = not significant (One-way ANOVA; Multiple comparisons with respect to Control/Day 0). Data are presented as Mean ± SD d. The larger regions from which the epidermal revisits magnified in Fig. 3a (outlined in yellow) are shown. White nuclei (H2BmCherry-positive) label the cells that are recombined and hence are considered βcatGOF mutant in mice of genotype K14CreER; βcatGOF; LSL-H2BmCherry. e. Same data in Fig. 3c plotted in comparison to Day 0. Cells expressing βcatGOF (H2BmCherry+) have low NAD(P)H/FAD ratio at Day 4–5 and 9–11 post-tamoxifen. WT cells (H2BmCherry -) recover their NAD(P)H/FAD ratio at Day 9–11 (not significantly different from control). Average redox (coloured dots) from 3 mice each. p value for Control vs all categories (RM One-Way ANOVA; Multiple measures) **<0.0023; *= 0.0133; ns- not significant. Violin plot n(in order x axis)=379, 323, 198, 273, 227 cells from 3 mice. Scale bar= 50 µm. Source data
Extended Data Fig. 3
Extended Data Fig. 3. WT cells outcompete βcatGOF after 1–2 months while the majority of the remaining βcatGOF cells are found in placodes that extend into the dermis.
a. Z-projections from large regions of skin above the epidermal-dermal interface from Control (genotype: K14CreER; LSL-H2BmCherry) and βcatGOF-induced mice (genotype: K14CreER; βcatGOF; LSL-H2BmCherry) shows similar rates of recombination, with recombined cells (mCherry+; white nuclei) representing control (left) or mutant cells (right) 5 days after recombination covering ~80% of the epidermis five days post-tamoxifen. However, after two months (bottom panel), while control tissue shows no major differences in the coverage of recombined white nuclei, large regions of βcatGOF epidermis are free of the recombined mutant cells (white nuclei). The graph on right quantifies the percentage of area covered by recombined cells at 2 months with control epidermis showing 80% occupancy (graph right), while βcatGOF epidermis has only ~20% of their area covered by recombined mutant cells. b. The majority of recombined mutant cells (H2BmCherry-positive; white nuclei) extend in sub-epidermal structures taking up ~20 % of the sub-epidermal space compared to negligible coverage of H2BmCherry-positive epidermal cells in controls. A-B- ****= p value < 0.0001 (2-sided t-test) from ~1200–1400 µm2 regions n = 7 (Control), 6 (βcatGOF) regions from 3 mice. Data are presented as Mean ± SD. c. In non-hairy skin (paw), the βcatGOF-induced cells (H2BmCherry-positive; white nuclei) are found in long-lived hair follicle-like structures in the βcatGOF-induced epidermis (right). In contrast, in control tissue (K14CreER) the second harmonic signal (SHG) from collagen in dermis (yellow) is uninterrupted by hair follicles. XZ sections show the placode-like structures with βcatGOF cells that extend into the dermis with an altered NAD(P)H signal that interrupts the collagen (SHG). Scale bar=50 µm. Source data
Extended Data Fig. 4
Extended Data Fig. 4. Revisits of the same epidermal regions shows different cell-competition phenotypes and redox changes in the HrasG12V mutant model.
a. White nuclei (H2BmCherry-positive) label cells that are recombined and carry the HrasG12V mutation in mice of genotype K14CreER; HrasG12V; LSL-H2BmCherry. b. Same data in Fig. 4c plotted in comparison to Day 0. NAD(P)H/FAD intensities from HrasG12V cells within the epidermis at Day 4–5, and Day 10–13 post-tamoxifen compared to Day 0 or the control littermate (K14CreER;LSL-H2BmCherry) imaged on the same day under same imaging conditions. Average redox of only Day 4–5 HrasG12V cells are significantly different from Control. Day 4-5 WT and Day 10-13 HrasG12V and WT cells are not significantly different. The HrasG12V cells have a redox differential at Day 4-5 that is flattened by Day 10-13 as plotted in Fig. 4c. p value (2-sided t-test) *= 0.011 (n = 3 mice each -coloured dots). Violin plot n(in order x axis)=317, 316, 129, 347, 152 cells from 3 mice. c. Images showing NAD(P)H/FAD intensities from the basal stem cell layer of control animals and animals given DCA (Dichloroacetic acid) for 5 days in Fire(left) and HiLo(right) LUT scales showing reduction in DCA-treated mice. d. Schematic explaining the direction of redox change and the corresponding changes in glycolysis, TCA cycle and mitochondrial oxidation. The more reduced redox ratio (high NAD(P)H/ FAD) corresponds to inhibition of mitochondrial oxidation and conversely more oxidized redox ratio (low NAD(P)H/ FAD) corresponds to increased glucose oxidation. Scale bar= 50 µm. Source data
Extended Data Fig. 5
Extended Data Fig. 5. Metabolite pathways differentially enriched or depleted in βcatGOF and HrasG12V mutant epidermis.
Pathway enrichment analysis after untargeted metabolomics with differentially enriched or decreased metabolites in βcatGOF (A) and HrasG12V (B). Upregulated concentrations are indicated by orange colour and downregulated by blue colour. The region within the red dotted lines highlights the altered metabolites in glycolysis and TCA cycle. Lists of all differentially enriched or depleted metabolites and pathways that have more than 2 hits altered in βcatGOF and HrasG12V epidermis when compared to control are shown in Supplementary Table 1.
Extended Data Fig. 6
Extended Data Fig. 6. Relative fluxes of metabolites after 13C6- glucose infusion.
a. Schematic showing the labelling of carbon (red) in downstream metabolites when mice are infused with 13C6 glucose- repeated from Fig. 5a. b. 13C2Glutamate/ 13C3-Alanine also a measure of VPDH/VCS, (or the percentage of TCA cycle fuelled by glucose) is upregulated in βcatGOF and HrasG12V mutant epidermis. n = 13(Control), 7(βcatGOF), 5(HrasG12V) mice. p value *** = 0.0004. * = 0.0261. c. Less 13C-labelled lactate is generated from pyruvate in βcatGOF mutant epidermis and more is generated in HrasG12V. n = 8(Control), 7(βcatGOF), 5(HrasG12V)mice. p value **= 0.0058(βcatGOF); **=0.0024 (HrasG12V). d. Percentage of labelled glutamine as a fraction of total glutamine is unchanged in βcatGOF when compared to wild-type littermates. The labelled fraction of glutamine increase in HrasG12V suggesting more carbon entry from glucose into glutamate and glutamine. n = 8(Control), 6(βcatGOF), 5(HrasG12V) mice. p value ****<0.0001. e. Labelled Glutamine/Glutamate ratio does not change significantly n = 8(Control), 6(βcatGOF), 5(HrasG12V) mice f. 13C label dilution between malate and glutamate, products of TCA cycle show very little dilution (>90%) and no significant change between the mutant models and control animals. n = 8(Control), 7(βcatGOF), 5(HrasG12V) mice g-j- Mice infused with 13C6 glucose for 90 minutes and 120 minutes in vivo show no significant differences in VPDH/ VCS (G), 13CO2/ 13C6 Glucose (H), 13C3 -Pyruvate / 13C6 Glucose (I) or 13C3 -Lactate / 13C6 Glucose. Thus, isotopic steady state is achieved in the skin within two hours of infusion. n = 7(90 min), 5(120 min) mice. One -way Anova with Multiple comparisons with Control was used for B-F and 2-sided t-test for G-J. Each point on the plots represents a mouse replicate. All box plots show all data with whiskers going from minimum to maximum with line at the median. Source data
Extended Data Fig. 7
Extended Data Fig. 7. Wild-type epidermis does not show changes in morphology or proliferation upon Metformin treatment.
a-b. Number of phospho-histone H3 (white) per 400×400 µm2 was counted from wild-type epidermal preps and wild-type mice administered metformin similar to mutant conditions in Figs. 6 and 7 and plotted on the graph on right showing no differences (2-sided t-test) -numbers averaged from 3 regions each per mice; n = 3 mice each (plotted as dots). Data are presented as Mean ± SD. The morphology, and cell density of the basal layer also do not show any obvious changes. c. Keratin 10 staining of the basal layer (Max projection of 3 z-stack of 0.5 um step size) also do not show any obvious change in the pattern between control and Metformin-treated wild-type mice. d. Thickness of the epidermis as shown in the representative images in the z-sections do not show any obvious differences between control and Metformin-treated wild-type mice. e. Day 0 images of mutant mice revisited in Fig. 6a (βcatGOF + Metformin) f. Graphs comparing WT neighbours and H2Bmcherry+ βcatGOF mutant cells in the same animals derived from graph in Fig. 6B. 2-sided t-test of averages and nested t-test show no significant differences. n(left to right)= 200, 288 cells from 3 mice. g. Day 0 images of mutant mice revisited in Fig. 7a (HrasG12V+ Metformin). h. Graphs comparing WT neighbours and H2Bmcherry+HrasG12V mutant cells in the same animals derived from graph in Fig. 7B. 2-sided t-test of averages and nested t-test show no significant differences. n(left to right)= 136,196 cells from 3 mice. Scale bar = 50 µm. Source data
Extended Data Fig. 8
Extended Data Fig. 8. Inhibition of metabolic rewiring upon Metformin treatment.
Graphs showing 13C6- glucose -derived labelling in glycolysis and TCA readouts after in vivo infusion of 13C6- glucose from epidermis of βcatGOF, HrasG12V and wild-type littermates with or without metformin administration. Please note that all data without metformin (left side of A-F) for Control, βcatGOF and HrasG12V animals are the same data shown in Fig. 5b–f and Extended Data Fig. 6c. They have been plotted here again only for comparison with animals when administered metformin. a. The ratio of 13C2- Acetyl CoA/ 13C3- Alanine also called VPDH/VCS that represents the percentage of TCA cycle fuelled by glucose, is reduced in Control, βcatGOF and HrasG12Vanimals treated with metformin (right half) when compared to animals without treatment (left- also in Fig. 5b). The differences between mutant and controls are flattened after metformin treatment. b. Another measure of TCA flux, 13CO2 normalized to 13C6 glucose, is also reduced when all three genotypes are administered metformin (right half). The differences between between mutant and controls are flattened. c-d. In contrast, Labelled Lactate relative to glucose (C), and relative to pyruvate (D) goes up in wild-type (Control) and βcatGOF when animals are administered Metformin. HrasG12V epidermis which already had higher 13C3- lactate/13C3- pyruvate is not significantly different between Metformin-treated and untreated animals.; e. 13C2 labelled Glutamate to Acetyl CoA is a measure of the dilution of the label due to glutamine entry into the TCA cycle. There is a modest dilution (upto 85%) in wild-type (Control) and βcatGOF animals’ indicative of glutamine anaplerosis in animals treated with metformin when compared to animals without metformin (left– also in Fig. 5f). There is no significant change in HrasG12V animals treated with metformin. f. While there are no changes in labelled pyruvate relative to glucose in wild-type (Control) and HrasG12Vanimals upon metformin treatment, there is a small increase in βcatGOF animals upon metformin treatment. Each point represents epidermis (ear) from one mouse. Statistics: One-Way ANOVA – Multiple comparisons shown between Control and Control +metformin; βcatGOF and βcatGOF+ metformin; HrasG12V and HrasG12V + metformin. n = 7 (Control + metformin), 3 (βcatGOF+ metformin) 6 (HrasG12V + metformin). All p values from A-F are displayed on top of each comparison (Control versus Metformin-treated for all genotypes). Statistics reported for Control vs βcatGOF and HrasG12V (left) in Fig. 5b–e and Extended Data Fig. 6c. All box plots show all data points with whiskers going from minimum to maximum with line at the median. Source data
Extended Data Fig. 9
Extended Data Fig. 9. Large regions of mutant βcatGOF epidermis shows inefficient elimination after administration of Metformin.
a. Revisits between Week 3 and 2.5 months show large regions (~1.4 mm) from βcatGOF mice (K14CreER; βcatGOF; LSL-H2Bmcherry). Whereas most of the epidermis was covered by recombined mutant H2Bmcherry-positive cells (white nuclei) at Week 3 post-induction, after 2.5 months, the epidermis is largely clear of the recombined mutant cells and they cover only ~15 % of the total area (quantified in Fig. 6h). b When βcatGOF mice are administered metformin and revisited, the recombined H2Bmcherry-positive mutant cells (white nuclei) still cover large areas of the epidermis at 2.5 months (~60 %), showing inefficient elimination. Yellow insets in A and B are magnified in Fig. 6e and f. c. Wild-type epidermis does not show much change in percentage of area covered by recombined H2Bmcherry-positive cells over time once induced, retaining ~80% coverage (quantified in Extended Data Fig. 3a). Scale bar = 100 µm. Tattoos were used to identify the same large areas for revisits. While exact regions could be identified using hair follicle patterns for Wild-type as described before, approximate areas were identified using the manually applied tattoo for the mutant epidermis since the epidermal outgrowths and morphological aberrancy at Week 3 make exact identification of the same hair follicles difficult.
Extended Data Fig. 10
Extended Data Fig. 10. βcatGOF mutant administered metformin show alterations in patterns of Keratin 10 differentiation marker.
a. Phospho-histone H3 staining (white) from epidermal preps of βcatGOF mice (K14CreER; βcatGOF; LSL-H2Bmcherry) and βcatGOF mice administered Metformin. The metformin-treated mice still have a hyperproliferative epidermis at Day 15 when compared to mutant mice, quantified in graph b. There is a slight reduction in pH3 number (per 3-4 400 µm2 regions averaged from multiple mice plotted as dots) although not statistically significant (ns) between metformin-treated and untreated βcatGOF mice. Both metformin-treated and untreated βcatGOF mice are hyperproliferative when compared to wild-type epidermis (control). p value (One -Way ANOVA) ****<0.0001; *= 0.012. Please note that data plotted in Extended Data Fig. 2c has been replotted in B for comparison between earlier replicates of βcatGOF mice and Wild-type (control) mice with 3 mouse replicates each for βcatGOF and βcatGOF + Metformin added additionally. Data are presented as Mean ± SD. c. 3D projections (rendered in Imaris) of the basal layers of βcatGOF mutant epidermis at Day 15 with ectopic clusters of Keratin 10 differentiation marker arranged concentrically around outgrowths (yellow arrows) with pH3 around them. d. In contrast, 3D projections of the basal layer of βcatGOF mutant mice administered metformin shows more typical Keratin 10 staining like wild-type epidermis (Extended Data Fig. 7c). Scale bar = 50 µm. Source data

References

    1. Martincorena, I. & Campbell, P. J. Somatic mutation in cancer and normal cells. Science349, 1483–1489 (2015). - PubMed
    1. Martincorena, I. et al. High burden and pervasive positive selection of somatic mutations in normal human skin. Science348, 880–886 (2015). - PMC - PubMed
    1. Yizhak, K. et al. RNA sequence analysis reveals macroscopic somatic clonal expansion across normal tissues. Science. 10.1126/science.aaw0726 (2019). - PMC - PubMed
    1. Tomasetti, C. Mutated clones are the new normal: measuring and understanding the dynamics of clonal cell populations is key for cancer prevention. Science364, 938–939 (2019). - PubMed
    1. Brown, S. et al. Correction of aberrant growth preserves tissue homeostasis. Nature548, 334–337 (2017). - PMC - PubMed

MeSH terms

LinkOut - more resources