. 2025 Feb;44(4):1131-1153.
doi: 10.1038/s44318-024-00332-w. Epub 2025 Jan 6.

Developmental beta-cell death orchestrates the islet's inflammatory milieu by regulating immune system crosstalk

Affiliations

Developmental beta-cell death orchestrates the islet's inflammatory milieu by regulating immune system crosstalk

Mohammad Nadeem Akhtar et al. EMBO J. 2025 Feb.

Abstract

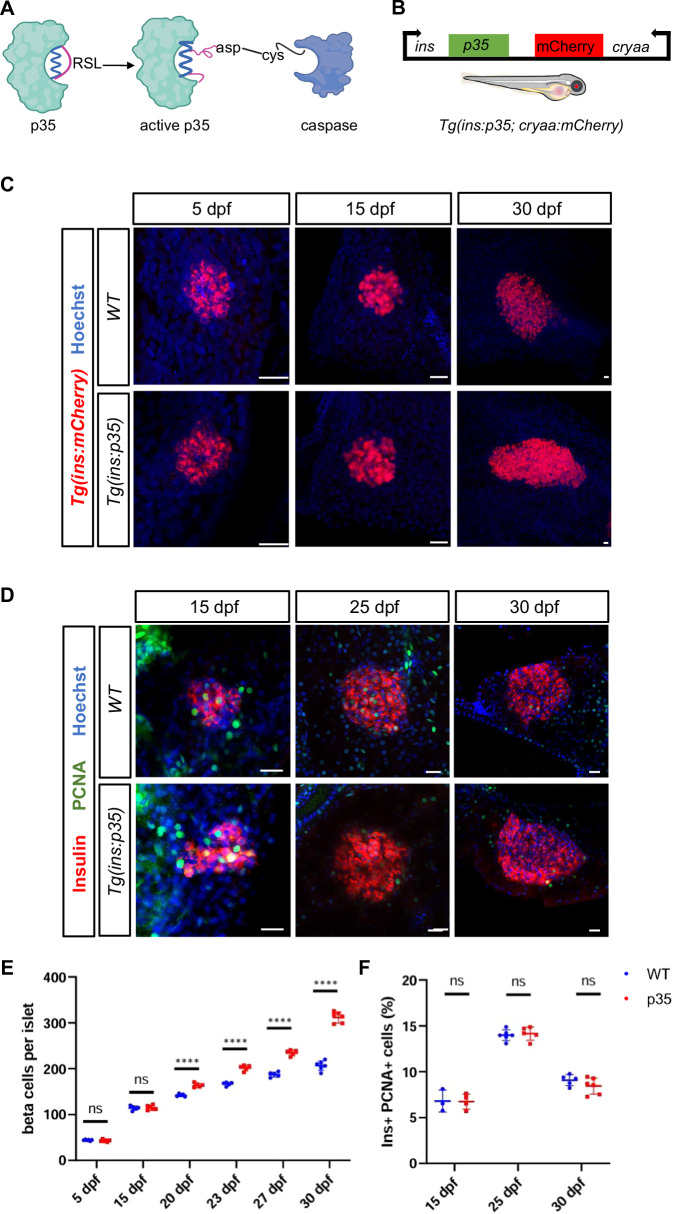
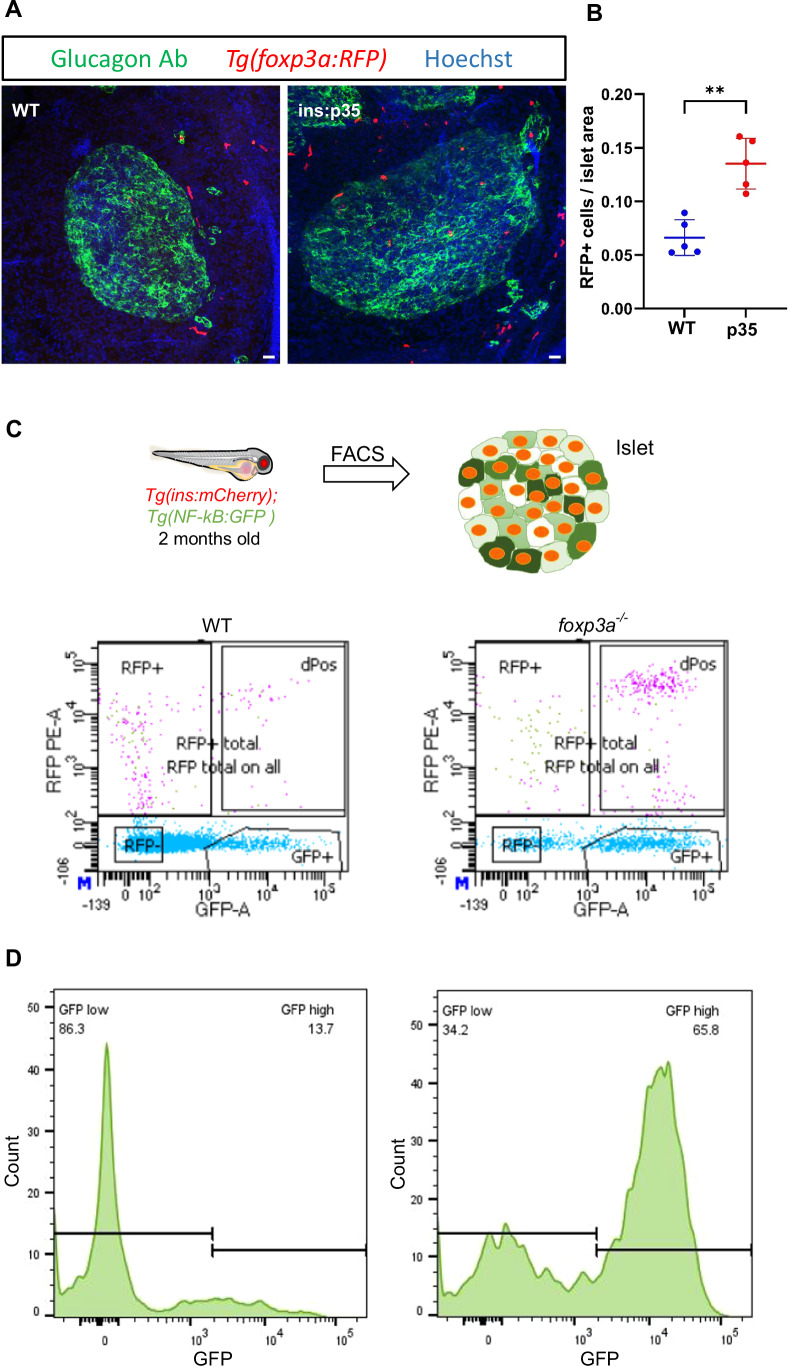
While pancreatic beta-cell proliferation has been extensively studied, the role of cell death during islet development remains incompletely understood. Using a genetic model of caspase inhibition in beta cells coupled with mathematical modeling, we here discover an onset of beta-cell death in juvenile zebrafish, which regulates beta-cell mass. Histologically, this beta-cell death is underestimated due to phagocytosis by resident macrophages. To investigate beta-cell apoptosis at the molecular level, we implement a conditional model of beta-cell death linked to Ca2+ overload. Transcriptomic analysis reveals that metabolically-stressed beta cells follow paths to either de-differentiation or apoptosis. Beta cells destined to die activate inflammatory and immuno-regulatory pathways, suggesting that cell death regulates the crosstalk with immune cells. Consistently, inhibiting beta-cell death during development reduces pro-inflammatory resident macrophages and expands T-regulatory cells, the deficiency of which causes premature activation of NF-kB signaling in beta cells. Thus, developmental cell death not only shapes beta-cell mass but it also influences the islet's inflammatory milieu by shifting the immune-cell population towards pro-inflammatory.

Keywords: Dedifferentiationp; Excitotoxicity; Macrophage; T Regulatory Cell; Type 1 Diabetes.


Conflict of interest statement

Disclosure and competing interests statement. The authors declare no competing interests.

Figures

Figure 1
Figure 1. Genetic overexpression of p35 leads to beta-cell expansion in juvenile zebrafish.
(A) Schematic showing the baculovirus P35 protein and its mechanism of caspase inhibition. RSL indicates the reactive site loop of P35 (B) Diagrammatic representation showing the genetic construct used to generate the transgenic model of caspase inhibition in beta cells. p35 was cloned under the control zebrafish insulin promoter. mCherry expression under the control of the crystalline (cryaa) promoter serves as a marker of transgenic animals. (C) Representative confocal images (maximum projection) of primary islets from Tg(ins:mCherry) and Tg(ins:p35); Tg(ins:mCherry) at 5, 15, and 30 dpf. Immunostaining against insulin is used to mark the beta cells (in red) while the nuclei are stained with Hoechst (in blue) of 5 dpf WT and Tg(ins:p35) larvae. The beta cells of 15 and 30 dpf WT and Tg(ins:p35) animals are marked using Tg(ins:mCherry) reporter in red. Scale bar, 20 µm. (D) Representative confocal images (single plane) of primary islets from WT and clutch mate Tg(ins:p35) animals at 15, 25, and 30 dpf. Immunostaining against insulin (red) and PCNA (green) marks the beta cells and the proliferating cells, respectively. The nuclei are stained using Hoechst. Scale bar, 20 µm. (E) Quantifications of the number of beta cells in Tg(ins:mCherry) and Tg(ins:p35); Tg(ins:mCherry) animals at 5, 15, 20, 23, 27, and 30 dpf. Each dot represents the number of beta cells per islet. Error bars are mean ± SD. Unpaired two-tailed t-test with Welch’s correction, 5 dpf (ns not significant, p = 0.141307), 15 dpf (ns not significant, p = 0.903301), 20 dpf (****p = 0.000025), 23 dpf (****p = 0.000006), 27 dpf (****p = 0.000001), and 30 dpf (****p = 0.0000000194). n = at least 5 independent samples per group. (F) Quantification showing the percentage of insulin and PCNA double-positive cells per islet in WT and Tg(ins:p35) animals at 15, 25, and 30 dpf. n = at least 3 independent samples per group at each developmental stage. Error bars are mean ± SD. Unpaired two-tailed t-test with Welch’s correction, ns not significant. Source data are available online for this figure.
Figure 2
Figure 2. Mathematical model.
(A) Sketch of five processes and two subpopulations of beta cells considered in the mathematical model. Np(t) is the time-dependent number of proliferative beta cells and Nq(t) of quiescent beta cells. Proliferative cells from Np(t) may reversibly switch to the quiescent state Nq(t) with a rate ki and back to proliferation with a rate ka. Cell cycle duration is Tc, neogenesis rate is v, and death rate is δ. The latter two processes affect both subpopulations. Cell death is initially absent and starts at an estimated onset time of 16.3 dpf. (A’) Results of the fitted model for WT (black) and p35 (red) conditions, respectively. Experimental data at the time points 5, 15, 20, 23, 27, and 30 dpf (from Fig. 1E; Appendix Fig. S1B) is shown as the mean (circle) and 2 SD (risers). Color code as shown on the top of panel A’: blue and red circles represent experimental data of beta-cell numbers in WT and p35, respectively; black solid line and red dashed line depict the model simulation of WT and p35. n = at least 5 independent samples per group at each developmental time point. (B-B’) Results for the model variant with 1-day short burst of cell death around 20 dpf. This variant is not able to represent the shallower slope for WT cell count data after 20 dpf. (C-C’) Results for model variant without cell death for both experimental conditions. All other model parameters were estimated; however, the best-fitting curves show large discrepancies for both conditions at 30 dpf, thereby falsifying the assumption of absent cell death. Error bars in A’-C’ are SEM. (D) Snapshots from simulation movie (Movie EV1) of a stochastic, cell-based model with the same mechanisms and parameter values as in (A) confirms the results from (A). Source data are available online for this figure.
Figure 3
Figure 3. Macrophage colonization coincides with the onset of developmental beta-cell apoptosis, and their depletion reveals developmental beta-cell apoptosis.
(A) Confocal images (single plane) of primary islets from Tg(ins:YFP); Tg(mpeg:mCherry) animals at 5, 21, and 33 dpf. Tg(ins:YFP) marks the beta cells (green), Tg(mpeg:mCherry) marks the macrophages (red), while immunostaining against glucagon labels the alpha cells (in magenta) present on the periphery of the islet. Macrophages (white arrows) are observed in contact with the islet at 21 dpf while they are absent at 5 dpf. At 33 dpf, macrophages have colonized the islet. Scale bar, 20 µm. (B) Quantification showing the number of mCherry-positive cells per unit area in the pancreatic islet at different stages of development. Error bars are mean ± SD from n = at least 4 independent samples per developmental time point. One-way ANOVA with Tukey’s multiple comparison test, *p = 0.0158, **p = 0.0088, ns not significant. (C) Confocal images (maximum projection) of primary islet from 30 dpf Tg(ins:YFP);irf8+/+ and Tg(ins:YFP);irf8−/− animals. Tg(ins:YFP) marks the beta cells (green), TUNEL staining labels the apoptotic cells (magenta), while Hoechst staining labels the nuclei (gray). White arrow points to TUNEL-positive beta cells. Scale bar, 20 µm. (C’) Insets show a high-magnification single plane with separate channels from the confocal stacks (corresponding to the area marked using a white dotted line in (C). Scale bar, 20 µm. (D) Quantification showing the percentage of YFP and TUNEL double-positive cells in the islet of Tg(ins:YFP);irf8+/+ and Tg(ins:YFP);irf8−/− animals. Error bars are mean ± SD from n = 5 independent samples per group. Unpaired two-tailed t-test with Welch’s correction, **p = 0.0081. Source data are available online for this figure.
Figure 4
Figure 4. Generation of a genetic model of beta-cell excitotoxicity in zebrafish.
(A) Structural representation of the transient receptor potential channel vanilloid channel (TRPV) and its mechanism of activation by the small molecule, capsaicin. (B) Schematic representation of the genetic construct used to generate the transgenic model of beta-cell Ca2+ excitotoxicity in zebrafish. The rat TRPV was cloned under the zebrafish insulin promoter. Cerulean expression under the control of the crystalline (cryaa) promoter serves as a marker of transgenic animals (blue eyes). (C) Representative snapshots from live imaging of larvae expressing GCaMP6s in the beta cells. The images depict beta-cell GCaMP6s fluorescence before and after capsaicin (csn) stimulation of control and TRPV-expressing beta cells. Scale bar, 20 µm. n = 3 independent samples per group. The time-stamp indicates minutes. (D) Traces and quantification of GCaMP6s fluorescence intensity over time for the islets shown in C. While the control larvae showed no perturbation in calcium dynamics, there was a sustained increase in calcium levels of the beta cells from Tg(ins:TRPV) larvae post csn-stimulation. The dot-plot graph shows the relative change in GCaMP6s fluorescence intensity after csn-stimulation in 5 dpf WT and TRPV larvae. Error bars are mean ± SD from n = 3 independent samples per group. Two-tailed t-test, *p = 0.0331. (E) Confocal images (maximum projection) of islets from Tg(ins:Kaede) and Tg(ins:TRPV);Tg(ins:Kaede) larvae following incubation with csn from 3 to 5 dpf. Tg(ins:kaede) marks the beta cells (green) while the nuclei are stained with Hoechst (blue). Scale bar 20 µm. (F) Quantifications of the number of beta cells per islet in control and Tg(ins:TRPV) larvae. Error bars are mean ± S D from n = at least 7 independent samples per group. The horizontal bar represents the mean value. Unpaired two-tailed t-test with Welch’s correction, ****p = 0.0000000219. (G) Plot showing average glucose value in WT and Tg(ins:TRPV) larvae following csn treatment for 48 h. Each dot corresponds to a pool of 10 larvae. Error bars are mean ± SD from n = at least 3 independent replicates per group. Unpaired two-tailed t-test with Welch’s correction, ****p = 0.000000351. (H) EdU-stained representative confocal images (maximum projection) of islets from Tg(ins:Kaede) and Tg(ins:TRPV);Tg(ins:Kaede) after photoconversion and treatment with csn from 3 to 5 dpf. The newly formed beta cells are marked with green; the pre-existing beta cells are in red/yellow, and EdU-positive cells are marked in gray. Scale bar 20 µm. (I) Quantification showing the percentage of proliferating (red/yellow) beta cells during csn treatment in both control and Tg(ins:TRPV). The horizontal bar represents the mean value. Error bars are mean ± SD from n = at least 5 independent samples per group. Unpaired two-tailed t-test with Welch’s correction, ns not significant (0.359). Source data are available online for this figure.
Figure 5
Figure 5. Beta cells experiencing Ca2+ excitotoxicity show transcriptional trajectories toward cell death or dedifferentiation.
(A) Schematic of the experimental design. (B) Uniform manifold approximation and projection plot depicting clusters of beta cells from all three samples. Clusters are numbered and color-coded according to the legend shown at the right. (C) The color-coded bar graph represents the cluster-wise distribution of beta cells from the three samples. (D) Dot plot indicating the expression levels and the percentage of cells expressing selected genes in each of the five beta-cell clusters. The size of the dot represents the percentage of cells expressing the gene in a particular cluster, while the color scale represents average expression of the gene in the cluster after scaling. (E) Beta-cell trajectory as suggested by pseudotime analysis with slingshot. The line connects the beta-cell clusters starting from 2, 1, 3, 4, and 5. (F) A schematic representation of our model based on single-cell transcriptomics. When experiencing chronic Ca2+ excitotoxicity, beta cells can undergo a reduction of beta-cell markers such as ins and pdx1. Some beta cells succumb to the stress, expressing cell death genes such as casp-3 (cluster 4), while others go further down the dedifferentiation path, expressing aldh1a3 and evading cell death (cluster 5).
Figure 6
Figure 6. Beta-cell death regulates the islet’s immune component and inflammation.
(A) Representative confocal images (maximum projection) of primary islets from 6 months old WT and Tg(ins:p35) animals in the transgenic background of Tg(mpeg:mCherry);Tg(tnfα:GFP). Immunostaining against insulin is used to label the beta cells (gray). Tg(mpeg:mCherry) reporter marks the macrophages (red), Tg(tnfα:GFP) marks the tnf-α expressing cells (green) while the nuclei are stained with Hoechst (blue). Scale bar 20 µm. (A’) Insets show high-magnification single planes from the confocal projection of the WT animal (corresponding to the area marked using a yellow dotted line in A). Scale bar, 20 µm. A subset of macrophages express tnf-α (yellow arrow) while others do not (white arrow). (B) Quantification showing the number of mCherry-positive cells per unit islet area in WT and Tg(ins:p35). Error bars are mean ± SD from n = 5 independent samples per group. The horizontal bar represents the mean value. Unpaired two-tailed t-test with Welch’s correction, ***P = 0.000494. (C) Quantification showing the percentage of mCherry and tnfα double-positive cells in the islet of WT and Tg(ins:p35) animals. Error bars are mean ± SD from n = 5 independent samples per group. The horizontal bar represents the mean value. Unpaired two-tailed t-test with Welch’s correction, **P = 0.003271. (D) Beta cells from 6 months old Tg(ins:mCherry);Tg(NF-kB:GFP) and Tg(ins:p35);Tg(ins:mCherry);Tg(NF-kB:GFP) animals were analysed using FACS. The data shows the results from the analysis of islets from n = 5 combined fish per group with two biological replicates. (E) The FlowJo graph shows GFP intensity (along the X-axis) and the distribution of beta cells from WT and Tg(ins:p35) animals, respectively. Horizontal lines indicate the division point between GFPlow and GFPhigh levels. Percentage values represent the proportion of cells with GFPlow or GFPhigh expression. Source data are available online for this figure.
Figure 7
Figure 7. Zebrafish Tregs populate the islets of p35-expressing beta cells and regulate the levels of islet inflammation.
(A) Representative confocal images (maximum projection) of primary islets from 6 months old WT and Tg(ins:p35) animals in the transgenic background of Tg(foxp3a:RFP). Immunostaining against glucagon marks the alpha cells (in green), Tg(foxp3a:RFP) marks the Tregs (in red), while Hoechst staining was done to label the nuclei (blue). Scale bar, 20 µm. (B) Quantification showing the number of RFP positive cells per unit islet area in WT and Tg(ins:p35). Error bars are mean ± SD from n = 5 independent samples per group. The horizontal bar represents the mean value. Unpaired two-tailed t-test with Welch’s correction, **P = 0.001. (C) Schematic showing the experimental setup for FACS. Beta cells from 2 months old WT and foxp3−/− mutants in the Tg(ins:mCherry);Tg(NF-kB:GFP) transgenic background were analysed using FACS for GFP expression. The data shows the results from the analysis of islets from n = 5 combined fish per group from two biological replicates. (D) FlowJo graph shows GFP intensity (along the X-axis) and the distribution of beta cells from WT and foxp3a−/ animals, respectively. Horizontal lines indicate the division point between GFPlow and GFPhigh levels. Percentage values represent the proportion of cells with GFPlow or GFPhigh expression. Source data are available online for this figure.

References

    1. Alamoudi E, Schälte Y, Müller R, Starruß J, Bundgaard N, Graw F, Brusch L, Hasenauer J (2023) FitMultiCell: simulating and parameterizing computational models of multi-scale and multi-cellular processes. Bioinformatics 39:btad674 - PMC - PubMed
    1. Atkinson MA, Bluestone JA, Eisenbarth GS, Hebrok M, Herold KC, Accili D, Pietropaolo M, Arvan PR, Von Herrath M, Markel DS et al (2011) How does type 1 diabetes develop?: the notion of homicide or β-cell suicide revisited. Diabetes 60:1370–1379 - PMC - PubMed
    1. Barzaghi F, Passerini L, Bacchetta R (2012) Immune dysregulation, polyendocrinopathy, enteropathy, X-linked syndrome: a paradigm of immunodeficiency with autoimmunity. Front Immunol 3:211 - PMC - PubMed
    1. Bennett CL, Ochs HD (2001) IPEX is a unique X-linked syndrome characterized by immune dysfunction, polyendocrinopathy, enteropathy, and a variety of autoimmune phenomena. Curr Opin Pediatr 13(6):533–538 - PubMed
    1. Boni-Schnetzler M, Mereau H, Rachid L, Wiedemann SJ, Schulze F, Trimigliozzi K, Meier DT, Donath MY (2021) IL-1beta promotes the age-associated decline of beta cell function. iScience 24:103250 - PMC - PubMed