. 2025 Feb;28(2):374-382.
doi: 10.1038/s41593-024-01839-5. Epub 2025 Jan 6.

Context-dependent decision-making in the primate hippocampal-prefrontal circuit

Affiliations

Context-dependent decision-making in the primate hippocampal-prefrontal circuit

Thomas W Elston et al. Nat Neurosci. 2025 Feb.

Abstract

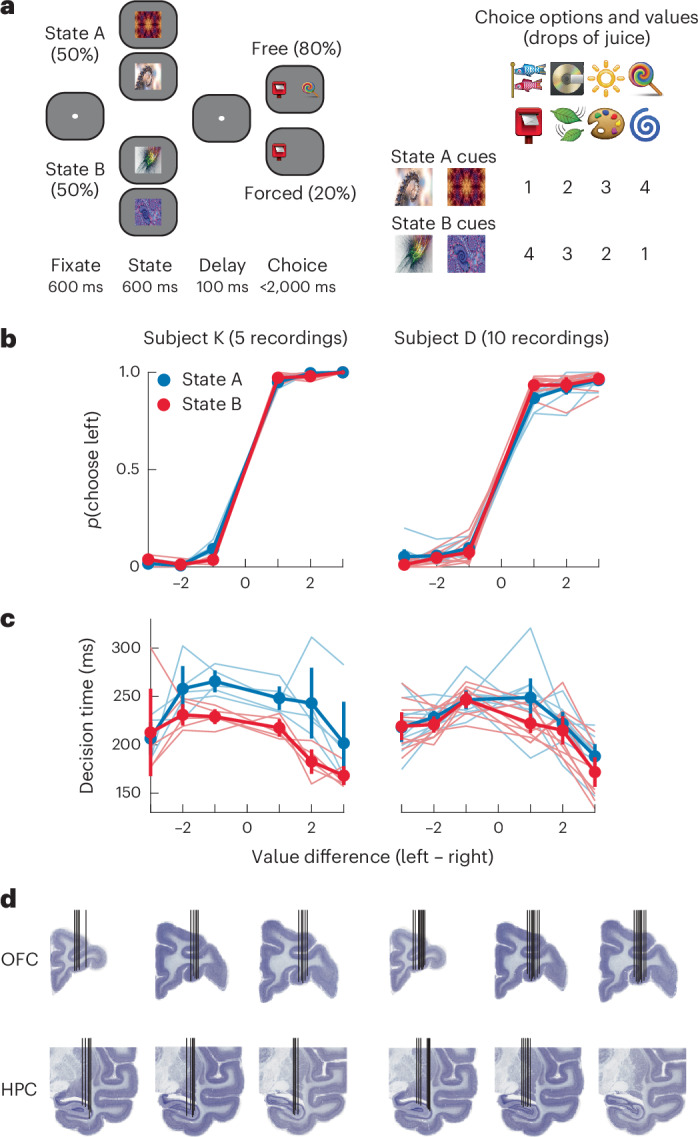
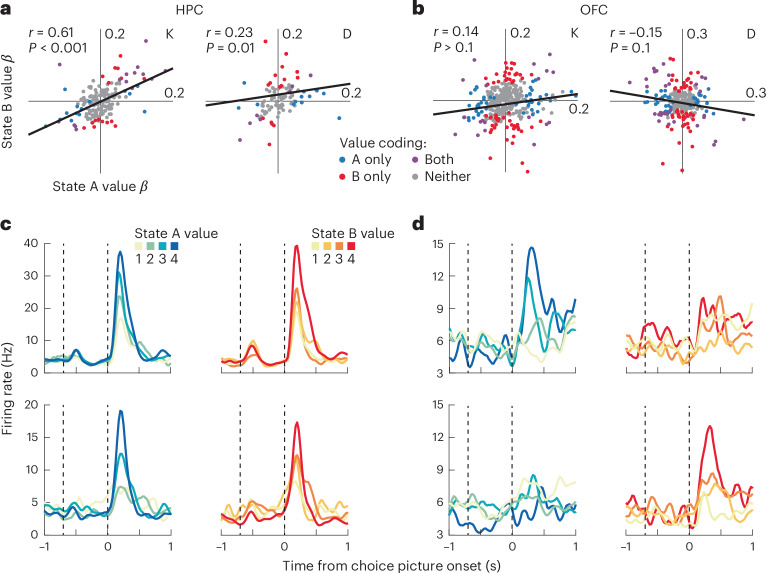
What is good in one scenario may be bad in another. Despite the ubiquity of such contextual reasoning in everyday choice, how the brain flexibly uses different valuation schemes across contexts remains unknown. We addressed this question by monitoring neural activity from the hippocampus (HPC) and orbitofrontal cortex (OFC) of two monkeys performing a state-dependent choice task. We found that HPC neurons encoded state information as it became available and then, at the time of choice, relayed this information to the OFC via theta synchronization. During choice, the OFC represented value in a state-dependent manner; many OFC neurons uniquely coded for value in only one state but not the other. This suggests a functional dissociation whereby the HPC encodes contextual information that is broadcast to the OFC via theta synchronization to select a state-appropriate value subcircuit, thereby allowing for contextual reasoning in value-based choice.


Conflict of interest statement

Competing interests: The authors declare no competing interests.

Figures

Fig. 1
Fig. 1. Behavioral task, performance and recording locations.
a, Structure of the state-dependent choice task. Subjects initially fixated and were then shown one of four state cues (two per state). After a delay, subjects were presented with either one (forced choice) or two (free choice) choice options. The optimal choice depended on the state cued earlier in the trial. States were varied pseudorandomly across trials. To unconfound neuronal activity related to the physical properties of the stimuli from the meaning they signified, we used two distinct cues for each state and value. b, Choice as a function of the difference between option values and task state. Thin lines are single sessions, and thick lines are the mean values. The error bars represent bootstrapped 95% confidence intervals. Choice was well predicted by the difference in value and did not differ across states; N = 5 recordings for subject K and N = 10 recordings for subject D. c, Choice response times plotted as in b. Choices were slower when options were closer in value; N = 5 recordings for subject K and N = 10 recordings for subject D. d, Electrode trajectories and recording locations for each subject overlayed on representative Nissl-stained coronal sections. Each black vertical line indicates a single electrode trajectory. Source data
Fig. 2
Fig. 2. Neuronal encoding of state in the HPC and OFC.
a, The prevalence of neurons that significantly encoded state in each brain area, as defined in a two-way ANOVA with factors of state and value. During the state epoch, HPC neurons, but not OFC neurons, encoded state information. The reverse was true in the choice epoch. Dashed vertical lines indicate the onset of the state and choice epochs, respectively. Horizontal bars indicate significant differences (two-sided χ2 test, P < 0.05). b, The strength of state encoding in the HPC and OFC as measured by ωp2, an unbiased measure of percent explained variance. Only neurons that significantly encoded state information during either the state or choice epoch are included. Dashed vertical lines indicate the onset of the state and choice epochs, respectively. The thick lines and shaded regions denote the mean and bootstrapped 95% confidence intervals, respectively. c, Two example HPC neurons that significantly encoded state information during the state epoch. The top neuron responded more strongly to state A, whereas the bottom neuron responded more strongly to state B. Dashed vertical lines indicate the onset of the state and choice epochs, respectively. d, Two example OFC neurons, plotted as in c, that significantly encoded state information during the choice epoch. The top neuron responded more strongly to state B, whereas the bottom neuron responded more strongly to state A. Source data
Fig. 3
Fig. 3. State-dependent value coding in the OFC and general value coding in the HPC.
a, Value beta weights for each HPC neuron in state A versus state B. Each data point is a single neuron. The r values correspond to two-sided Pearson correlations. The exact P value for subject K is 2.6 × 10−14. b, Value beta weights for each OFC neuron in state A versus state B plotted as in a. c, Two example HPC neurons (top and bottom) that encoded value similarly in both task states. Dashed vertical lines indicate the onset of the state and choice epochs, respectively. d, Two example OFC neurons, plotted as in c, which encoded value in only state A (top) or state B (bottom). Source data
Fig. 4
Fig. 4. Isomorphic population value codes are orthogonal across task states in the OFC but not the HPC.
Positions in PC space of each value in each task state. Each marker denotes a single value-in-state combination. Results are shown for each brain area and each subject separately. The left plots show the raw positions in PC space, whereas the right plots show the result of rotating the state B vector to align with the state A vector. Although the HPC vector requires only small rotations, the OFC vector requires almost a 90° rotation (around the vertical axis in subject K and around the depth axis in subject D). Source data
Fig. 5
Fig. 5. Theta activity in the HPC and OFC.
a, HPC theta phase over the course of the trial from a representative recording session from subject K. Each row represents the instantaneous phase at each of 800 trials within a single session on a single HPC electrode. Dashed vertical lines indicate fixation, state and choice epochs, respectively. b, OFC theta phase, plotted as in a, from a representative recording session from subject K. c, HPC–OFC coherence from an example session from subject K. Dashed vertical lines indicate fixation, state and choice epochs, respectively. d, Cross-trial phase alignment at theta (4–8 Hz), alpha (9–12 Hz), beta (13–30 Hz) and gamma (30–60 Hz) frequencies. Error bars represent bootstrapped 95% confidence intervals. Dashed vertical lines indicate fixation, state and choice epochs, respectively. Theta exhibited strong phase alignment to the presentation of the state cue but not the choice options. e, Time course of HPC–OFC theta coherence. Theta coherence increased shortly after the onset of the state cue and peaked at the time of choice. Error bars represent bootstrapped 95% confidence intervals. Dashed vertical lines indicate fixation, state and choice epochs, respectively. N = 42 channel pairs for subject D, and N = 28 channel pairs for subject K. Source data
Fig. 6
Fig. 6. Phase modulation of single neurons.
a, Example of phase locking from a single neuron on a single trial. Black tick marks indicate spikes. The red plus sign (+) denotes the first theta peak. Dashed vertical lines indicate state and choice epochs, respectively. This example is from the HPC in subject D. b, Mean time of the first peak of the theta rhythm following the onset of the state cue. The first theta peak occurred significantly earlier in the HPC than in the OFC in both subjects; *P < 0.001, two-sample two-sided t-test (subject K: t528 = 16.18, P = 4.0 × 10−48; subject D: t404 = 4.64, P = 4.7 × 10−6). c, Example raw LFP waveforms simultaneously recorded from the HPC and OFC during a single trial by subject K. Dashed vertical lines indicate state and choice epochs, respectively. d, Scatter plot comparing the degree of theta phase locking (Rayleigh Z statistic) during the state epoch for those 29 HPC neurons that significantly encoded state information. Neurons were significantly more phase locked during their preferred (pref) state. Each marker in the scatter plot denotes a single neuron. In the bar plots, the bars represent the mean and the error bars denote the bootstrapped 95% confidence intervals; *P < 0.001, paired t-test (t28 = 6.90, P = 1.7 × 10−7). e, Phase locking during the state epoch for 56 OFC neurons that encoded state information during the choice epoch. Neurons were significantly more phase locked during their preferred state. Each marker in the scatter plot denotes a single neuron. In the bar plots, the bars represent the mean, and the error bars denote the bootstrapped 95% confidence intervals; *P < 0.001, paired t-test (t55 = 8.30, P = 2.8 × 10−11). f, HPC state-encoding neurons exhibit greater phase modulation during the state epoch than during fixation epochs during trials of their preferred state. Each marker in the scatter plot denotes a single neuron. In the bar plots, the bars represent the mean, and the error bars denote the bootstrapped 95% confidence intervals; *P < 0.001, paired t-test (t28 = 4.96, P = 3.1 × 10−5). g, The 55 OFC neurons that encode state information during the choice epoch, but not the state epoch, show increased phase modulation in the state epoch relative to the fixation epoch during trials of their preferred state. Each marker in the scatter plot denotes a single neuron. In the bar plots, the bars represent the mean, and the error bars denote the bootstrapped 95% confidence intervals; *P < 0.001, paired t-test (t55 = 6.84, P = 6.8 × 10−9). Source data

References

    1. O’Keefe, J. & Nadel, L. The Hippocampus as a Cognitive Map (Oxford Univ. Press, 1978).
    1. Behrens, T. E. J. et al. What is a cognitive map? Organizing knowledge for flexible behavior. Neuron100, 490–509 (2018). - PubMed
    1. Knudsen, E. B. & Wallis, J. D. Hippocampal neurons construct a map of an abstract value space. Cell184, 4640–4650 (2021). - PMC - PubMed
    1. Whittington, J. C. R. et al. The Tolman–Eichenbaum machine: unifying space and relational memory through generalization in the hippocampal formation. Cell183, 1249–1263 (2020). - PMC - PubMed
    1. Whittington, J. C. R., McCaffary, D., Bakermans, J. J. W. & Behrens, T. E. J. How to build a cognitive map. Nat. Neurosci.25, 1257–1272 (2022). - PubMed

LinkOut - more resources