. 2025 Feb;28(2):268-279.
doi: 10.1038/s41593-024-01833-x. Epub 2025 Jan 6.

Typical development of synaptic and neuronal properties can proceed without microglia in the cortex and thalamus

Affiliations

Typical development of synaptic and neuronal properties can proceed without microglia in the cortex and thalamus

Mary O'Keeffe et al. Nat Neurosci. 2025 Feb.

Abstract

Brain-resident macrophages, microglia, have been proposed to have an active role in synaptic refinement and maturation, influencing plasticity and circuit-level connectivity. Here we show that several neurodevelopmental processes previously attributed to microglia can proceed without them. Using a genetically modified mouse that lacks microglia (Csf1r∆FIRE/∆FIRE), we find that intrinsic properties, synapse number and synaptic maturation are largely normal in the hippocampal CA1 region and somatosensory cortex at stages where microglia have been implicated. Seizure susceptibility and hippocampal-prefrontal cortex coherence in awake behaving animals, processes that are disrupted in mice deficient in microglia-enriched genes, are also normal. Similarly, eye-specific segregation of inputs into the lateral geniculate nucleus proceeds normally in the absence of microglia. Single-cell and single-nucleus transcriptomic analyses of neurons and astrocytes did not uncover any substantial perturbation caused by microglial absence. Thus, the brain possesses remarkable adaptability to execute developmental synaptic refinement, maturation and connectivity in the absence of microglia.


Conflict of interest statement

Competing interests: The authors declare no competing interests.

Figures
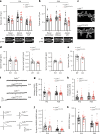
Fig. 1
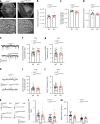
Fig. 1. Absence of brain microglia does not alter hippocampal synaptic density or properties.
a, CA1 spine density (P14). Basal secondary: (F(1,17) = 0.825, t(17) = 0.908, P = 0.377, nested Student’s t-test, n = 12 Csf1r+/+ (five male mice, seven female mice) and n = 7 Csf1rΔFIRE/ΔFIRE mice (five male mice, two female mice)). Apical oblique: (F(1,20) = 0.257, t(20) = 0.507, P = 0.617, nested Student’s t-test, n = 12 Csf1r+/+ (five male mice, seven female mice) and n = 10 Csf1rΔFIRE/ΔFIRE mice (six male mice, four female mice)). Apical tuft: (F(1,19) = 0.356, t(19) = 0.597, P = 0.558, nested Student’s t-test, n = 11 Csf1r+/+ (five male mice, six female mice) and n = 10 Csf1rΔFIRE/ΔFIRE mice (six male mice, four female mice)). b, Spine density at P28. Basal secondary: (F(1,15) = 0.260, t(15) = 0.510, P = 0.618, nested Student’s t-test, P > 0.999 Mann–Whitney U-test, n = 9 Csf1r+/+ (three male mice, six female mice) and n = 8 Csf1rΔFIRE/ΔFIRE mice (four male mice, four female mice)). Apical oblique: (F(1,16) = 0.001, t(16) = 0.036, P = 0.972, nested Student’s t-test, P > 0.667 Mann–Whitney U-test, n = 9 Csf1r+/+ (three male mice, six female mice) and n = 9 Csf1rΔFIRE/ΔFIRE mice (five male mice, four female mice)). Apical tuft dendrites: (F(1,16) = 0.872, t(16) = 0.934, P = 0.364, nested Student’s t-test, P > 0.667 Mann–Whitney U-test, n = 9 Csf1r+/+ (three male mice, six female mice) and n = 9 Csf1rΔFIRE/ΔFIRE mice (five male mice, four female mice)). Here and throughout the manuscript, the filled symbols represent independent biological replicates (animals) and the open symbols represent technical replicates (multiple cells studied per animal). c, Example STED images of CA1 apical oblique dendrites (P28). d, STED microscopy of sections of CA1 apical oblique dendrites (P28) and analysis of spine length (left: t(8) = 0.297, P = 0.774), spine neck length (middle: t(8) = 1.26, P = 0.244) and spine head width (right: t(8) = 0.646, P = 0.537); n = 5 Csf1r+/+ (two male mice, three female mice) and n = 5 Csf1rΔFIRE/ΔFIRE mice (two male mice, three female mice). e, Spine density of CA1 apical oblique dendrites derived from the STED images: t(8) = 1.16, P = 0.280 (unpaired t-test); n = 5 Csf1r+/+ (two male mice, three female mice) and n = 5 Csf1rΔFIRE/ΔFIRE mice (two male mice, three female mice). f, Miniature EPSCs recorded at P14 (top) and P28 (bottom). g,h, Amplitude (g) of miniature EPSCs at P14 (F(1,25) = 0.345, t(25) = 0.588, P = 0.562, nested Student’s t-test) and P28 (F(1,31) = 0.363, t(31) = 0.603, P = 0.551, nested Student’s t-test; P = 0.345 Mann–Whitney U-test). Miniature EPSC frequency (h) at P14 (F(1,25) = 0.0404, t(25) = 0.2010, P = 0.842, nested Student’s t-test) and P28 (F(1,31) = 0.157, t(31) = 0.397, P = 0.694 nested Student’s t-test, P = 0.625 Mann–Whitney U-test). P14: n = 16 Csf1r+/+mice (seven males, eight females, one unattributable mouse), n = 11 Csf1rΔFIRE/ΔFIRE mice (four male mice, four female mice, three unattributable mice); P28: n = 16 Csf1r+/+mice (seven male mice, nine female mice), n = 17 Csf1rΔFIRE/ΔFIRE mice (seven male mice, ten female mice). i, Example EPSC traces. AMPAR-mediated and NMDAR-mediated EPSCs were recorded at −70 mV and +40 mV respectively. j, Quantification of the NMDAR:AMPAR ratios at P14 (F(1,19) = 0.110, t(19) = 0.332, P = 0.743, nested Student’s t-test) and P42 (F(1,21) = 0.623, t(21) = 0.789, P = 0.439, nested Student’s t-test, P = 0.879 Mann–Whitney U-test). P14: n = 12 Csf1r+/+ (six male mice, six female mice) and n = 9 Csf1rΔFIRE/ΔFIRE mice (six male mice, three female mice); P42: n = 13 Csf1r+/+ (six male mice, seven female mice) and n = 10 Csf1rΔFIRE/ΔFIRE mice (five male mice, five female mice). P < 0.0001 (main age effect, two-way analysis of variance (ANOVA) on the averages of each of the animals). # indicates Šídák’s multiple comparisons test: P = 0.0022 (Csf1r+/+) and 0.0158 (Csf1rΔFIRE/ΔFIRE). k, Quantification of the decay constant of NMDAR-mediated EPSCs at P14 (F(1,19) = 0.0008, t(19) = 0.027, P = 0.978, nested Student’s t-test) and P42 (F(1,21) = 0.737, t(21) = 0.859, P = 0.400, nested Student’s t-test). P14: n = 12 Csf1r+/+ (six male mice, six female mice) and n = 9 Csf1rΔFIRE/ΔFIRE mice (five male mice, six female mice); P42: n = 13 Csf1r+/+ (six male mice, seven female mice) and n = 10 Csf1rΔFIRE/ΔFIRE mice (five male mice, five female mice). P < 0.0001 (main age effect, two-way ANOVA performed on the averages of each of the animals). # indicates Šídák’s multiple comparisons test: P < 0.0001 (Csf1r+/+) and 0.0002 (Csf1rΔFIRE/ΔFIRE). All data are shown as the mean ± s.e.m.; all statistical tests are two-sided. a, Scale bar, 3 µm. c, Scale bar, 700 nm. Source data
Fig. 2
Fig. 2. No change in intrinsic neuronal excitability or short-term plasticity in CA1 of the HPC of mice lacking microglia.
a, Representative traces of the membrane voltage of CA1 PCs at P42 in Csf1r+/+ (top) and Csf1rΔFIRE/ΔFIRE (bottom) mice in response to hyperpolarizing to depolarizing current steps (−100 to +400 pA, 25-pA steps, 500-ms duration). b, AP frequency and current relationship (F/I curve) (F(1,17) = 1.60 P = 0.223, repeated measures two-way ANOVA (genotype effect), n = 10 Csf1r+/+ mice (seven male mice, three female mice) and n = 9 Csf1rΔFIRE/ΔFIRE mice (five male mice, four female mice)). Absence of microglia during early development had no discernible effect on the CA1 pyramidal RMP (c, F(1,17) = 1.09, t(17) = 1.04, P = 0.311, nested Student’s t-test), input resistance (d, F(1,17) = 0.032, t(17) = 0.178, P = 0.861, nested Student’s t-test), rheobase (e, F(1,17) = 1.09, t(17) = 1.05, P = 0.310, nested Student’s t-test) or AP threshold (f, F(1,17) = 0.045, t(17) = 0.212, P = 0.834, nested Student’s t-test). In df, n = 10 (seven male mice, three female mice) Csf1r+/+ and n = 9 (five male mice, four female mice) Csf1rΔFIRE/ΔFIRE mice. g, Delivery of paired-pulse electrical stimulation (2× stimuli, 50-ms interval) to the Schaffer collaterals resulted in facilitating EPSCs, which did not differ between genotypes. F(1,19) = 0.413, t(19) = 0.413 P = 0.528, nested Student’s t-test (n = 10 Csf1r+/+ mice (six male mice, four female mice) and n = 11 Csf1rΔFIRE/ΔFIRE mice (five male mice, six female mice). All data are shown as the mean ± s.e.m.; all statistical tests are two-sided. Source data
Fig. 3
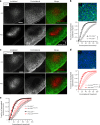
Fig. 3. Retinal inputs into the LGN segregate typically in the absence of brain microglia.
a, Example confocal images of the dorsal LGN of P4 and P10 Csf1r+/+ mice after anterograde labeling of inputs from the ipsilateral (DiI, red) and contralateral (DiO, green) retinas. b, Quantification of dorsal LGN segregation by measuring the fraction of segregated inputs at P4 (open circles) and P10 (closed triangles) in Csf1r+/+ mice (F(1,12) = 46.97, *P = 1.8 × 10−3, two-way ANOVA (age effect); n = 5 mice (P4, 3 male mice, two female mice), n = 9 mice (P10, three male mice, six female mice)). Top, Example image of DAPI/IBA1 staining. c, Example images of dorsal LGN segregation in Csf1rΔFIRE/ΔFIRE mice according to the same scheme as a. d, Dorsal LGN segregation measured at P4 (open circles) and P10 (closed triangles) in Csf1rΔFIRE/ΔFIRE mice (F(1,14) = 14.07, P = 0.002, two-way ANOVA (age effect)), n = 4 (P4, two male mice, two female mice) and n = 12 (P10, six male mice, six female mice). Top, Example image of DAPI/IBA1 staining. e, Comparison of the dorsal LGN input segregation at P10 (F(1,19) = 0.686, P = 0.418, two-way ANOVA (genotype)) and P4 (F(1,7) = 0.351, P = 0.572, two-way ANOVA (genotype)) displayed no difference between genotypes (for n see b and d). All data are shown as the mean ± s.e.m. and all statistical tests are two-sided. a, Scale bar, 100 µm. b, Scale bar, 50 µm. c, Scale bar, 100 µm. d, Scale bar, 50 µm. Source data
Fig. 4
Fig. 4. Assessment of synaptic properties in the development of the somatosensory cortex in the absence of microglia.
a, Example vesicular glutamate transporter 2 (VGLUT2) immunofluorescence images of the somatosensory barrel cortex from Csf1r+/+ (left) and Csf1rΔFIRE/ΔFIRE (right) mice. b, Quantification of the neocortical area occupied by the barrel field (t(16) = 1.01, P = 0.329, Student’s two-tailed t-test), n = 10 Csf1r+/+ and n = 8 Csf1rΔFIRE/ΔFIRE mice. c, Caudal and rostral relative position of the barrel field (t(16) = 2.01, P = 0.062, Student’s two-tailed t-test), n = 10 Csf1r+/+ and n = 8 Csf1rΔFIRE/ΔFIRE mice. d, VGLUT2 staining intensity in the barrel cortex: t(15) = 0.78, P = 0.448, Student’s t-test, n = 9 Csf1r+/+ and n = 8 Csf1rΔFIRE/ΔFIRE mice. e, Example of spontaneous EPSC recordings from P14 L4 stellate cells at −70 mV. f,g, No difference in spontaneous EPSC amplitude (f, F(1,23) = 3.36, t(23) = 1.83, P = 0.081, nested Student’s t-test) or frequency (g, F(1,23) = 0.029, t(23) = 0.171, P = 0.866, nested Student’s t-test), n = 13 Csf1r+/+ mice (eight male mice, five female mice) and n = 12 Csf1rΔFIRE/ΔFIRE mice (six male mice, six female mice). h, Example of spontaneous IPSC potential recordings from P14 L4 stellate cells. i,j, No difference in spontaneous IPSC amplitude (i, F(1,23) = 2.05, t(23) = 1.43, P = 0.166, nested Student’s t-test) or frequency (j, F1,23) = 0.003, t(23) = 0.050, P = 0.961, nested Student’s t-test); n = 13 Csf1r+/+ mice (eight male mice, five female mice) and n = 12 Csf1rΔFIRE/ΔFIRE mice (six male mice, six female mice). k, Example of traces of EPSCs recorded in L4 stellate cells. l, AMPAR-mediated and NMDAR-mediated EPSCs were measured after stimulation of thalamo-cortical afferents. Quantification of the NMDAR:AMPAR EPSC ratios confirmed no genotype difference at P14 (F(1,25) = 0.330, t(25) = 0.574, P = 0.571, nested Student’s t-test) or P42 (F(1,28) = 0.809, t(28) = 0.899, P = 0.376, nested Student’s t-test). P14: n = 14 Csf1r+/+ mice (seven male mice, seven female mice) and n = 13 Csf1rΔFIRE/ΔFIRE mice (eight male mice, five female mice); P42: n = 15 Csf1r+/+ (eight male mice, seven female mice) and n = 15 Csf1rΔFIRE/ΔFIRE mice (six male mice, nine female mice). m, Measurement of the NMDAR-mediated EPSC decay time constant (τ) revealed a small difference at P14 (F(1,25) = 6.69, t(25) = 2.59, P = 0.016, nested Student’s t-test; n = 14 Csf1r+/+ (seven male mice, seven female mice) and n = 13 Csf1rΔFIRE/ΔFIRE mice (eight male mice, five female mice)). No difference was observed at P42 (F(1,28) = 0.410, t(28) = 0.641, P = 0.527, nested Student’s t-test; n = 15 Csf1r+/+ (eight male mice, seven female mice) and n = 15 Csf1rΔFIRE/ΔFIRE mice (six male mice, nine female mice)). All data are shown as the mean ± s.e.m.; all statistical tests are two-sided. a, Scale bars, 1 mm (top) and 200 µm (bottom). Source data
Fig. 5
Fig. 5. No change in intrinsic neuronal excitability or short-term plasticity in the somatosensory cortex of mice lacking microglia.
a, Representative traces of the membrane voltage of L4 stellate cells at P42 in Csf1r+/+ (top) and Csf1rΔFIRE/ΔFIRE (bottom) mice in response to hyperdepolarizing to depolarizing current steps (−100 to +400 pA, 25-pA steps, 500-ms duration). b, AP frequency and current relationship (F/I curve) (F(1,21) = 0.401 P = 0.533, repeated measures two-way ANOVA (genotype effect), n = 12 Csf1r+/+ mice (nine male mice, three female mice) and n = 11 Csf1rΔFIRE/ΔFIRE mice (seven male mice, four female mice)). cf, We observed no change in RMP (c, F(1,21) = 0.216, t(21) = 0.465, P = 0.647, nested Student’s t-test), input resistance (d, F(1,21) = 3.51, t(21) = 1.87, P = 0.075, nested Student’s t-test), rheobase (e, F(1,21) = 0.766, t(21) = 0.875, P = 0.391, nested Student’s t-test) and AP threshold (f, F(1,21) = 0.206, t(21) = 0.454, P = 0.655, nested Student’s t-test). In cf, n = 12 Csf1r+/+ (nine male mice, three female mice) and n = 11 Csf1rΔFIRE/ΔFIRE (seven male mice, four female mice) mice. g,h, Delivery of paired-pulse electrical stimulation (2× stimuli, 50-ms interval) to thalamo-cortical afferents (g) resulted in nonfacilitating EPSCs (h), which did not differ between genotypes at P42 (F(1,15) = 1.10, t(15) = 1.047, P = 0.312, nested Student’s t-test), n = 7 Csf1r+/+ (five male mice, two female mice) and n = 10 Csf1rΔFIRE/ΔFIRE mice (six male mice, four female mice). All data are shown as the mean ± s.e.m.; all statistical tests are two-sided. Source data
Fig. 6
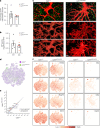
Fig. 6. snRNA-seq analysis of neurons from the P14 neocortex.
a, Clustering of single nuclei (t-distributed stochastic neighbor embedding (t-SNE) projection) selected based on the expression of the excitatory neuron marker Slc17a7 (VGLUT1). Top, Clusters of nuclei whose percentage abundance is shown in the bottom graph (n = 6 per genotype). F(1,100) = 4.3 × 10−3, P = 0.995 (genotype effect, two-way ANOVA). b, The expression of cortical layer markers is compared between genotypes. Pseudobulk differential gene expression analysis revealed no differences in gene expression between Csf1r+/+ and Csf1rΔFIRE/ΔFIRE mice. c, Clustering of single nuclei (t-SNE projection) selected based on the expression of the inhibitory neuron markers Gad1 and Gad2. Top, Clusters of nuclei whose percentage abundance is shown in the bottom graph (n = 6 per genotype). F(1,50) = 0.0004, P = 0.985 (genotype effect), two-way ANOVA. d, The expression of inhibitory neuron subtype markers was compared between genotypes. Pseudobulk differential gene expression analysis revealed no differences in gene expression between Csf1r+/+ and Csf1rΔFIRE/ΔFIRE mice. In a,b, n = 6 Csf1r+/+ mice (three male mice, three female mice) and n = 6 Csf1rΔFIRE/ΔFIRE mice (three male mice, three female mice). All data are shown as the mean ± s.e.m.; all statistical tests are two-sided. Source data
Fig. 7
Fig. 7. Study of astrocytes in Csf1rΔFIRE/ΔFIRE mice.
a, Percentage of the total area analyzed occupied by GFAP immunoreactivity in confocal stacks in CA1; t(7) = 0.799, P = 0.451, unpaired t-test (n = 5 Csf1r+/+ mice; n = 4 Csf1rΔFIRE/ΔFIRE mice). b, SYP puncta (from 10 nm to 1 µm in diameter) engulfed totally by GFAP immunoreactivity (n = 5 Csf1r+/+ mice; n = 4 Csf1rΔFIRE/ΔFIRE mice). t(7) = 0.760, P = 0.472, unpaired t-test. c, Example images of imaged sections from Csf1r+/+ and Csf1rΔFIRE/ΔFIRE mice. Top, Raw two-dimensional (2D) maximum projection image. Middle, 3D transparent render with engulfed puncta shown. Bottom, 3D surface render with engulfed puncta now not visible. df, scRNA-seq of astrocytes. d, Astrocytes were sorted using FACS from the neocortex at P14 (n = 4 per genotype, each two male mice and two female mice) and subject to scRNA-seq (10x Genomics). Small non-astrocyte-contaminating cell populations were removed and astrocytes reclustered. Co-clustering of astrocytes from both genotypes (t-SNE projection) is shown. e, Results of the pseudobulk gene expression analysis: 11 genes were altered out of 13,257. f, Expression of the indicated genes. S100b and Aldh1l1 are astrocyte markers (unchanged). Megf10 and Mertk are key phagocytic genes (unchanged). Gbp and Vim are reactive markers (unchanged). Examples of altered genes (Gfap and Tagln2) are shown. All data are shown as the mean ± s.e.m.; all statistical tests are two-sided. c, Scale bar, 2 µm. Source data
Fig. 8
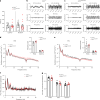
Fig. 8. Normal seizure susceptibility and coherence of HPC and PFC oscillatory activity in awake behaving animals.
a, After administration of PTZ, we compared seizure latency (t(18) = 0.221, P = 0.828, two-tailed Student’s t-test, P = 0.882 Mann–Whitney U-test) and total seizure duration (t(18) = 0.233, P = 0.819 two-tailed Student’s t-test, P = 0.565 Mann–Whitney U-test) between genotypes; n = 9 Csf1r+/+ and n = 11 Csf1rΔFIRE/ΔFIRE mice. b,c, Example traces of LFPs from HPC and PFC of the indicated genotypes (Csf1r+/+ (b) and Csf1rΔFIRE/ΔFIRE (c)) subjected to a band-pass filter. d,e, Spectral plot of oscillatory power of LFP in the CA1 of HPC (d) or PFC (e) of Csf1r+/+ (black) and Csf1rΔFIRE/ΔFIRE (red) mice. The reduction in power around 50 Hz reflects notch filtering of the electrical line frequency. Insets, Quantification of relative oscillatory power for the theta (4–12 Hz) and gamma (30–80 Hz) frequency bands, normalized to total power. We observed no difference in relative power between genotypes in the HPC (F(1,22) = 3.57, P = 0.072, two-way ANOVA) or PFC (F(1,22) = 0.009, P = 0.926, two-way ANOVA (genotype)); n = 7 Csf1r+/+ (three male mice, four female mice) and n = 6 Csf1rΔFIRE/ΔFIRE mice (three male mice, three female mice). f,g, In vivo recording of LFPs in both CA1 of the HPC and of the medial PFC (f) revealed no apparent divergence in oscillatory coherence in theta, beta or gamma bands (g). F(1,33) = 0.117, P = 0.735, two-way ANOVA (genotype effect); F(2,33) = 0.249, P = 0.781 (genotype-frequency interaction). All data are shown as the mean ± s.e.m.; all statistical tests are two-sided. Source data
Extended Data Fig. 1
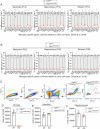
Extended Data Fig. 1. Molecular and anatomical characterisation of Csf1rΔFIRE/ΔFIRE mice during early development.
All data are shown as mean ± s.e.m. and all statistical tests are two-sided a, b) RNA sequencing data showing the relative expression of microglia-specific genes in the Csf1rΔFIRE/ΔFIRE compared to Csf1r+/+ for neocortex (left), hippocampus (middle) and striatum (right), at P14 (A) or P42 (B). Genes were selected based on previously published single-cell sequencing data (Ziesel et al., 2018) that described 265 subclusters in the CNS and PNS. To define microglia-enriched genes, we calculated the fold-enrichment of expression in the ‘MGL1’ subcluster relative to the next highest expressing non-immune cell subcluster, requiring an average of ≥1 FPKM in wild-type mice. Data relating to genes with a microglial enrichment of ≥50-fold are shown. Sample size at P14: 6 Csf1r+/+ mice, 6 Csf1rΔFIRE/ΔFIRE mice (3 males and 3 females for both). Sample size at P42: 3 Csf1r+/+ mice, 4 Csf1rΔFIRE/ΔFIRE mice. c-f) Cells from the neocortex of P14 mice of the indicated genotypes were analysed by flow cytometry (see Methods). (c) shows the sequential gating strategy and example plots of CD11b (x-axis) and CD45 (y-axis) illustrating the loss of CD11b+/CD45low microglia in mice, with far less abundant CD11b+/CD45high border-associated macrophages retained, (d-f) shows quantitation of microglia, astrocytes and oligodendrocytes (n = 4 per genotype).
Extended Data Fig. 2
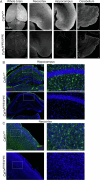
Extended Data Fig. 2. Loss of IBA1-positive microglia in the Csf1rΔFIRE/ΔFIRE mouse.
a) Example images (representative of 3 repeats) from whole-brain imaging performed using iDISCO. Brains were labelled for IBA1 (greyscale) for Csf1r+/+(upper) and Csf1rΔFIRE/ΔFIRE (lower) mice at P28. Flattened volume images are shown for the whole brain (left), neocortex (middle left), hippocampus (middle right), and cerebellum (right). Note the prominent labelling for Iba1 in Csf1r+/+ brains, but not Csf1rΔFIRE/ΔFIRE brains. Scale bars: 500 µm (left, whole brain), 100 µm (middle, right, sub-regions). Note that the tiny amount of residual IBA1 staining in the Csf1rΔFIRE/ΔFIRE brains is due to border-associated macrophages. b, c) Conventional immunohistochemical analysis of IBA1 expression (green), counterstained with DAPI, in the indicated brain regions of Csf1r+/+ and Csf1rΔFIRE/ΔFIRE mice at P14. Scale bar: 200 µm. Images are representative of 6 repeats.
Extended Data Fig. 3
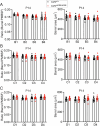
Extended Data Fig. 3. Assessing motor control in young pups.
All data are shown as mean ± s.e.m. a-c) Mouse pup innate motor reflex testing. (a) shows time to turn over in righting reflex task. (b) and (c) relate to the negative geotaxis task, showing the time to reorientate uphill (b) and number of failed attempts (c); n = 6 mice per genotype (3 males, 3 females).
Extended Data Fig. 4
Extended Data Fig. 4. Absence of microglia during neurodevelopment does not lead to changes in CA1 pyramidal cell gross morphology.
All data are shown as mean ± s.e.m. and all statistical tests are two-sided. a) Example 2D reconstructions of the somato-dendritic axis of dye-filled CA1 pyramidal cells from Csf1r+/+(upper) and Csf1rΔFIRE/ΔFIRE (lower) P14 mice. Scale bars: 100 µm. b) Sholl analysis of reconstructed P14 CA1 pyramidal cell dendrites from Csf1r+/+ (n = 13 mice) and Csf1rΔFIRE/ΔFIRE (n = 13 mice). We observed no difference of Sholl distribution between Csf1r+/+ (black) and Csf1rΔFIRE/ΔFIRE (red) mice at P14 (F(1,24) = 0.038, P = 0.847, 2-way ANOVA [genotype]); F(36,864) = 0.826, P = 0.758 [genotype_x_dendrite interaction]); n = 13 Csf1r+/+ (n = 13 mice, 5 m/8 f) and 13 Csf1rΔFIRE/ΔFIRE mice (6 m/7 f). c) No difference in the length of difference dendritic types for reconstructed CA1 pyramidal cells at basal secondary, apical oblique, or apical tuft dendrites. Basal Secondary: F(1,24) = 0.596, t(24) = 0.772, P = 0.448, nested Student’s t-test; Apical oblique: F(1,24) = 1.161, t(24) = 1.077, P = 0.292, nested Student’s t-test; Apical tuft: F(1,24) = 1.55, t(24) = 1.245, P = 0.225, nested Student’s t-test. d) No difference in number of dendrites for CA1 pyramidal cells (P14) was observed at primary, secondary or tertiary dendrites. Primary: F(1,24) = 0.621, t(24) = 0.788, P = 0.439, nested Student’s t-test; Secondary: F(1,24) = 0.143, t(24) = 0.378, P = 0.709, nested Student’s t-test; Tertiary: F(1,24) = 0.020, t(24) = 0.141, P = 0.889, nested Student’s t-test. e) Reconstructions of CA1 pyramidal cells from P28 mice. f) No difference in Sholl distributions of CA1 pyramidal cell dendrites at P28 from Csf1r+/+ and Csf1rΔFIRE/ΔFIRE mice; F(1,22) = 0.929, P = 0.346, 2-way ANOVA [genotype]; F(36,792) = 0.905, P = 0.631 [genotype X distance interaction]. g) There was no change in the lengths of different dendrite types of CA1 pyramidal cells at P28 at basal secondary, apical oblique, or apical tuft dendrites. Basal secondary: F(1,19) = 2.346, t(19) = 1.532, P = 0.142, nested Student’s t-test; Apical oblique: F(1,19) = 0.350, t(19) = 0.592, P = 0.561, nested Student’s t-test; Apical tuft: F(1,19) = 0.413, t(19) = 0.643, P = 0.528, nested Student’s t-test; n = 10 Csf1r+/+ (4 m/6 f) and 11 Csf1rΔFIRE/ΔFIRE mice (6 m/5 f). h) We observed no difference in the number of primary secondary or tertiary dendrites at P28 in CA1 pyramidal cells. Primary: F(1,20) = 0.172, t(20) = 0.415, P = 0.682, nested Student’s t-test; Secondary: F(1,20) = 0.909, t(20) = 0.954, P = 0.352, nested Student’s t-test; Tertiary: F(1,20) = 2.33, t(20) = 1.53, P = 0.143, nested Student’s t-test; n = 11 Csf1r+/+ (5 m/6 f) and 11 Csf1rΔFIRE/ΔFIRE mice (6 m/5 f).
Extended Data Fig. 5
Extended Data Fig. 5. Analysis of synaptic plasticity.
All data are shown as mean ± s.e.m. and all statistical tests are two-sided. a) Time-course of long-term potentiation (LTP) at Schaffer-Collateral afferents in hippocampal area CA1, for Csf1r+/+ (black) and Csf1rΔFIRE/ΔFIRE (red) mice at P14. Data is shown for 1 hour following 2×1 s 100 Hz tetanic stimulation (arrow). Example traces are shown for each genotype, before (black) and after (grey) LTP induction. Quantification of the magnitude of LTP for both genotypes revealed no difference (t(15) = 0.31, P = 0.761, 2-tailed Student’s t-test), n = 9 Csf1r+/+ and 8 Csf1rΔFIRE/ΔFIRE mice. b) Time-course of long-term depression (LTD) of the Schaffer-Collateral afferents to CA1, induced by application of 50 µM R, S-DHPG (grey bar) in P14 mice. The magnitude of LTD, as measured 50–60 minutes after DHPG application revealed no effect of genotype (t(18) = 0.486, P = 0.633, 2-tailed Student’s t-test), n = 12 Csf1r+/+ and 8 Csf1rΔFIRE/ΔFIRE mice.
Extended Data Fig. 6
Extended Data Fig. 6. An absence of microglia does not alter the segregation of and size of individual somatosensory barrels.
All data are shown as mean ± s.e.m. and all statistical tests are two-sided. Ratio: The ratio of the barrel area in relation to the total area of the PMBSF. Barrel area: area of individual barrels 1–4 in rows B, C and D of the barrel field. a-c) Statistics (left-to right): F(1, 22) = 3.26E-31, P > 0.999; F(1, 22) = 1.588, P = 0.221 (a). F(1, 22) = 1.63E-30, p > 0.999; F (1, 22) = 0.2076, P = 0.653 (b). F(1, 22) = 1.165E-29, P > 0.999; F(1, 22) = 0.557, P = 0.464 (c). All are two-way ANOVAs [genotype effect], n = 12 mice of each genotype.
Extended Data Fig. 7
Extended Data Fig. 7. Analysis of astrocytes in the mouse hippocampus.
All data are shown as mean ± s.e.m. and all statistical tests are two-sided. a, b) Measurement of astrocyte density using an antibody against the pan-astrocyte marker ALDH1L1. Upper graph shows percent of DAPI-positive cells (t(7) = 0.657, P = 0.532 (unpaired t-test), lower graph shows density of astrocytes per 100 µm2 (t(7) = 2.88, P = 0.024 (unpaired t-test)). Scale bar: 200 µm. c, d) Analysis as per (a, b) except that an antibody against GFAP was employed (t(7) = 0.750, P = 0.478 (upper)); (t(7) = 0.273, P = 0.793 (lower, unpaired t-test)), n = 5 Csf1r+/+ (3 m/2 f) and n = 4 (2 m/2 f) Csf1rΔFIRE/ΔFIRE mice. Scale bar: 200 µm.
Extended Data Fig. 8
Extended Data Fig. 8. Analysis of astrocytes in the mouse neocortex.
All data are shown as mean ± s.e.m. and all statistical tests are two-sided. a, b) Measurement of astrocyte density using an antibody against the pan-astrocyte marker ALDH1L1. Upper graph shows percent of DAPI-positive cells; lower graph shows density of astrocytes (per 100 µm2). F(1, 35) = 0.0009, P = 0.977 (upper); F(1, 35) = 0.1.2E-05, P = 0.997 (lower, 2-way ANOVA, genotype effect). Scale bar: 200 µm c, d) Analysis as per (a, b) except that an antibody against GFAP was employed. c: F(1, 35) = 8.81, P = 0.0054. 2-way ANOVA (genotype effect). No individual layer showed statistical significance (Sidak’s post-hoc test). d: F(1, 35) = 6.55, P = 0.015, 2-way ANOVA (genotype effect). No individual layer showed statistical significance (Sidak’s post-hoc test). N = 5 Csf1r+/+ (3 m/2 f) and n = 4 (2 m/2 f) Csf1rΔFIRE/ΔFIRE mice. Scale bar: 200 µm.

Comment in

References

    1. Südhof, T. C. Towards an understanding of synapse formation. Neuron100, 276–293 (2018). - PMC - PubMed
    1. Hammond, T. R., Robinton, D. & Stevens, B. Microglia and the brain: complementary partners in development and disease. Annu. Rev. Cell Dev. Biol.34, 523–544 (2018). - PubMed
    1. Paolicelli, R. C. et al. Synaptic pruning by microglia is necessary for normal brain development. Science333, 1456–1458 (2011). - PubMed
    1. Hoshiko, M., Arnoux, I., Avignone, E., Yamamoto, N. & Audinat, E. Deficiency of the microglial receptor CX3CR1 impairs postnatal functional development of thalamocortical synapses in the barrel cortex. J. Neurosci.32, 15106–15111 (2012). - PMC - PubMed
    1. Neniskyte, U. & Gross, C. T. Errant gardeners: glial-cell-dependent synaptic pruning and neurodevelopmental disorders. Nat. Rev. Neurosci.18, 658–670 (2017). - PubMed

MeSH terms

Substances

LinkOut - more resources