. 2025 Jan 6;23(1):23.
doi: 10.1186/s12967-024-06038-1.

Identification of macrophage polarisation and mitochondria-related biomarkers in diabetic retinopathy

Affiliations

Identification of macrophage polarisation and mitochondria-related biomarkers in diabetic retinopathy

Weifeng Liu et al. J Transl Med. .

Abstract

Background: The activation of macrophages or microglia in patients' whole body or local eyes play significant roles in diabetic retinopathy (DR). Mitochondrial function regulates the inflammatory polarization of macrophages. Therefore, the common mechanism of mitochondrial related genes (MRGs) and macrophage polarisation related genes (MPRGs) in DR is explored in our study to illustrate the pathophysiology of DR.

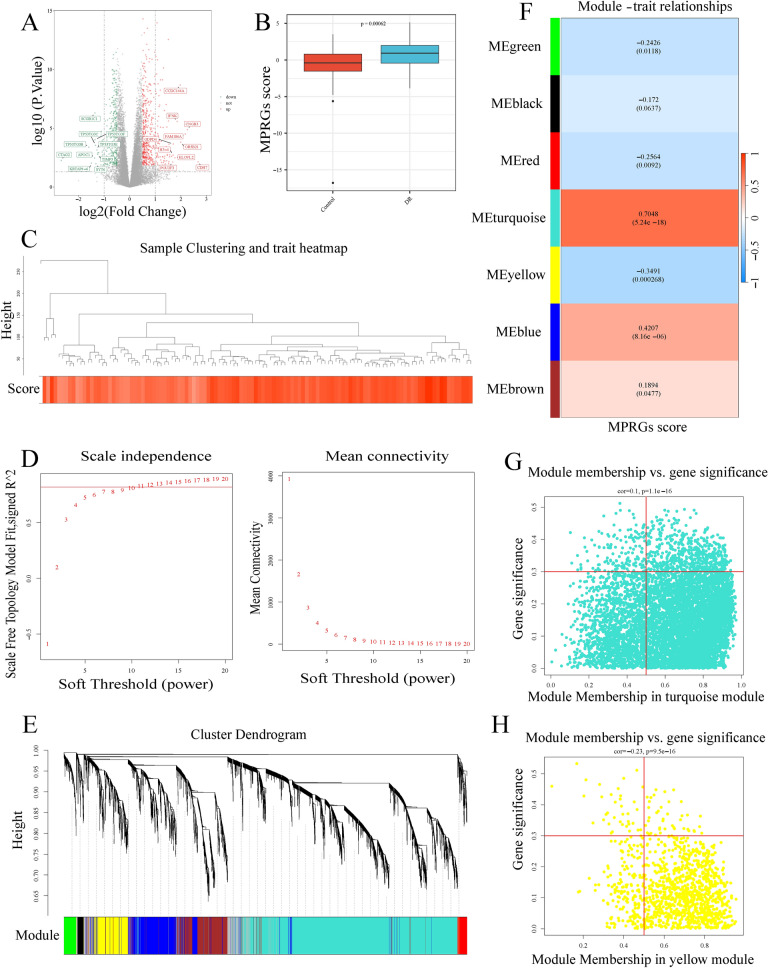
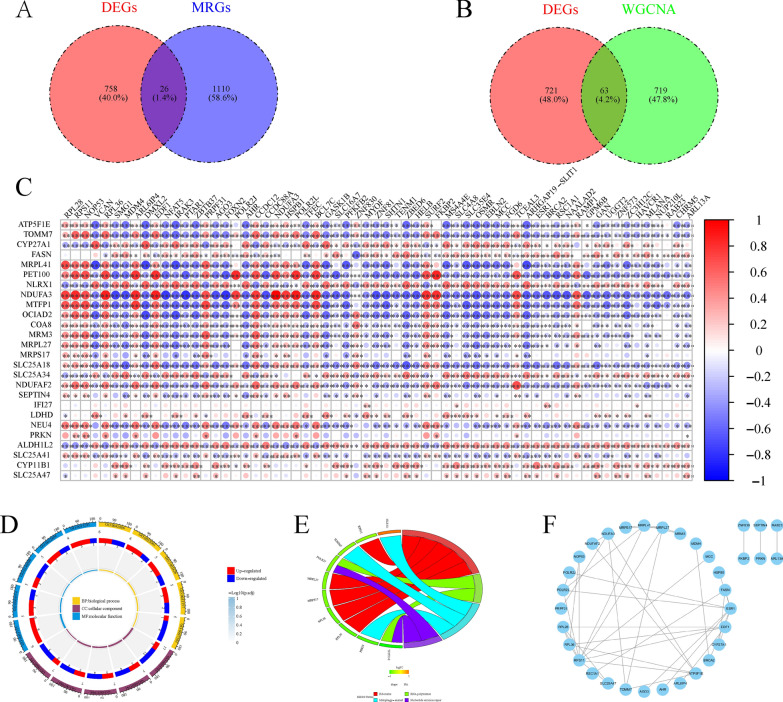
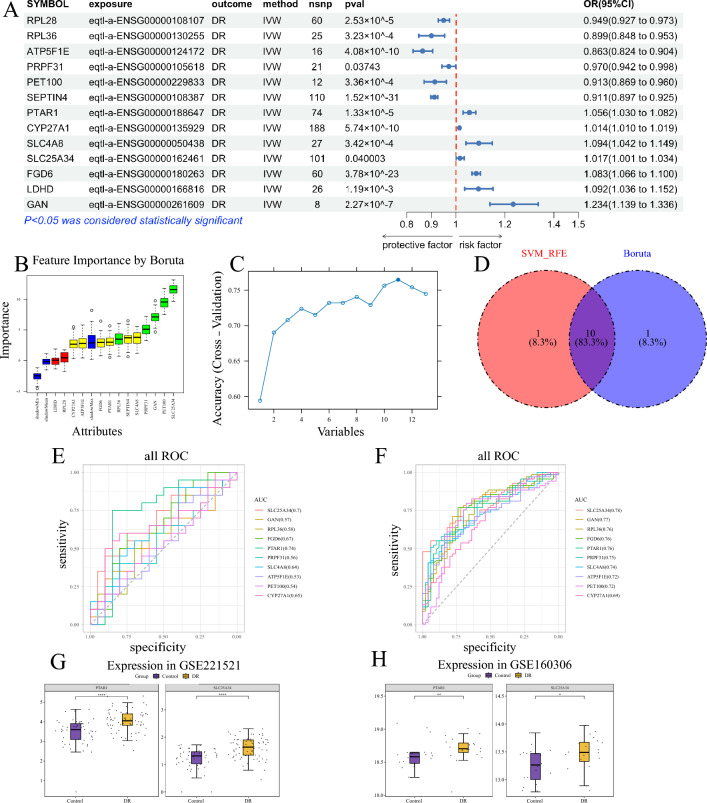
Methods: In this study, using common transcriptome data, differentially expressed genes (DEGs) were firstly analysed for GSE221521, while module genes related to MPRGs were obtained by weighted gene co-expression network analysis (WGCNA), intersections of DEGs with MRGs were taken, intersections of DEGs with module genes of the MPRGs were taken. After that, correlation analyses were performed to obtain candidate genes. Key genes were obtained by Mendelian randomisation (MR) analysis, then biomarkers were obtained by machine learning combined with receiver operating characteristic (ROC) and expression validation between DR and control cohorts in GSE221521 and GSE160306 to obtain biomarkers. Finally, biomarkers were subjected to immune infiltration analysis, gene set enrichment analysis (GSEA), and gene-gene interaction (GGI) analysis.

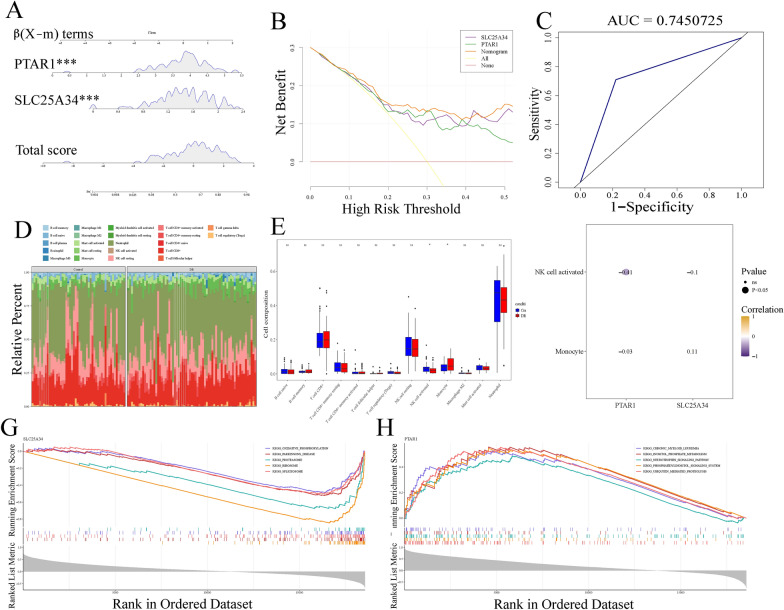
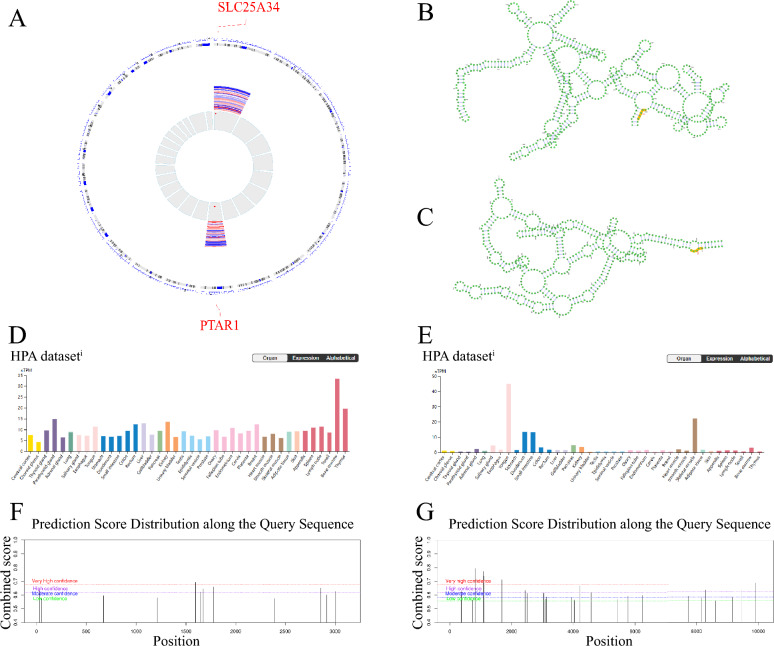
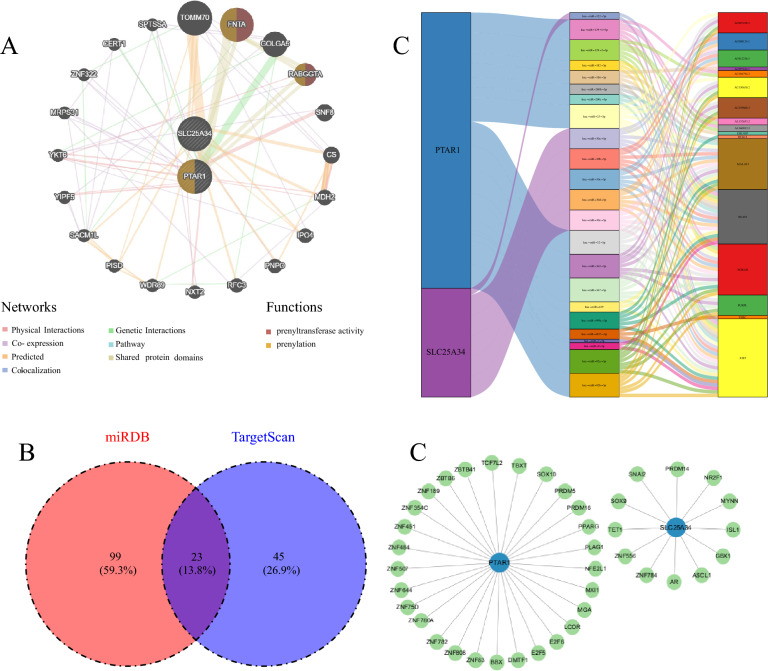
Results: A number of 784 of DEGs were taken to intersect with 1136 MRGs and 782 MPRGs, respectively, after which 89 genes with correlation were taken as candidate genes. MR analysis yielded 13 key genes with clear causal links to DR. The expression trends of PTAR1 and SLC25A34 were consistent and notable between DR cohort and control cohort in GSE221521 and GSE160306. So PTAR1 and SLC25A34 were used as biomarkers. Immune infiltration analysis showed that activated NK cell and Monocyte were notably different between DR cohort and control cohorts, and PTAR1 showed the strongest positive correlations with activated NK cell. Both biomarkers were enriched in lysosome and insulin signaling pathway. The GGI network showed that biomarkers associated with prenyltransferase activity and prenylation function.

Conclusion: This study identified two biomarkers (PTAR1 and SLC25A34) which explore the pathogenesis of DR and provide reference targets for drug development.

Keywords: Diabetic retinopathy; Macrophage polarisation; Mitochondria; PTAR1; SLC25A34.


Conflict of interest statement

Declarations. Ethics approval and consent to participate: Specific ethical approval was not required for this study because all data were obtained from sources available to the public. Consent for publication: Not appliable. Competing interests: The authors declare that they have no competing interests.

Figures

Fig. 1
Fig. 1
Screening of DEGs and modular genes. A Volcano plot of 784 differentially expressed genes in DR. B Macrophage polarisation related genes score was notably higher in the DR group than in the control group in GSE221521 (p < 0.05) C Hierarchical clustering of DR samples revealed 1 outlier sample and excluded it. D Determining the optimal soft threshold β of 12. E Construction of gene co-expression network, aggregated 7 modules were. F Heatmap of the correlation between modules and MPRGs scores. G Scatter plot of gene-module membership in the blue-green module. H Scatter plot of gene-module membership in the yellow module
Fig. 2
Fig. 2
The crucial biological pathways and PPI networks for candidate genes. A 26 DE-MRGs were obtained from Venn diagram of 784 DEGs and 1,136 MRGs. B 63 DE-MPRGs were obtained from Venn diagram of 784 DEGs and 782 WGCNA module genes. C 88 genes were obtained as candidate genes by Spearman correlation analysis of DE-MRGs and DE-MPRGs. D Circular plot of GO enrichment for candidate genes. E KEGG pathway diagram for candidate genes. F PPI network for candidate genes
Fig. 3
Fig. 3
Establishment of PTAR1 and SLC25A34 as biomarkers for DR. A MR results of 13 key genes. B Boruta analysis for 13 genes identified 11 candidate biomarkers. C SVM-RFE analysis for 13 genes identified 11 candidate biomarkers. D Venn diagram for Boruta analysis and SVM-RFE analysis identified 10 candidate biomarkers. E ROC curve of candidate biomarkers in GSE221521 identified PTAR1 and SLC25A34 as biomarkers. F ROC curve for candidate biomarkers in GSE160306. G Expression levels of PTAR1 and SLC25A34 in GSE221521. H Expression levels of PTAR1 and SLC25A34 in GSE160306
Fig. 4
Fig. 4
Nomogram diagnostics, immune cells analysis and GSEA analysis of PTAR1 and SLC25A34. A Nomogram of PTAR1 and SLC25A34 found PTAR1 and SLC25A34 have better diagnostic ability for DR. B Decision Curve Analysis of the nomogram found nomogram had the best predictions. C ROC curve of the nomogram indicated that it was a good reliability of prediction model for DR occurrence. D Immune cell infiltration between DR and control groups obtained 13 immune cells. E Differences in immune cells between DR and control groups. F Correlation between biomarkers and different immune cells. G GSEA of SLC25A34. H GSEA of PTAR1
Fig. 5
Fig. 5
The expression of SLC25A34 and PTAR1 in different tissues. A Chromosomal localization revealed SLC25A34 gene on chromosome 9 and PTAR1 gene on chromosome 1. B predicted structures of SLC25A34 secondary structure m6A loci. C predicted structures of PTAR1 secondary structure m6A loci. D Expression of PTAR1 in different human tissues. E Expression of SLC25A34 in different human tissues. F prediction of SLC25A34 m6A locus. G Prediction of PTAR1 m6A locus
Fig. 6
Fig. 6
The network construction analysis of SLC25A34 and PTAR1. A GGI network of SLC25A34 and PTAR1 showed that biomarkers associated with prenyltransferase activity and prenylation function. B Venn diagram of miRNAs obtained from the miRDB and TargetScan databases. C lncRNA-miRNA-mRNA network. D TFs-mRNA network

Similar articles

Cited by

References

    1. Wong TY, Cheung CM, Larsen M, Sharma S, Simó R. Diabetic retinopathy. Nat Rev Dis Primers. 2016;2:16012. - PubMed
    1. Gardner TW, Antonetti DA. Novel potential mechanisms for diabetic macular edema: leveraging new investigational approaches. Curr Diab Rep. 2008;8:263–9. - PubMed
    1. Gangwani RA, Lian JX, McGhee SM, Wong D, Li KK. Diabetic retinopathy screening: global and local perspective. Hong Kong Med J. 2016;22:486–95. - PubMed
    1. Penn JS, Madan A, Caldwell RB, Bartoli M, Caldwell RW, Hartnett ME. Vascular endothelial growth factor in eye disease. Prog Retin Eye Res. 2008;27:331–71. - PMC - PubMed
    1. Wells JA, Glassman AR, Ayala AR, Jampol LM, Aiello LP, Antoszyk AN, Arnold-Bush B, Baker CW, Bressler NM, Browning DJ, et al. Aflibercept, bevacizumab, or ranibizumab for diabetic macular edema. N Engl J Med. 2015;372:1193–203. - PMC - PubMed

LinkOut - more resources